Patterns of Healthcare Utilization and Spending Among Homebound Older Adults in the USA: an Observational Study
- PMID: 35945471
- PMCID: PMC9362988
- DOI: 10.1007/s11606-022-07742-8
Patterns of Healthcare Utilization and Spending Among Homebound Older Adults in the USA: an Observational Study
Abstract
Background: Homebound older adults have complex social, medical, and financial needs, but little is known about their healthcare utilization and spending.
Objective: To characterize healthcare utilization and spending among homebound older adults.
Design: Cohort study using National Health and Aging Trends Study data linked to Medicare Fee-for-Service (FFS) claims data.
Participants: Adults aged 70 years and older with Medicare FFS coverage (n = 6468).
Main measures: In a person-year analysis, survey-weighted rates and adjusted marginal differences in inpatient, outpatient, and emergency department utilization and spending 12 months post-interview were calculated by homebound status, defined as reporting never or rarely (no more than 1 day/week) leaving home in the last month.
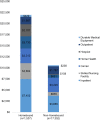
Key results: Compared to the non-homebound, homebound observations had lower annual unadjusted rates of accessing primary care (60.9% vs 71.9%, p < 0.001) and specialist care (61.0% vs 74.9%, p < 0.001) and higher annual rates of emergency department use (54.0% vs 32.6%, p < 0.001) and hospitalization (39.8% vs 19.8%, p < 0.001). Total annual Medicare spending was $11,346 higher among the homebound compared to the non-homebound (p < 0.001). In a single year analysis (2015), homebound older adults accounted for 11.0% of Medicare spending among those over 70 despite making up only 5.7% of this population. 13.6% of the homebound were in the 95th percentile or above of Medicare spending in 2015. In models adjusting for demographic, clinical, and geographic characteristics, homebound status was associated with a decreased likelihood of having an annual primary care or specialist visit and $2226 additional total annual Medicare spending.
Conclusions: Homebound older adults use more hospital-based care and less outpatient care than the non-homebound, contributing to higher levels of overall Medicare spending.
Keywords: homebound; medicare; spending; utilization.
© 2022. The Author(s), under exclusive licence to Society of General Internal Medicine.
Conflict of interest statement
The authors declare that they do not have a conflict of interest.
Figures


Similar articles
-
Continuity of Care and Health Care Utilization in Older Adults With Dementia in Fee-for-Service Medicare.JAMA Intern Med. 2016 Sep 1;176(9):1371-8. doi: 10.1001/jamainternmed.2016.3553. JAMA Intern Med. 2016. PMID: 27454945 Free PMC article.
-
Association Between Care Management and Outcomes Among Patients With Complex Needs in Medicare Accountable Care Organizations.JAMA Netw Open. 2019 Jul 3;2(7):e196939. doi: 10.1001/jamanetworkopen.2019.6939. JAMA Netw Open. 2019. PMID: 31298714 Free PMC article.
-
Association of Pioneer Accountable Care Organizations vs traditional Medicare fee for service with spending, utilization, and patient experience.JAMA. 2015 Jun 2;313(21):2152-61. doi: 10.1001/jama.2015.4930. JAMA. 2015. PMID: 25938875
-
Effect of new Medicare enrollment on health, healthcare utilization, and cost: A scoping review.J Am Geriatr Soc. 2021 Aug;69(8):2335-2343. doi: 10.1111/jgs.17113. Epub 2021 Mar 15. J Am Geriatr Soc. 2021. PMID: 33721340
-
Medicare Part B Drugs: Trends in Spending and Utilization, 2008-2021: Issue Brief [Internet].Washington (DC): Office of the Assistant Secretary for Planning and Evaluation (ASPE); 2023 Jun 9. Report No.: HP-2023-17. Washington (DC): Office of the Assistant Secretary for Planning and Evaluation (ASPE); 2023 Jun 9. Report No.: HP-2023-17. PMID: 39146449 Free Books & Documents. Review.
Cited by
-
Longitudinal associations of time-varying homeboundness and life satisfaction after traumatic brain injury.Rehabil Psychol. 2025 Feb;70(1):94-103. doi: 10.1037/rep0000567. Epub 2024 Jun 24. Rehabil Psychol. 2025. PMID: 38913739 Free PMC article.
-
Prevalence of cognitive impairment in home health physical therapy.J Am Geriatr Soc. 2024 Mar;72(3):802-810. doi: 10.1111/jgs.18715. Epub 2023 Dec 28. J Am Geriatr Soc. 2024. PMID: 38152855 Free PMC article.
-
Associations of Homebound State in Older Adults With Neighborhood Social Cohesion.J Appl Gerontol. 2025 Jul 11:7334648251360520. doi: 10.1177/07334648251360520. Online ahead of print. J Appl Gerontol. 2025. PMID: 40645224 Free PMC article.
-
The quality of home-based primary care delivered by nurse practitioners: A national Medicare claims analysis.J Am Geriatr Soc. 2024 Dec;72(12):3763-3772. doi: 10.1111/jgs.19182. Epub 2024 Sep 18. J Am Geriatr Soc. 2024. PMID: 39291622 Free PMC article.
References
-
- Harris-Kojetin L, Sengupta M, Lendon J, Rome V, Valverde R, Caffrey C. Long-Term Care Providers and Services Users in the UNited States, 2015-2016. National Center for Health STatistics; 2019. Report No.: 3(43). - PubMed
-
- Ankuda CK, Leff B, Ritchie CS, Siu AL, Ornstein KA. Association of the COVID-19 pandemic with the prevalence of homebound older adults in the United States, 2011-2020. JAMA Intern Med. 2021;181(12):1658–1660. https://jamanetwork.com/journals/jamainternalmedicine/fullarticle/2783103 - PMC - PubMed
Publication types
MeSH terms
Grants and funding
LinkOut - more resources
Full Text Sources
Medical

