. 2022 Aug 9;22(1):651.
doi: 10.1186/s12877-022-03326-7.

Sex-specific transcriptome differences in a middle-aged frailty cohort

Affiliations

Sex-specific transcriptome differences in a middle-aged frailty cohort

Natasha L Pacheco et al. BMC Geriatr. .

Abstract

Background: Frailty is a clinical syndrome described as reduced physiological reserve and increased vulnerability. Typically examined in older adults, recent work shows frailty occurs in middle-aged individuals and is associated with increased mortality. Previous investigation of global transcriptome changes in a middle-aged cohort from the Healthy Aging in Neighborhoods of Diversity across the Life Span (HANDLS) study demonstrated inflammatory genes and pathways were significantly altered by frailty status and race. Transcriptome differences in frailty by sex remain unclear. We sought to discover novel genes and pathways associated with sex and frailty in a diverse middle-aged cohort using RNA-Sequencing.

Methods: Differential gene expression and pathway analyses were performed in peripheral blood mononuclear cells for 1) frail females (FRAF, n = 4) vs non-frail females (NORF, n = 4), 2) frail males (FRAM, n = 4) vs non-frail males (NORM, n = 4), 3) FRAM vs FRAF, and 4) NORM vs NORF. We evaluated exclusive significant genes and pathways, as well as overlaps, between the comparison groups.

Results: Over 80% of the significant genes exclusive to FRAF vs NORF, FRAM vs NORM, and FRAM vs FRAF, respectively, were novel and associated with various biological functions. Pathways exclusive to FRAF vs NORF were associated with reduced inflammation, while FRAM vs NORM exclusive pathways were related to aberrant musculoskeletal physiology. Pathways exclusive to FRAM vs FRAF were associated with reduced cell cycle regulation and activated catabolism and Coronavirus pathogenesis.

Conclusions: Our results indicate sex-specific transcriptional changes occur in middle-aged frailty, enhancing knowledge on frailty progression and potential therapeutic targets to prevent frailty.

Keywords: Aging; Gene expression; Inflammation; Midlife; Musculoskeletal.


Conflict of interest statement

The authors declare that they have no competing interests.

Figures

Fig. 1
Fig. 1
Gene expression differences associated with sex and frailty status. Detected genes from the A. FRAM vs NORM comparison, B. FRAF vs NORF comparison, C. FRAM vs FRAF, and D. NORM vs NORF comparison are plotted by Log2 fold change (x-axis) and –Log10 transformed p-adjusted values (padj, y-axis). Data points in red indicate genes significant by a padj < 0.05, and purple indicates padj < 0.01. For each comparison, the top 3 most significantly increased and decreased genes are denoted. For a complete list of all significant genes, refer to Additional files 2,3, 4, and 5
Fig. 2
Fig. 2
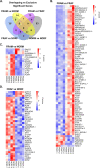
Significant differentially expressed genes exclusively identified per frailty group comparison. A. Venn diagram comparing lists of significant genes (Log2 fold change ≥ 0.58 or ≤ -0.58) identified from FRAM vs NORM (yellow), FRAF vs NORF (blue), FRAM vs FRAF (purple), and NORM vs NORF (gray) as a reference. The significant, differentially expressed genes exclusively identified in the B. FRAM vs FRAF, C. FRAM vs NORM, and D. FRAF vs NORF comparisons are presented as heatmaps. For each respective heatmap, columns represent individual samples and rows represent gene Z-scores. Only significant genes with a Log2 fold change ≥ 0.58 or ≤ -0.58 are plotted. Refer to Additional files 2, 3, 4, and 5 for complete list of significant genes
Fig. 3
Fig. 3
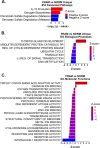
Biological pathways exclusive to FRAM vs NORM. A. Significant IPA canonical pathways (y-axis) uniquely identified in the FRAM vs NORM comparison group are plotted by –Log10 transformed p-values (x-axis). Red bars indicate a positive Z-score, blue bars indicate a negative Z-score. B. Significant GO biological processes (y-axis) exclusively identified in the FRAM vs NORM comparison group, plotted by Z-score (x-axis). C. All significant GO molecular functions (y-axis) identified in the FRAM vs NORM group, plotted by Z-score (x-axis). Refer to Additional files 6 and 10, 11, 12 for complete lists of IPA canonical pathways and GO terms. Abbreviations: “(-)” = negative; “REG.” = regulation
Fig. 4
Fig. 4
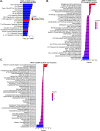
Biological pathways exclusive to FRAF vs NORF. A. Significant IPA canonical pathways (y-axis) uniquely identified in the FRAF vs NORF comparison group are plotted by –Log10 transformed p-values (x-axis). B. Significant GO biological processes (y-axis) exclusively identified in the FRAF vs NORF comparison group, plotted by Z-score (x-axis). C. All significant GO molecular functions (y-axis) identified in the FRAF vs NORF group, plotted by Z-score (x-axis). Refer to Additional files 7 and 13, 14, 15 for complete lists of IPA canonical pathways and GO terms. Abbreviations: “Reg. of the EMT by GFs Pathway” = Regulation of the Epithelial Mesenchymal Transition by Growth Factors Pathway; “DM” = Diabetes Mellitus; “ALS” = Amyotrophic lateral sclerosis; “(-)” = negative; “( +)” = positive; “REG.” = regulation; “FGFR” = fibroblast growth factor receptor; “GPCR” = G-protein coupled receptor
Fig. 5
Fig. 5
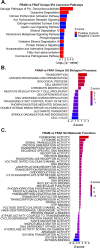
Biological pathways exclusive to FRAM vs FRAF. A. Significant IPA canonical pathways (y-axis) uniquely identified in the FRAM vs FRAF comparison group are plotted by –Log10 transformed p-values (x-axis). B. Significant GO biological processes (y-axis) exclusively identified in the FRAM vs FRAF comparison group, plotted by Z-score (x-axis). C. All significant GO molecular functions (y-axis) identified in the FRAM vs FRAF group, plotted by Z-score (x-axis). Refer to Additional files 8 and 16, 17, 18 for complete lists of IPA canonical pathways and GO terms. Abbreviations: “Pyr.” = pyrimidine

Similar articles

Cited by

References

    1. Fried LP, Tangen CM, Walston J, Newman AB, Hirsch C, Gottdiener J, Seeman T, Tracy R, Kop WJ, Burke G, et al. Frailty in older adults: evidence for a phenotype. J Gerontol A Biol Sci Med Sci. 2001;56(3):M146–156. - PubMed
    1. Bandeen-Roche K, Seplaki CL, Huang J, Buta B, Kalyani RR, Varadhan R, Xue QL, Walston JD, Kasper JD. Frailty in Older Adults: A Nationally Representative Profile in the United States. J Gerontol A Biol Sci Med Sci. 2015;70(11):1427–1434. - PMC - PubMed
    1. Santos-Eggimann B, Cuenoud P, Spagnoli J, Junod J. Prevalence of frailty in middle-aged and older community-dwelling Europeans living in 10 countries. J Gerontol A Biol Sci Med Sci. 2009;64(6):675–681. - PMC - PubMed
    1. Hanlon P, Nicholl BI, Jani BD, Lee D, McQueenie R, Mair FS. Frailty and pre-frailty in middle-aged and older adults and its association with multimorbidity and mortality: a prospective analysis of 493 737 UK Biobank participants. Lancet Public Health. 2018;3(7):e323–e332. - PMC - PubMed
    1. Brunner EJ, Shipley MJ, Ahmadi-Abhari S, Valencia Hernandez C, Abell JG, Singh-Manoux A, Kawachi I, Kivimaki M. Midlife contributors to socioeconomic differences in frailty during later life: a prospective cohort study. Lancet Public Health. 2018;3(7):e313–e322. - PMC - PubMed

Publication types