

Comparative transcriptome analysis linked to key volatiles reveals molecular mechanisms of aroma compound biosynthesis in Prunus mume
- PMID: 35945501
- PMCID: PMC9361687
- DOI: 10.1186/s12870-022-03779-3
Comparative transcriptome analysis linked to key volatiles reveals molecular mechanisms of aroma compound biosynthesis in Prunus mume
Abstract
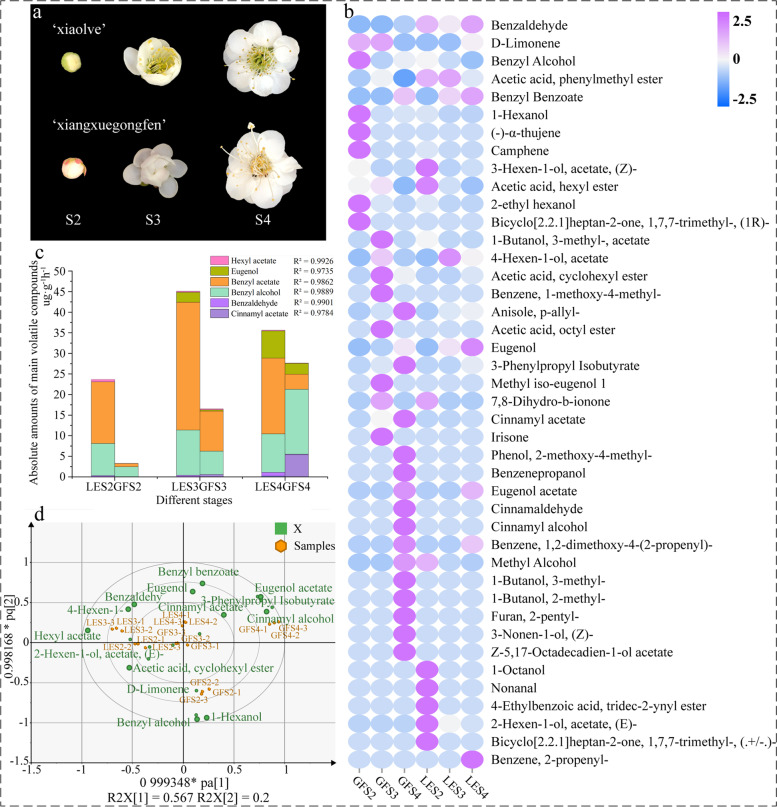
Background: Mei (Prunus mume) is the only woody plant in the genus Prunus with a floral fragrance, but the underlying mechanisms of aroma compound biosynthesis are unclear despite being a matter of considerable interest.
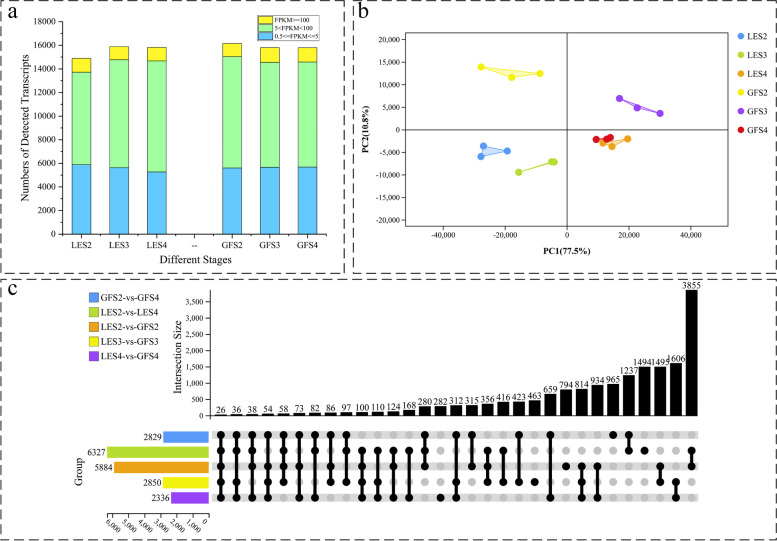
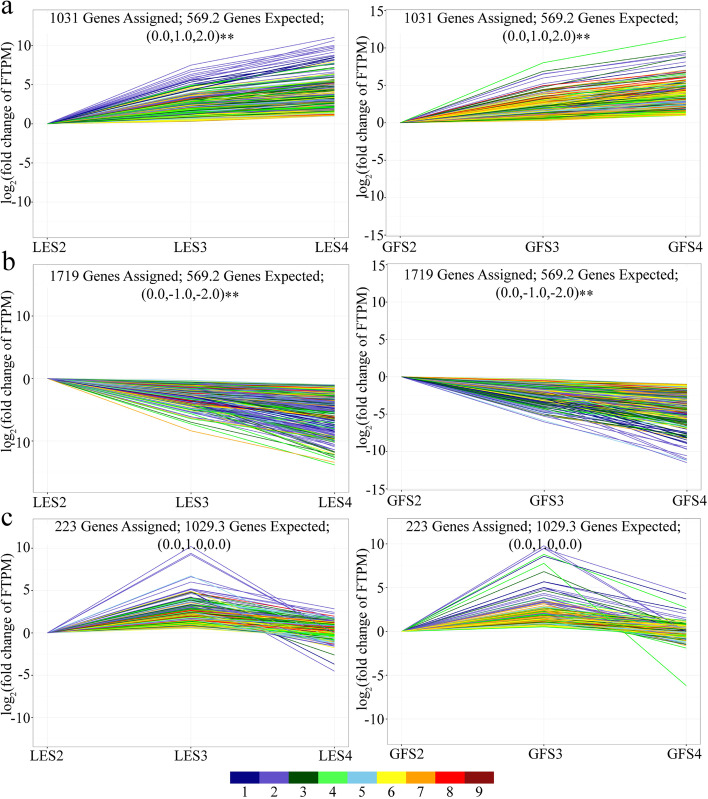
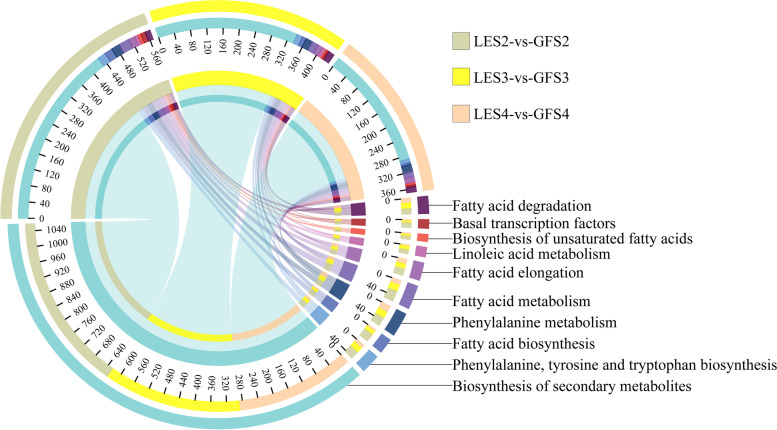
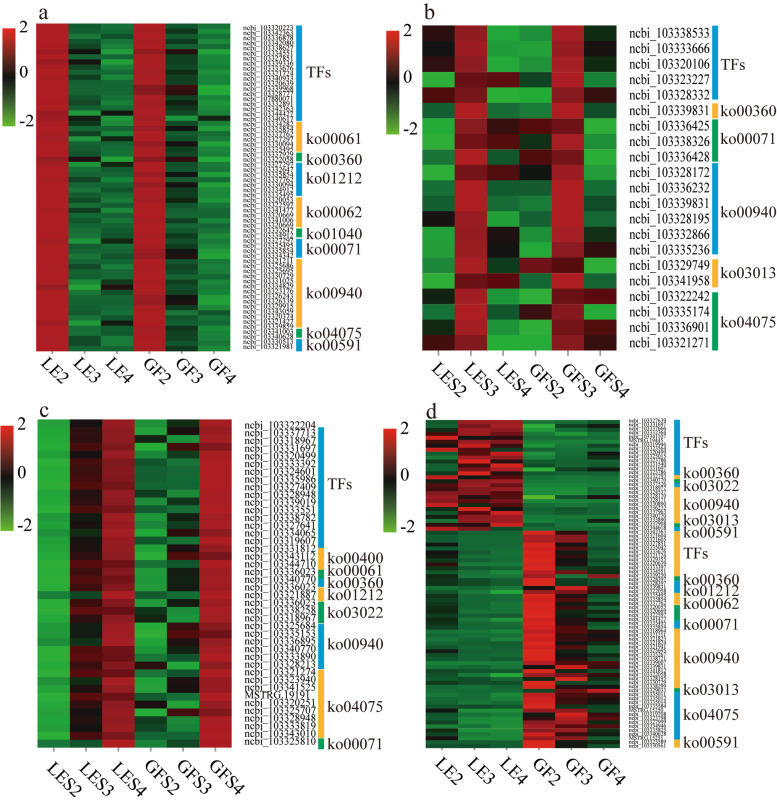
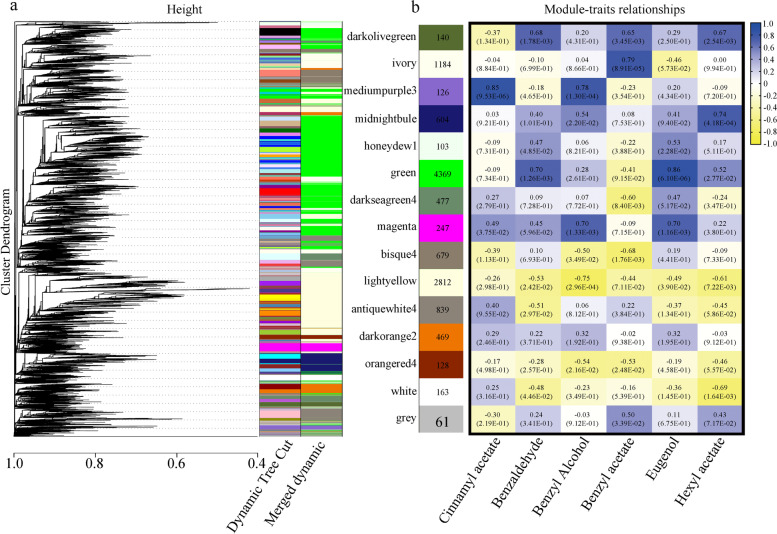
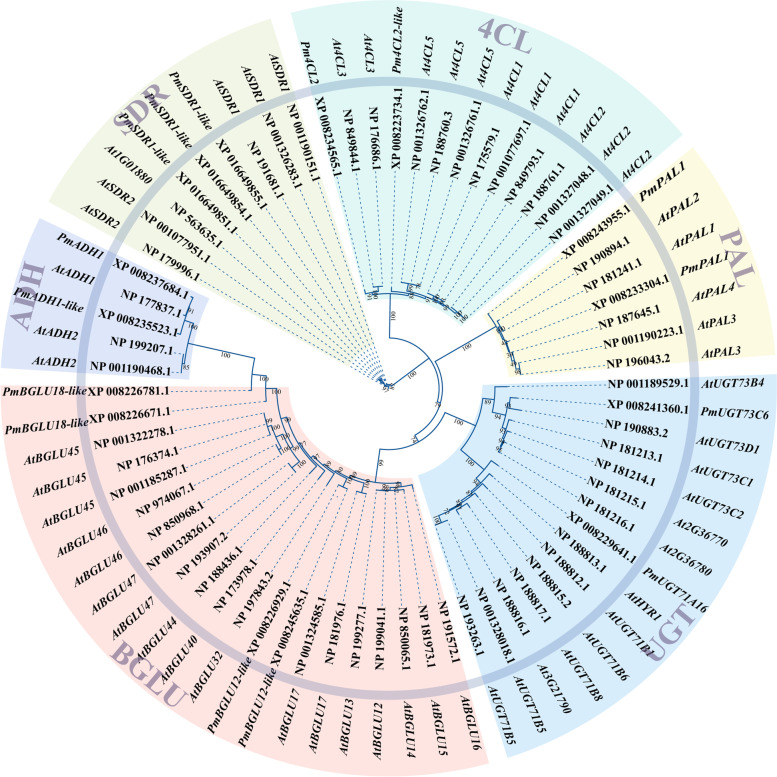
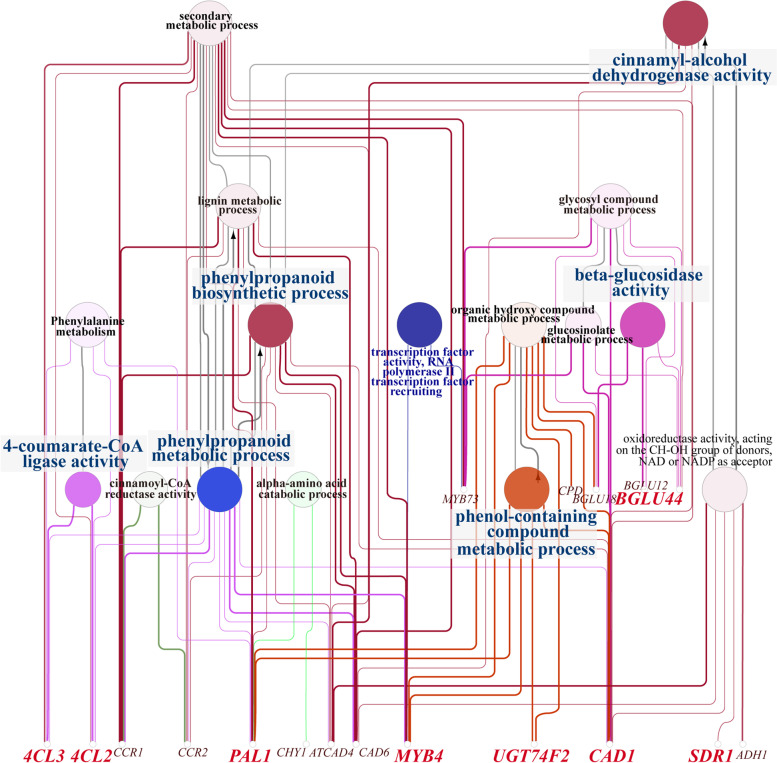
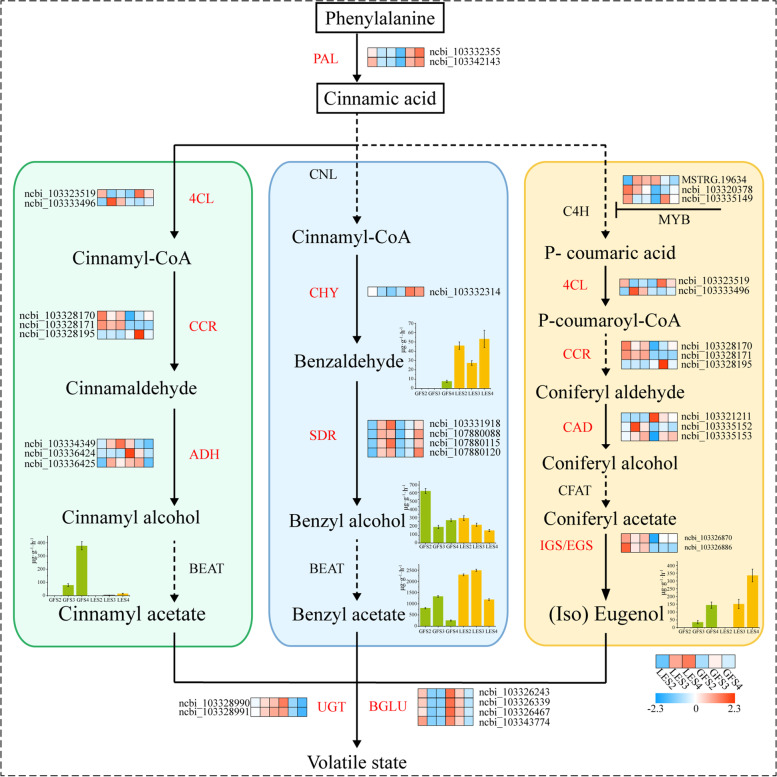
Results: The volatile contents of the petals of two cultivars with significantly different aromas, Prunus mume 'Xiao Lve' and Prunus mume 'Xiangxue Gongfen', were characterised by GC-MS at different flowering periods, and a total of 44 volatile compounds were detected. Among these, the main substances forming the typical aroma of P. mume were identified as eugenol, cinnamyl acetate, hexyl acetate and benzyl acetate, with variations in their relative concentrations leading to sensory differences in the aroma of the two cultivars. We compiled a transcriptome database at key stages of floral fragrance formation in the two cultivars and used it in combination with differential analysis of floral volatiles to construct a regulatory network for the biosynthesis of key aroma compounds. The results indicated that PmPAL enzymes and PmMYB4 transcription factors play important roles in regulating the accumulation of key biosynthetic precursors to these compounds. Cytochrome P450s and short-chain dehydrogenases/reductases might also influence the biosynthesis of benzyl acetate by regulating production of key precursors such as benzaldehyde and benzyl alcohol. Furthermore, by analogy to genes with verified functions in Arabidopsis, we predicted that three PmCAD genes, two 4CL genes, three CCR genes and two IGS genes all make important contributions to the synthesis of cinnamyl acetate and eugenol in P. mume. This analysis also suggested that the downstream genes PmBGLU18-like, PmUGT71A16 and PmUGT73C6 participate in regulation of the matrix-bound and volatile states of P. mume aroma compounds.
Conclusions: These findings present potential new anchor points for further exploration of floral aroma compound biosynthesis pathways in P. mume, and provide new insights into aroma induction and regulation mechanisms in woody plants.
Keywords: Floral scent; Gene expression and regulation; Prunus mume; Transcription factors; Transcriptome.
© 2022. The Author(s).
Conflict of interest statement
All authors have read and approved this version of the article, and due care has been taken to ensure the integrity of the work. No conflict of interest exists in the submission of this manuscript.
Figures
Similar articles
-
A Comparative Analysis of Floral Scent Compounds in Intraspecific Cultivars of Prunus mume with Different Corolla Colours.Molecules. 2019 Dec 30;25(1):145. doi: 10.3390/molecules25010145. Molecules. 2019. PMID: 31905838 Free PMC article.
-
Headspace Volatiles and Endogenous Extracts of Prunus mume Cultivars with Different Aroma Types.Molecules. 2021 Nov 30;26(23):7256. doi: 10.3390/molecules26237256. Molecules. 2021. PMID: 34885838 Free PMC article.
-
Volatile compounds evaluation and characteristic aroma compounds screening in representative germplasm of mei (Prunus mume) based on metabolomics and sensomics.Food Chem. 2025 Oct 15;489:144994. doi: 10.1016/j.foodchem.2025.144994. Epub 2025 Jun 1. Food Chem. 2025. PMID: 40482482
-
Anticancer properties of Prunus mume extracts (Chinese plum, Japanese apricot).J Ethnopharmacol. 2020 Jan 10;246:112215. doi: 10.1016/j.jep.2019.112215. Epub 2019 Sep 3. J Ethnopharmacol. 2020. PMID: 31491438 Review.
-
Amino acids metabolism as a source for aroma volatiles biosynthesis.Curr Opin Plant Biol. 2022 Jun;67:102221. doi: 10.1016/j.pbi.2022.102221. Epub 2022 May 6. Curr Opin Plant Biol. 2022. PMID: 35533493 Review.
Cited by
-
Molecular insights into floral scent biosynthesis in Rosa laevigata through transcriptomic and metabolomic analyses.Front Plant Sci. 2025 Jun 23;16:1599758. doi: 10.3389/fpls.2025.1599758. eCollection 2025. Front Plant Sci. 2025. PMID: 40625877 Free PMC article.
-
Investigation of genes involved in scent and color production in Rosa damascena Mill.Sci Rep. 2024 Sep 4;14(1):20576. doi: 10.1038/s41598-024-71518-9. Sci Rep. 2024. PMID: 39242697 Free PMC article.
-
Deciphering aroma formation during flowering in nectar tree (Tilia amurensis): insights from integrated metabolome and transcriptome analysis.For Res (Fayettev). 2023 Oct 8;3:24. doi: 10.48130/FR-2023-0024. eCollection 2023. For Res (Fayettev). 2023. PMID: 39526254 Free PMC article.
-
PfERF106, a novel key transcription factor regulating the biosynthesis of floral terpenoids in Primula forbesii Franch.BMC Plant Biol. 2024 Sep 10;24(1):851. doi: 10.1186/s12870-024-05567-7. BMC Plant Biol. 2024. PMID: 39256664 Free PMC article.
-
Integrative analysis of non-targeted metabolome and transcriptome reveals the mechanism of volatile formation in pepper fruit.Front Genet. 2023 Nov 10;14:1290492. doi: 10.3389/fgene.2023.1290492. eCollection 2023. Front Genet. 2023. PMID: 38028623 Free PMC article.
References
-
- Chandler S, Tanaka Y. Genetic modification in floriculture. Crit Rev Plant Sci. 2007;26(4):169–197. doi: 10.1080/07352680701429381. - DOI
-
- Fu X, Zhou Y, Zeng L, et al. Analytical method for metabolites involved in biosynthesis of plant volatile compounds. RSC Adv. 2017;7(31):19363–19372. doi: 10.1039/C7RA00766C. - DOI
MeSH terms
Substances
LinkOut - more resources
Full Text Sources
Miscellaneous
