. 2022 Aug 9;23(1):170.
doi: 10.1186/s13059-022-02732-9.

Balanced mitochondrial and cytosolic translatomes underlie the biogenesis of human respiratory complexes

Affiliations

Balanced mitochondrial and cytosolic translatomes underlie the biogenesis of human respiratory complexes

Iliana Soto et al. Genome Biol. .

Abstract

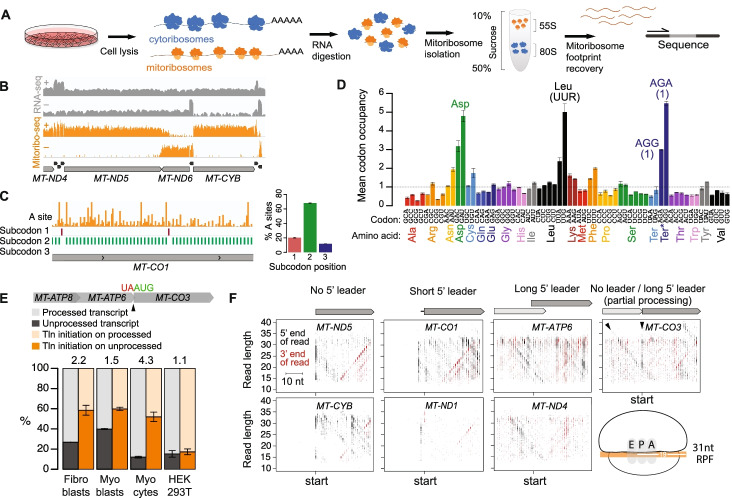
Background: Oxidative phosphorylation (OXPHOS) complexes consist of nuclear and mitochondrial DNA-encoded subunits. Their biogenesis requires cross-compartment gene regulation to mitigate the accumulation of disproportionate subunits. To determine how human cells coordinate mitochondrial and nuclear gene expression processes, we tailored ribosome profiling for the unique features of the human mitoribosome.

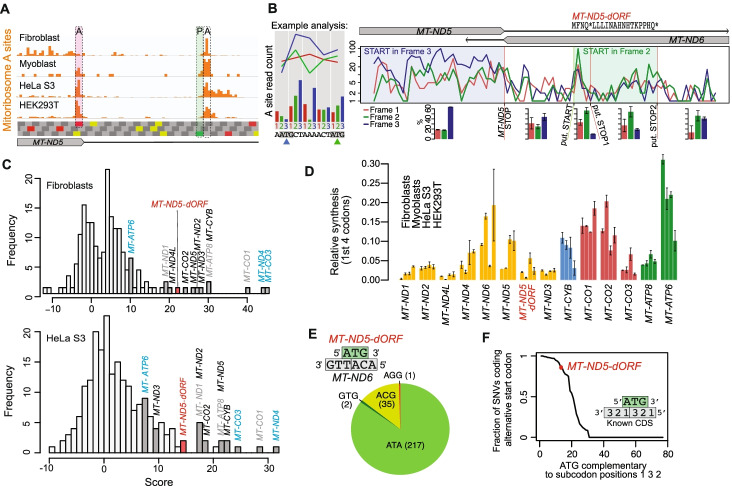
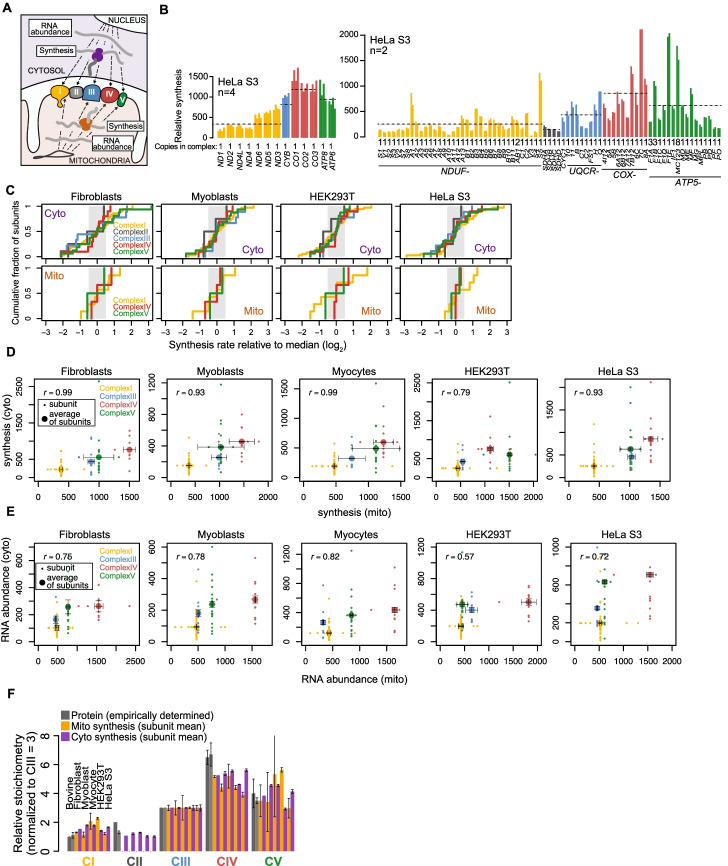
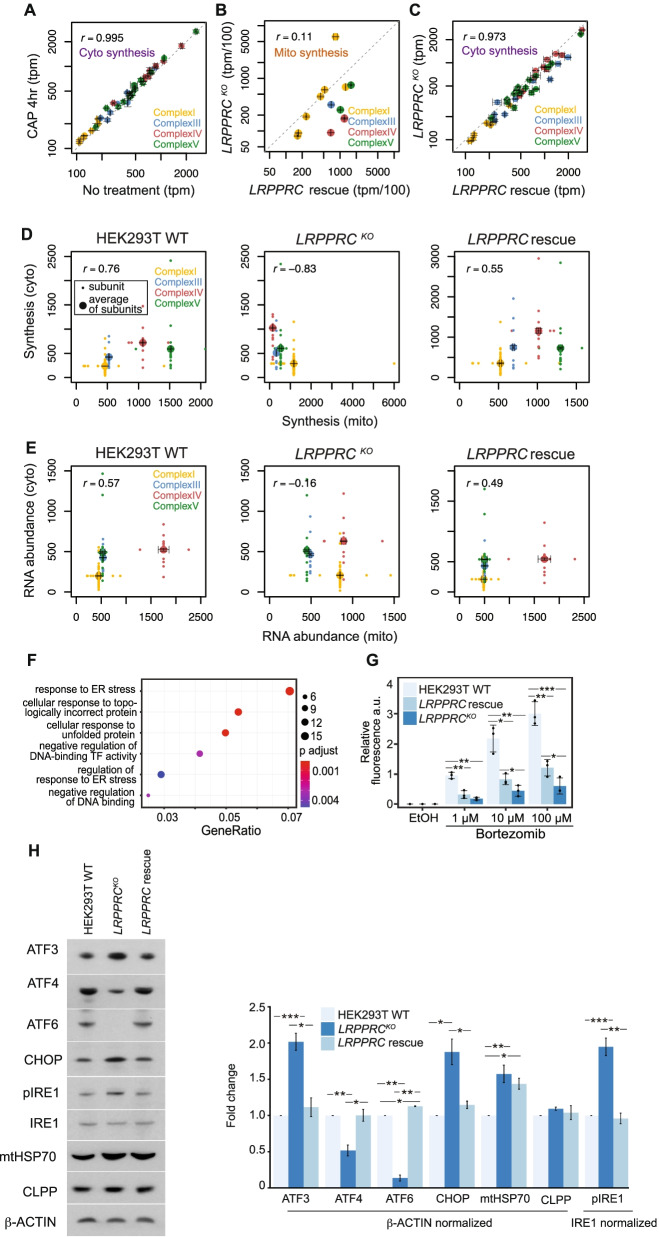
Results: We resolve features of mitochondrial translation initiation and identify a small ORF in the 3' UTR of MT-ND5. Analysis of ribosome footprints in five cell types reveals that average mitochondrial synthesis levels correspond precisely to cytosolic levels across OXPHOS complexes, and these average rates reflect the relative abundances of the complexes. Balanced mitochondrial and cytosolic synthesis does not rely on rapid feedback between the two translation systems, and imbalance caused by mitochondrial translation deficiency is associated with the induction of proteotoxicity pathways.

Conclusions: Based on our findings, we propose that human OXPHOS complexes are synthesized proportionally to each other, with mitonuclear balance relying on the regulation of OXPHOS subunit translation across cellular compartments, which may represent a proteostasis vulnerability.


Conflict of interest statement

The authors declare that they have no competing interests.

Figures

Fig. 1
Fig. 1
Human mitoribosome profiling reveals features of mitochondrial translation. A Schematic of the human mitoribosome profiling approach. B Sequencing data over a representative portion of the mitochondrial genome, with mRNAs (gray, labeled) and tRNAs (black) annotated below. Panels show RNA-seq read coverage (gray) and mitoribosome profiling (Mitoribo-seq) read A-site density (orange) on heavy (+) and light (−) strands. Y axis is in log scale. C Left panel: A-site density (orange) across a portion of MT-CO1 with subcodon position of maximum signal plotted below. Right panel: Percentage of reads with their A sites on each subcodon position across all mt-mRNAs. D Mitoribosome occupancy across codons. Asp, Leu (UUR), and termination codons are labeled. AGA and AGG Ter* putative termination codons are each present only once (indicated in parentheses), at the ends of MT-CO1 and MT-ND6, respectively. R: purine (A or G). Codons with occupancy of >3× expected are labeled. Error bars show range across replicates. E Percentage of processed and unprocessed MT-ATP8/6-CO3 transcript at site indicated by arrowhead and of translation (Tln) initiation on processed and unprocessed transcript. Numbers at top of bars indicate the fold-preference for translation initiation on unprocessed vs processed transcripts. Error bars show range across replicates. F Scatterplots to visualize mitoribosome position during initiation. Start-codon-aligned RPF 5′ and 3′ ends are plotted according to their genome position and read length. Arrowheads highlight MT-CO3 initiation on both unprocessed MT-ATP8/6-CO3 and processed MT-CO3 mRNA. Cartoon shows positioning of mitoribosome E, P, and A sites on a full-length (31 nt) RPF. Short 5′ leaders consist of one to three nts
Fig. 2
Fig. 2
Evidence for the translation of a novel mitochondrial noncanonical open reading frame. A Translation initiation occurs on an internal AUG in the MT-ND5 3′ UTR across cell lines. A-site density on the MT-ND5 stop codon (shaded in red) and P-site density (shaded in green, A-site density one codon downstream) of initiating ribosomes on the internal AUG are highlighted. Codons in the three frames are shown below with stop (UAA, UAG), start (AUG), and mitochondrial alternative start (AUU, AUA) highlighted (red, green, yellow, respectively). B Stacked frame plot highlighting number of A-site transformed reads in each subcodon position on heavy strand. The example analysis (left panel) shows how raw A site read counts are transformed to line plots, and how the line plots highlight which frame is being read. The color of the arrowheads indicates which frame each ATG is in. The blue ATG starts an open reading frame. Mitoribosome profiling data are from two fibroblast replicates, summed. Amino acid sequence of putative MT-ND5-dORF peptide is shown with putative (put.) start and stop codons highlighted with green and red lines, respectively. Bar plots below show the average percentage of reads in each subcodon position for regions indicated, with error bars showing range between the replicates summed above. C Distribution of initiation scores after applying ad hoc scoring method to fibroblasts and HeLa S3 cells. Gene names in black: known genes with no leader; gray: known genes with 1 to 3 nt leader; cyan: known genes with long 5′ UTR. D Estimated relative synthesis of MT-ND5-dORF compared to other mtDNA-encoded genes. A-site transformed reads were summed across the first four codons with signal for each gene and normalized by the total number of such reads. For genes with 5′ UTRs (MT-ATP6, MT-ND4, MT-CO3, MT-ND5-dORF), this includes codons 2–5, where codon 5 is a stop codon for MT-ND5-dORF. For genes with a very short or no leader (all others), this includes codons 6–9. For MT-ATP6, the signal is confounded by reads from MT-ATP8, which overlaps the first 15 codons. Samples are plotted in the order listed and error bars show range across replicates. E Variants at MT-ND5-dORF ATG (in green), which is antisense to MT-ND6 (in grey) in the orientation indicated by the schematic. ATA: canonical alternative mitochondrial start codon. GTG: variant start codon shown to efficiently initiate translation. ACG: capable of initiation in reconstituted mammalian mitochondria translation (Lee et al, 2021). AGG: ambiguous (stop or frame-shift inducing). F Genome-wide analysis of SNVs at ATGs. Only equivalently oriented ATGs opposite to codons in known ORFs were included to equalize the constraints (see “Methods”). ATGs were required to have at least 2 SNVs to be included
Fig. 3
Fig. 3
Balanced translatomes exist in five human cell lines. A Flow of genetic information to encode dual-origin OXPHOS complexes in human cells. B Relative synthesis values of mtDNA- (left graph) and nDNA-encoded (right graph) OXPHOS subunits. Cytoribosome profiling data are from Wu et al. [42]. Each replicate is shown as an individual bar, values given in Additional file 3: Table S2. Dotted lines show averages across all subunits and samples. Numbers below bars show stoichiometry of each subunit. Synthesis units are tpm/100 for mitochondrial synthesis and tpm for cytosolic synthesis (note that mitochondrial and cytosolic synthesis absolute values cannot be compared across compartments). C Cumulative distribution of relative synthesis rates for nDNA-encoded subunits (top, Additional file 3: Table S2 and “Methods” for details) and mtDNA-encoded subunits (bottom) of the dual-origin OXPHOS complexes. Log2-fold differences in synthesis levels compared to the median value for each complex are shown. Shaded region indicates 2-fold spread. D Synthesis of mtDNA-encoded subunits (tpm/100) compared to synthesis of nDNA-encoded core subunits (tpm) for each complex. Small dots show individual subunits, large dots show average synthesis of subunits within each corresponding complex, following the color code displayed. Fibroblast and HeLa S3 cytoribosome profiling data are from Tirosh et al. [43] and Wu et al. [42], respectively. Myocytes are post-differentiation-induction day 2 myoblasts. Individual subunit synthesis for each replicate is shown in Fig. 3B (HeLa S3), and Additional file 1: Figure S3A. Error bars show range in averages across replicates. E RNA abundance of mtDNA-encoded subunits (tpm/100) compared to RNA abundance of nDNA-encoded subunits (tpm) for each complex. Subunits included are identical to those in D. Small dots show individual subunit RNA abundance, large dots show average RNA abundance of subunits within each corresponding complex, following the color code displayed. Error bars show range in averages across replicates. All panels show Pearson correlation, r. F Stoichiometry of average synthesis values for each complex relative to Complex III, which is set to 3, following published convention. Dark gray and light gray bars show empirically determined complex stoichiometry as determined in [1, 2], respectively
Fig. 4
Fig. 4
Lack of feedback between translatomes results in their imbalance and leads to the activation of proteostasis genes. A Comparison of relative synthesis levels for cytosolic-translated OXPHOS subunits with and without 4 h of chloramphenicol (CAP) treatment (100 μg/mL) to inhibit mitochondrial translation. B Relative synthesis for mitochondrial-encoded OXPHOS subunits in LRPPRCKO cells compared to a reconstituted cell line (LRPPRC rescue), expressing LRPPRC in the LRPPRCKO background. C Relative synthesis comparison as in (B) but for nuclear-encoded OXPHOS subunits. D Average synthesis of mtDNA-encoded subunits (tpm/100) compared to average synthesis of nDNA-encoded core subunits (tpm) for each complex in wild-type HEK293T cells, LRPPRCKO cells, and LRPPRC rescue cells. E Average RNA abundance of mtDNA-encoded subunits (tpm/100) compared to average RNA abundance of nDNA-encoded core subunits (tpm) for each complex in LRPPRC cell lines. Error bars throughout show range in averages across replicates, and all panels show Pearson correlation, r. F GO term enrichment analysis of significantly (adjusted p-value < 0.05) differentially expressed genes that show a minimum twofold increase in the LRPPRCKO cells compared to the LRPPRC rescue cell line. Shown are the GO terms after filtering for redundancy. The size of points represents the number of genes in each GO term. p adjust = adjusted p-value. TF = transcription factor. G Cell toxicity graph after 72-h bortezomib treatment. HEK293T WT, LRPPRCKO, or LRPPRC rescue cells were treated with increasing amounts of bortezomib or the vehicle ethanol (EtOH). Cell death was measured via a fluorescence dye and living cells by indirect measurement of ATP levels via luminescence. Shown are the mean relative fluorescence arbitrary units (a.u.) normalized to the respective luminescence of 3 technical replicates, with WT ethanol treated having 2 technical replicates. The range bars represent the standard deviation. The stars represent significant p-values, determined with a Welch two-sample one-sided (less) t test, * signifies p-value < 0.05, ** signifies p-value < 0.01 and *** signifies p-value < 0.001. Two other biological replicates are shown in Additional file 1: Figure S4L. H Left panel shows the immunoblot analysis using whole cell lysates from HEK293 WT, LRPPRCKO, or LRPPRC rescue cells probed for antibodies of markers of the ER and mitochondrial UPR pathways. Bar graphs show signals normalized by β-ACTIN values and compared to WT to determine fold changes. IRE1 levels are shown as ratios of its phosphorylated form (pIRE1) compared to total (IRE1). Error bars indicate standard deviation between two replicates. T test was used to test for significant changes. * signifies p-value < 0.05, ** signifies p-value < 0.01, and *** signifies p-value < 0.001

Similar articles

Cited by

References

    1. Hatefi Y. The mitochondrial electron transport and oxidative phosphorylation system. Annu Rev Biochem. 1985;54:1015–1069. doi: 10.1146/annurev.bi.54.070185.005055. - DOI - PubMed
    1. Schägger H, Pfeiffer K. The ratio of oxidative phosphorylation complexes I–V in bovine heart mitochondria and the composition of respiratory chain supercomplexes *. J Biol Chem. 2001;276:37861–37867. doi: 10.1074/jbc.M106474200. - DOI - PubMed
    1. Rath S, Sharma R, Gupta R, Ast T, Chan C, Durham TJ, et al. MitoCarta3.0: an updated mitochondrial proteome now with sub-organelle localization and pathway annotations. Nucleic Acids Res. 2021;49:D1541–D1547. doi: 10.1093/nar/gkaa1011. - DOI - PMC - PubMed
    1. Ryan MT, Hoogenraad NJ. Mitochondrial-nuclear communications. Annu Rev Biochem. 2007;76:701–722. doi: 10.1146/annurev.biochem.76.052305.091720. - DOI - PubMed
    1. Mottis A, Herzig S, Auwerx J. Mitocellular communication: shaping health and disease. Science. 2019;366:827–832. doi: 10.1126/science.aax3768. - DOI - PubMed

Publication types