. 2023 Feb 28;38(3):599-609.
doi: 10.1093/ndt/gfac237.

Tacrolimus induces a pro-fibrotic response in donor-derived human proximal tubule cells dependent on common variants of the CYP3A5 and ABCB1 genes

Affiliations

Tacrolimus induces a pro-fibrotic response in donor-derived human proximal tubule cells dependent on common variants of the CYP3A5 and ABCB1 genes

Noël Knops et al. Nephrol Dial Transplant. .

Abstract

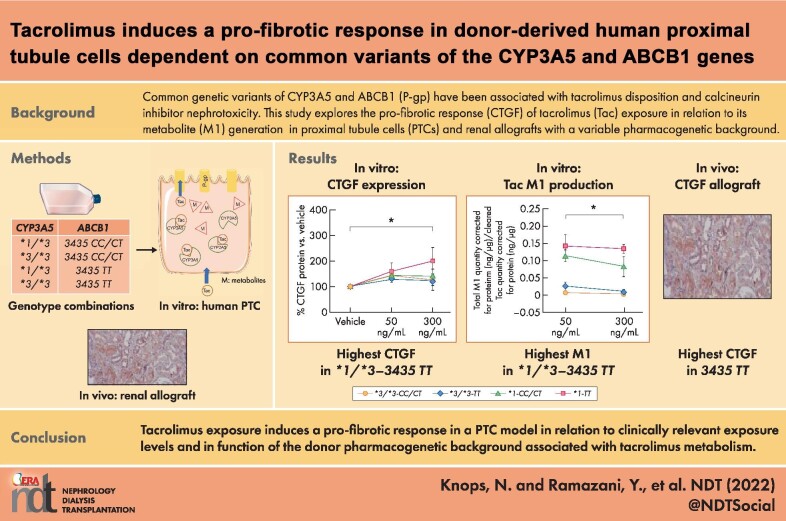
Background: Common genetic variants of the enzymes and efflux pump involved in tacrolimus disposition have been associated with calcineurin inhibitor nephrotoxicity, but their importance is unclear because of the multifactorial background of renal fibrosis. This study explores the pro-fibrotic response of tacrolimus exposure in relation to the differential capacity for tacrolimus metabolism in proximal tubule cells (PTCs) with a variable (pharmaco)genetic background.

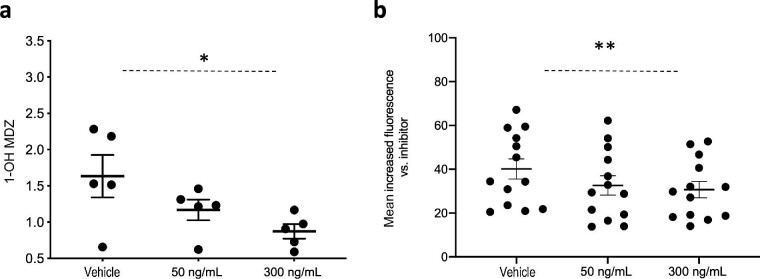
Methods: PTCs were obtained from protocol allograft biopsies with different combinations of CYP3A5 and ABCB1 variants and were incubated with tacrolimus within the concentration range found in vivo. Gene and protein expression, CYP3A5 and P-glycoprotein function, and tacrolimus metabolites were measured in PTC. Connective tissue growth factor (CTGF) expression was assessed in protocol biopsies of kidney allograft recipients.

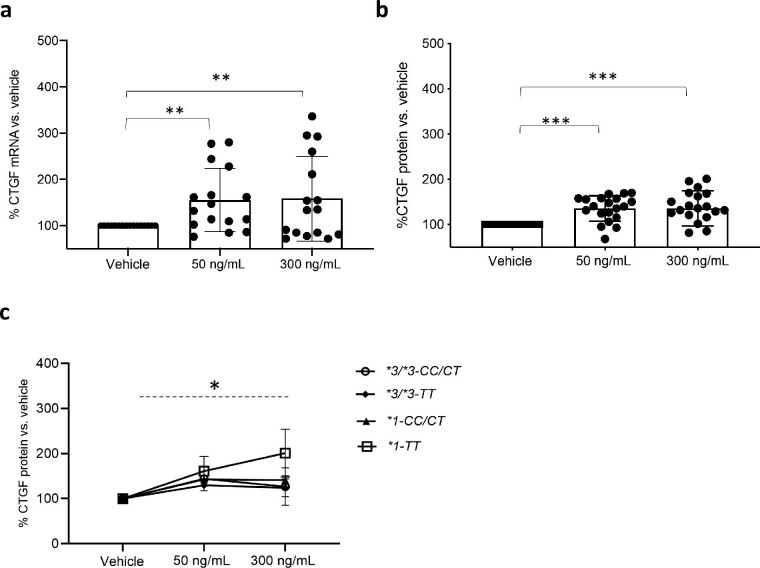
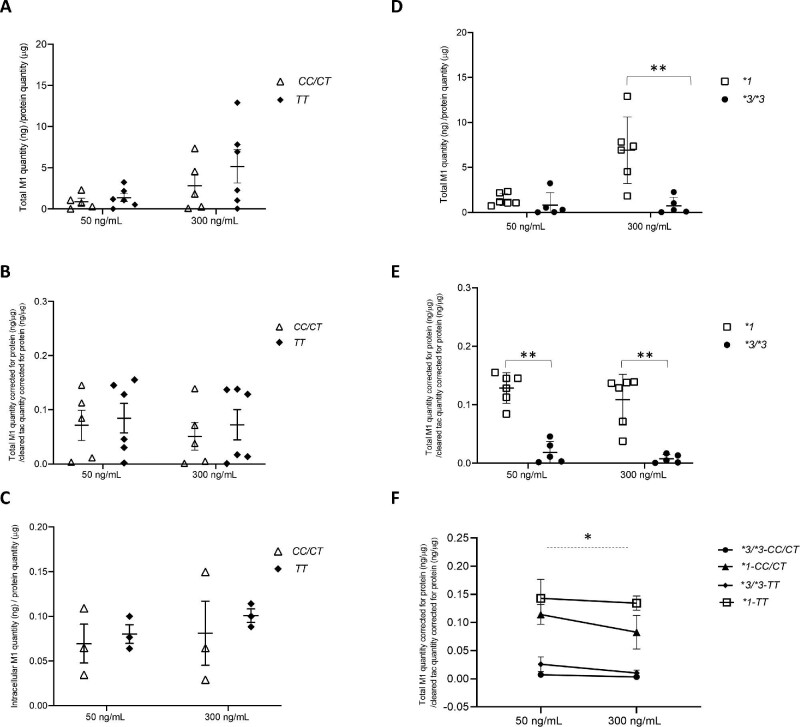
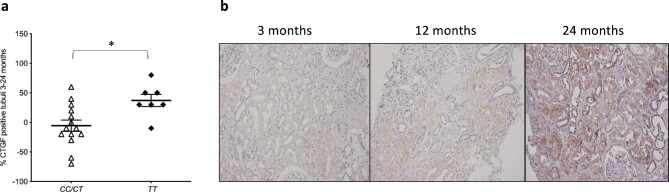
Results: PTCs produce CTGF in response to escalating tacrolimus exposure, which is approximately 2-fold higher in cells with the CYP3A5*1 and ABCB1 TT combination in vitro. Increasing tacrolimus exposure results in relative higher generation of the main tacrolimus metabolite {13-O-desmethyl tacrolimus [M1]} in cells with this same genetic background. Protocol biopsies show a larger increase in in vivo CTGF tissue expression over time in TT vs. CC/CT but was not affected by the CYP3A5 genotype.

Conclusions: Tacrolimus exposure induces a pro-fibrotic response in a PTC model in function of the donor pharmacogenetic background associated with tacrolimus metabolism. This finding provides a mechanistic insight into the nephrotoxicity associated with tacrolimus treatment and offers opportunities for a tailored immunosuppressive treatment.

Keywords: calcineurin inhibitor toxicity; connective tissue growth factor; genetic-dependent pro-fibrotic response; human donor proximal tubule cells; tacrolimus.


Figures

Graphical Abstract
Graphical Abstract
Figure 1:
Figure 1:
CTGF under tacrolimus. Results in ciPTC clones with a different genetic background after 72-hour incubation with vehicle (0.1% DMSO) or tacrolimus at 50 and 300 ng/mL. (a), Quantitative real-time PCR analysis of CTGF mRNA in all ciPTC clones. Mean mRNA vs. vehicle in 50 and 300 ng/mL tacrolimus, respectively: 155% and 158%. Repeated measures analysis of variance (ANOVA), **P < .01, n = 16. (b), Relative CTGF protein expression in all ciPTC clones. Mean protein expression vs. vehicle in 50 and 300 ng/mL, respectively: 143% and 150%. Repeated measures ANOVA, ***P < .001, n = 20. (c), Subgroup analysis of relative CTGF protein expression in ciPTC according to pharmacogenetic background. *1-TT combination vs. other genotype combinations (*1-CC/CT, *3/*3-CC/CT, and *3/*3-TT). Mean CTGF protein relative to vehicle in *1-TT vs. other genotypes: at 50 ng/mL tacrolimus, 161% vs. 133%; at 300 ng/mL tacrolimus, 201% vs. 132%. Repeated measures ANOVA, *P < .05, n = 6 and n = 14, respectively. CTGF protein expression is normalized to β-actin protein expression in all conditions. Plots depict the mean of individual values, and error bars represent the standard deviation in 1a and 1b and standard error of the mean in 1c. *1: CYP3A5 *1, *3/*3: CYP3A5*3; CC/CT: ABCB1 3435CC/CT and TT: ABCB1 3435TT.
Figure 2:
Figure 2:
Quantitative CYP3A5 and P-gp function under tacrolimus. Results in ciPTC clones after incubation with vehicle (0.1% DMSO) or tacrolimus at 50 and 300 ng/mL. (a), CYP3A5 activity expressed as 1-OH MDZ concentrations (ng/mL) after 30-minute incubation with 50 μM MDZ hydrochloride only in *1 allele carriers (nonsignificant 1-OH MDZ generation in *3/*3 allele carriers). Mean 1-OH MDZ: 1.87 and 1.19 ng/mL at tacrolimus 50 and 300 ng/mL, respectively, compared with 2.3 ng/mL vehicle. Repeated measures analysis of variance (ANOVA), *P < .05, n = 8. (b), P-gp activity expressed as relative calcein accumulation in all ciPTC clones exposed to vehicle with and without tacrolimus for 72 hours. Mean Δ fluorescence in vehicle was 39.2% compared with 34.8% and 30.7% at tacrolimus 50 and 300 ng/mL, respectively. Repeated measures ANOVA, ***P < .001, n = 10. Plots depict the mean of individual values, and error bars represent the standard error of the mean.
Figure 3:
Figure 3:
Differential tacrolimus (tac) M1 generation in ciPTC by genetic background. Results after 72-hour incubation with tacrolimus at 50 or 300 ng/mL depicted according to the genetic background. (a), Quantity of the intracellular and extracellular M1 (ng), corrected for protein amount in the lysate (μg) in CC/CT vs. TT. Mann Whitney U test: P = .6 and P = .5 at 50 and 300 ng/mL tacrolimus, respectively, n = 5 and n = 6. (b), Relative M1 metabolite generation corrected for tacrolimus clearance {ratio of ‘total amount of M1 in the intra- and extracellular compartments [ng] corrected for total protein amount in the lysate [μg]’ to ‘cleared tacrolimus [ng] corrected for total protein amount in the lysate [μg]’}. Mann-Whitney U test: P = .7 and P = .9 for 50 and 300 ng/mL tacrolimus, respectively, n = 5 and n = 6 in CC/CT vs. TT. (c), Intracellular M1 quantity (ng) corrected for total protein amount in the lysate (μg) within the *1 allele carriers {mean intracellular M1 [ng/μg protein lysate] at 50 ng/mL tacrolimus in CC/CT vs. TT, 0.06 vs. 0.08, P = .9, and at 300 ng/mL tacrolimus 0.08 vs. 0.10, P = .7 [Mann-Whitney U test, n = 3 CC/CT and TT}. (d), Quantity of the intracellular and extracellular M1 (ng), corrected for protein amount in the lysate (μg) in *1 vs. *3/*3: at 50 ng/mL tacrolimus, 1.42 vs. 0.82, and at 300 ng/mL tacrolimus, 6.90 vs. 0.73. Mann Whitney U test, **P < .01, n = 6 and n = 5, respectively. (e), Relative M1 metabolite generation, corrected for tacrolimus clearance {ratio of ‘total amount of M1 in the intra- and extracellular compartments [ng]’ to ‘cleared tacrolimus [ng],’ corrected for total protein amount in the lysate [μg]} in *1 vs. *3/*3: at 50 ng/mL, 0.12 vs. 0.01, and at 300 ng/mL, 0.10 vs. 0.007. Mann-Whitney U test: **P < .01, n = 6 and n = 5, respectively. (f), Relative M1 metabolite generation, corrected for tacrolimus clearance {ratio of ‘total amount of M1 in the intra- and extracellular compartments [ng] corrected for total protein amount in the lysate [μg]’ to ‘cleared tacrolimus [ng] corrected for total protein amount in the lysate [μg]’} in ciPTC with the specific combination of *1-TT vs. other genetic combinations: at 50 ng/mL tacrolimus, 0.14 vs. 0.05, and at 300 ng/mL tacrolimus, 0.13 vs. 0.03. Repeated measures analysis of variance: *P < .05, n = 3 and n = 8, respectively. Tacrolimus clearance: total amount of tacrolimus retrieved extra- and intracellularly after 72 hours subtracted from the actual amount of tacrolimus at the time of incubation. Plots depict the mean of individual values, and error bars represent the standard deviation in all panels except in (f), where error bars represent a 95% confidence interval. *1: CYP3A5*1, *3/*3: CYP3A5*3, CC/CT: ABCB1 3435CC/CT and TT: ABCB1 3435TT.
Figure 4:
Figure 4:
Tubular CTGF expression and representative CTGF biopsy staining. (a), Tubular CTGF increase (%) in protocol biopsies obtained at 3 and 24 months after transplantation. Mann-Whitney U test, *P < .05, n = 21. (b), Light microscopic images (×100) of CTGF staining in sequential protocol biopsies from the same kidney allograft with the TT genotype obtained at 3, 12, and 24 months after transplantation. Plots depict the mean of individual values, and error bars represent the standard error of the mean. CC/CT: ABCB1 3435CC/CT and TT: ABCB1 3435TT.

Similar articles

Cited by

References

    1. Gardiner KM, Tett SE, Staatz CE.. Multinational evaluation of mycophenolic acid, tacrolimus, cyclosporin, sirolimus, and everolimus utilization. Ann Transplant 2016;21:1–11. 10.12659/AOT.895664 - DOI - PubMed
    1. Axelrod DA, Naik AS, Schnitzler MAet al. . National variation in use of immunosuppression for kidney transplantation: a call for evidence-based regimen selection. Am J Transplant 2016;16:2453–62. 10.1111/ajt.13758 - DOI - PMC - PubMed
    1. Nankivell BJ, P'Ng CH, O'Connell PJet al. . Calcineurin inhibitor nephrotoxicity through the lens of longitudinal histology: comparison of cyclosporine and tacrolimus eras. Transplantation 2016;100:1723–31. 10.1097/TP.0000000000001243 - DOI - PubMed
    1. Nankivell BJ, Borrows RJ, Fung CLet al. . Calcineurin inhibitor nephrotoxicity: longitudinal assessment by protocol histology. Transplantation 2004;78:557–65. 10.1097/01.TP.0000128636.70499.6E - DOI - PubMed
    1. Ramazani Y, Knops N, Elmonem MAet al. . Connective tissue growth factor (CTGF) from basics to clinics. Matrix Biol 2018;68-69:44–66. 10.1016/j.matbio.2018.03.007 - DOI - PubMed

Publication types

MeSH terms

Substances