

Prediction Model Development and Validation of 12-Year Incident Edentulism of Older Adults in the United States
- PMID: 35945823
- PMCID: PMC10504805
- DOI: 10.1177/23800844221112062
Prediction Model Development and Validation of 12-Year Incident Edentulism of Older Adults in the United States
Abstract
Introduction: Edentulism affects health and quality of life.
Objectives: Identify factors that predict older adults becoming edentulous over 12 y in the US Health and Retirement Study (HRS) by developing and validating a prediction model.
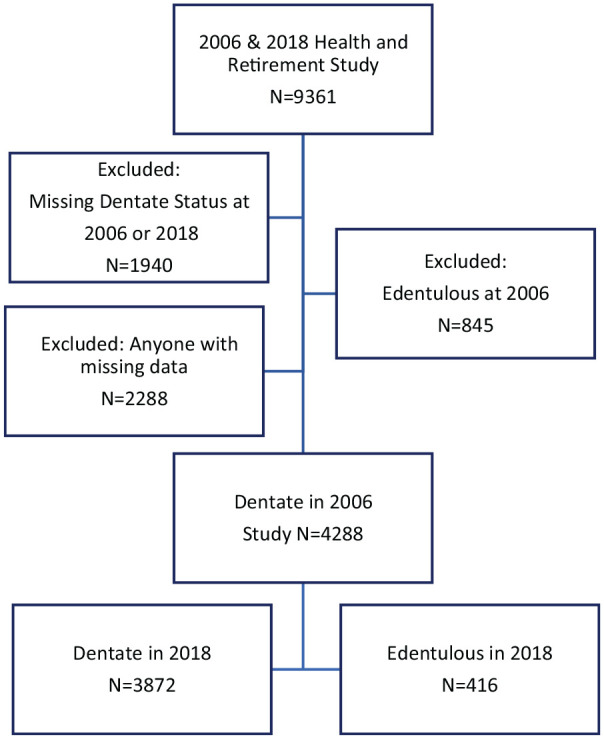
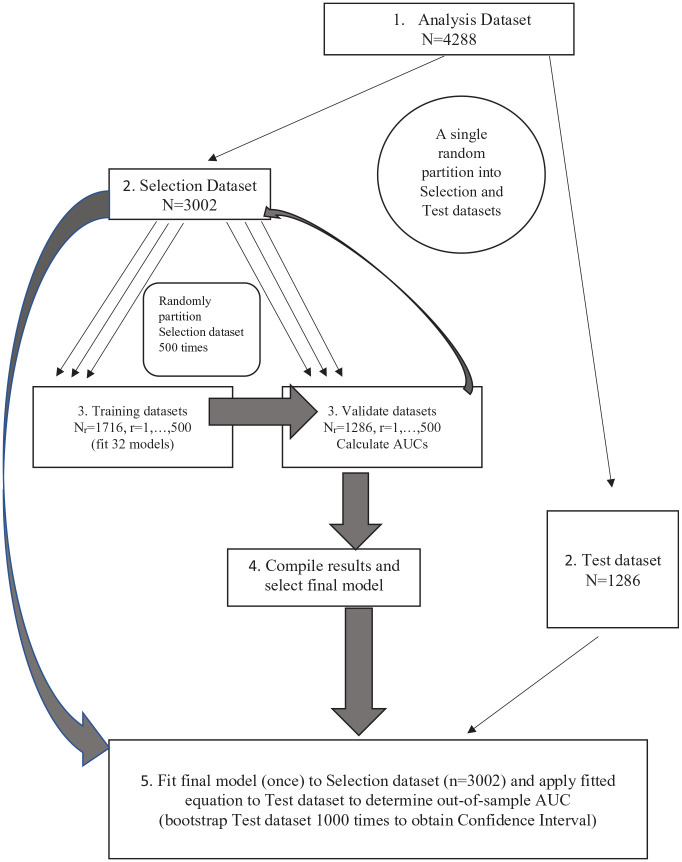
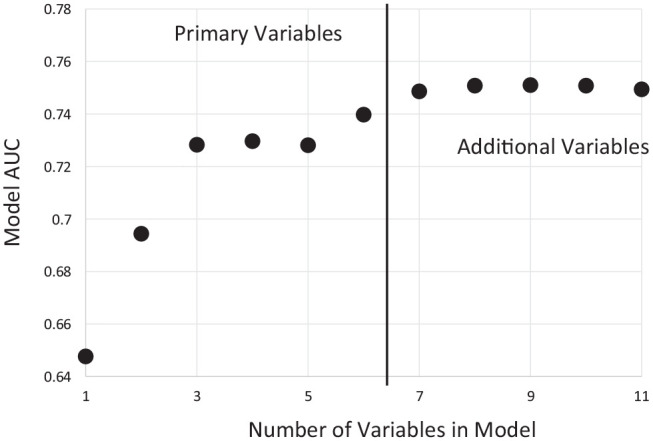
Methods: The HRS includes data on a representative sample of US adults aged >50 y. Selection criteria included participants in 2006 and 2018 who answered, "Have you lost all of your upper and lower natural permanent teeth?" Persons who answered "no" in 2006 and "yes" in 2018 experienced incident edentulism. Excluding 2006 edentulous, the data set (n = 4,288) was split into selection (70%, n = 3,002) and test data (30%, n = 1,286), and Monte Carlo cross-validation was applied to 500 random partitions of the selection data into training (n = 1,716) and validation (n = 1,286) data sets. Fitted logistic models from the training data sets were applied to the validation data sets to obtain area under the curve (AUC) for 32 candidate models. Six variables were included in all models (age, race/ethnicity, gender, education, smoking, last dental visit) while all combinations of 5 variables (income, alcohol use, self-rated health, loneliness, cognitive status) were considered for inclusion. The best parsimonious model based on highest mean AUC was fitted to the selection data set to obtain a final prediction equation. It was applied to the test data to estimate AUC and 95% confidence interval using 1,000 bootstrap samples.
Results: From 2006 to 2018, 9.7% of older adults became edentulous. The 2006 mean (SD) age was 66.7 (8.7) for newly edentulous and 66.3 (8.4) for dentate (P = 0.31). The baseline 6-variable model mean AUC was 0.740. The 7-variable model with cognition had AUC = 0.749 and test data AUC = 0.748 (95% confidence interval, 0.715-0.781), modestly improving prediction. Negligible improvement was gained from adding more variables.
Conclusion: Cognition information improved the 12-y prediction of becoming edentulous beyond the modifiable risk factors of smoking and dental care use, as well as nonmodifiable demographic factors.
Knowledge transfer statement: This prediction modeling and validation study identifies cognition as well as modifiable (dental care use, smoking) and nonmodifiable factors (race, ethnicity, gender, age, education) associated with incident complete tooth loss in the United States. This information is useful for the public, dental care providers, and health policy makers in improving approaches to preventive care, oral and general health, and quality of life for older adults.
Keywords: aged; epidemiology; geriatrics; incidence; oral health; tooth loss.
Conflict of interest statement
The authors declared no potential conflicts of interest with respect to the research, authorship, and/or publication of this article.
Figures
References
-
- Cerutti-Kopplin D, Feine J, Padilha DM, de Souza RF, Ahmadi M, Rompré P, Booij L, Emami E. 2016. Tooth loss increases the risk of diminished cognitive function: a systematic review and meta-analysis. JDR Clin Trans Res. 1(1):10–19. - PubMed
-
- Cho MJ, Kim EK. 2019. Subjective chewing ability and health-related quality of life among the elderly. Gerodontology. 36(2):99–106. - PubMed
-
- Collins GS, Reitsma JB, Altman DG, Moons KG. 2015. Transparent reporting of a multivariable prediction model for individual prognosis or diagnosis (TRIPOD): the TRIPOD statement. BMJ. 350:g7594. - PubMed
-
- Cooray U, Watt RG, Tsakos G, Heilmann A, Hariyama M, Yamamoto T, Kuruppuarachchige I, Kondo K, Osaka K, Aida J. 2021. Importance of socioeconomic factors in predicting tooth loss among older adults in Japan: evidence from a machine learning analysis. Soc Sci Med. 291:114486. - PubMed
Publication types
MeSH terms
Grants and funding
LinkOut - more resources
Full Text Sources
