. 2022 Oct;6(10):2781-2797.
doi: 10.1002/hep4.2058. Epub 2022 Aug 9.

Loss of heat shock factor 1 promotes hepatic stellate cell activation and drives liver fibrosis

Affiliations

Loss of heat shock factor 1 promotes hepatic stellate cell activation and drives liver fibrosis

Asmita Choudhury et al. Hepatol Commun. 2022 Oct.

Abstract

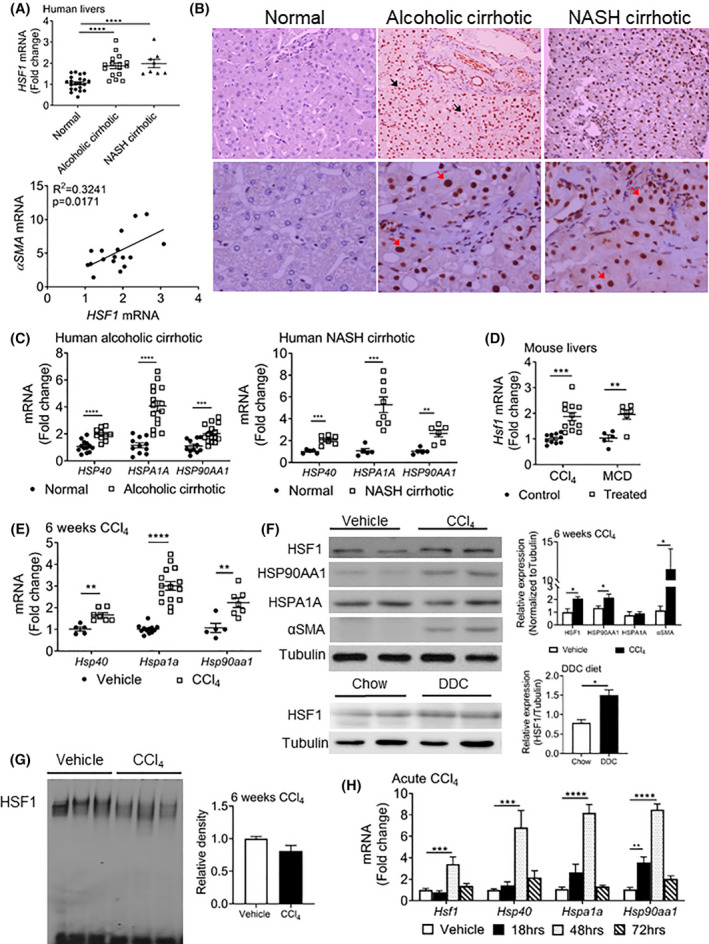
Liver fibrosis is an aberrant wound healing response that results from chronic injury and is mediated by hepatocellular death and activation of hepatic stellate cells (HSCs). While induction of oxidative stress is well established in fibrotic livers, there is limited information on stress-mediated mechanisms of HSC activation. Cellular stress triggers an adaptive defense mechanism via master protein homeostasis regulator, heat shock factor 1 (HSF1), which induces heat shock proteins to respond to proteotoxic stress. Although the importance of HSF1 in restoring cellular homeostasis is well-established, its potential role in liver fibrosis is unknown. Here, we show that HSF1 messenger RNA is induced in human cirrhotic and murine fibrotic livers. Hepatocytes exhibit nuclear HSF1, whereas stellate cells expressing alpha smooth muscle actin do not express nuclear HSF1 in human cirrhosis. Interestingly, despite nuclear HSF1, murine fibrotic livers did not show induction of HSF1 DNA binding activity compared with controls. HSF1-deficient mice exhibit augmented HSC activation and fibrosis despite limited pro-inflammatory cytokine response and display delayed fibrosis resolution. Stellate cell and hepatocyte-specific HSF1 knockout mice exhibit higher induction of profibrogenic response, suggesting an important role for HSF1 in HSC activation and fibrosis. Stable expression of dominant negative HSF1 promotes fibrogenic activation of HSCs. Overactivation of HSF1 decreased phosphorylation of JNK and prevented HSC activation, supporting a protective role for HSF1. Our findings identify an unconventional role for HSF1 in liver fibrosis. Conclusion: Our results show that deficiency of HSF1 is associated with exacerbated HSC activation promoting liver fibrosis, whereas activation of HSF1 prevents profibrogenic HSC activation.


Conflict of interest statement

Nothing to report.

Figures

FIGURE 1
FIGURE 1
Heat shock factor 1 (HSF1) and heat shock proteins (HSPs) are elevated in human cirrhotic and mouse fibrotic livers. Normal livers (n = 20), and livers from patients with alcoholic (n = 16) and nonalcoholic steatohepatitis (NASH; n = 8) cirrhosis were assessed for expression of HSF1 and its correlative analyses with alpha smooth muscle actin (αSMA; n = 18) (A), immunohistochemical staining for HSF1 (top panel, original magnification ×20; bottom panel, original magnification ×40) (B), and HSP40, HSPA1A, and HSP90AA1 messenger RNA (mRNA) (C). (D) Hsf1 in mouse fibrotic livers induced by CCl4 and methionine‐choline–deficient (MCD) diet. (E) mRNA expression of Hsp40, Hspa1a, and Hsp90aa1. (F) Protein levels of HSF1, HSP90AA1, HSPA1A, and α‐SMA (quantitated graphs on right) and HSF1 protein level in livers of 3,5‐diethoxycarbonyl‐1, 4‐dihydrocollidine (DDC) diet–fed animals. (G) HSF1 DNA binding activity in mice injected with CCl4 for 6 weeks (n = 12–16). (H) Hsf1, Hsp40, Hspa1a, and Hsp90aa1 after 18, 48, and 72 h in mice intoxicated with acute CCl4 (n = 4). **p < 0.01, ***p < 0.001, ****p < 0.0001.
FIGURE 2
FIGURE 2
HSF1 is not activated in myofibroblast. (A) Immunohistochemical staining of HSF1 (brown nuclei) and αSMA (red) in normal, alcoholic cirrhotic, and NASH cirrhotic human livers (n = 8) (top panel, original magnification ×20; bottom panel, original magnification ×40). (B,C) Hspa1a and Hsp90aa1 in hepatic stellate cells (HSCs) isolated from mice injected with corn oil or CCl4 injected twice a week for 2 weeks (B) and sham or bile duct ligated (BDL) mice (C) (n = 3). (D,E) Hspa1a and Hsp90aa1 in transforming growth factor β (TGFβ)–stimulated primary HSCs (n = 15) (D) and LX‐2 cells (n = 8) (E). HSCs and LX‐2 cells subjected to heat shock followed by a recovery phase of 4 h served as positive control. (F) Electrophoretic mobility‐shift assay (EMSA) depicting DNA binding activity in the TGFβ‐treated LX‐2 cells for 2 h and 20 h.
FIGURE 3
FIGURE 3
Deficiency of HSF1 exacerbates liver fibrosis. Wild‐type (WT) and Hsf1 −/− mice were either injected with corn oil or CCl4, twice weekly for 6 weeks, or fed with diet containing 0.1% DDC. (A) Hepatic injury was assessed by serum alanine aminotransferase (ALT). (B) Hepatic fibrosis was quantitated by αSma and collagen α1(I) (Col1a1) expression. (C) αSMA immunoblotting was quantified by normalizing to tubulin using ImageJ. (D) αSMA immunohistochemistry (original magnification ×10) was quantitated as percentage area demonstrating αSMA by ImageJ; sirius red staining (original magnification ×10) with graphs represent percentage fibrotic area quantitated by ImageJ. (E) Expression of Tgfβ, platelet‐derived growth factor receptor beta (Pdgfα), connective tissue growth factor (Ctgf), Pdgfrβ, Hsp47, tissue inhibitor of metalloproteinase 1 (Timp1), matrix metalloproteinase 8 (Mmp8), and Mmp13 in CCl4 intoxicated mouse liver. (F) Expression of Tgfβ, Pdgfα, Pdgfβ, Pdgfrβ, Hsp47, Timp1, Mmp8, and Mmp13 in DDC‐fed mouse liver (n = 8–10 per treatment group). *p < 0.05, **p < 0.01, ***p < 0.001, ****p < 0.0001.
FIGURE 4
FIGURE 4
Deficiency of HSF1 delays resolution of liver fibrosis. WT and Hsf1 −/− mice injected with corn oil or CCl4 for 6 weeks were allowed to recover for 4 weeks. Fibrosis was evaluated by αSMA immunoblotting and quantified by densitometry after normalization to tubulin using ImageJ (A), sirius red staining (original magnification ×10) and quantified by ImageJ (B), and Col1a1 (C), Hsp47 (D), Timp1 (E), and Mmp8 (F) expression (n = 4–7 per treatment group per genotype). *p < 0.05, **p < 0.01, ***p < 0.001, ****p < 0.0001.
FIGURE 5
FIGURE 5
Hsf1 −/− affects intrahepatic proinflammatory cytokines during liver injury. (A,B) WT and Hsf1 −/− mice were either injected with corn oil or CCl4 for 6 weeks or fed with diet containing 0.1% DDC. Inflammation was evaluated by expression of monocyte chemoattractant protein 1 (Mcp1), CC‐chemokine receptor 2 (Ccr2), chemokine (C‐C motif) ligand 5 (Ccl5), macrophage inflammatory protein l alpha (Mip1α), tumor necrosis factor α (Tnfα), interleukin (Il), and F4/80 in CCl4‐intoxicated mice (A) or DDC diet–fed mice (B). (C) Hepatic MCP1 was assessed by enzyme‐linked immunosorbent assay (ELISA) in CCl4‐intoxicated mice (n = 8–10). (D) Livers of WT and Hsf1 −/− mice intoxicated with CCl4 for 2 weeks were stained with myeloperoxidase (MPO; original magnification ×40) and assessed for CD11b expression (n = 4). (E,F) Peritoneal exudate cell (PEC)–formed WT and Hsf1 −/− mice were stimulated with lipopolysaccharide (LPS) for 2 h and levels of Il1β, Il6, and Mcp1 were evaluated (E), and for 18 h to evaluate TNFα by ELISA in the culture supernatant (F) (n = 3). *p < 0.05, **p < 0.01, ***p < 0.001, ****p < 0.0001.
FIGURE 6
FIGURE 6
Deficiency of HSF1 increases the profibrogenic gene response to TGFβ in HSCs. (A,B) αSma and Col1a1 in TGFβ‐stimulated primary HSCs isolated from WT and Hsf1 −/− mice (n = 4) (A) and LX‐2 cells transfected with siHSF1 or scram sequences (n = 4) (B). (C) Schematic representation of DHFR.Dn‐cHSF1 variant of LX‐2 cells and HSPA1A levels in the heat‐shocked DHFR.Dn‐cHSF1.LX2 cells in the presence or absence of TMP (n = 3). (D) αSMA and COL1A1 in TGFβ stimulated DHFR.Dn‐cHSF1.LX‐2 cells in the presence or absence of TMP (n = 6). *p < 0.05, **p < 0.01, ***p < 0.001, ****p < 0.0001. TMP, Trimethoprim.
FIGURE 7
FIGURE 7
HSC‐specific and hepatocyte‐specific deletion of HSF1 increases profibrogenic response to acute CCl4. (A) Hspa1a in heat‐shocked HSCs isolated from Hsf1 fl/fl and Hsf1 fl/fl LratCre +/− mice. (B) Mice were injected with an acute dose of corn oil or CCl4 and sacrificed after 48 h to assess αSma, Pdgfβ, Pdgfrβ, Mcp1, Tnfα, and Il1β. (C,D) Hsf1 fl/fl and Hsf1 fl/fl LratCre +/− mice were injected with corn oil or CCl4, for 6 weeks. (C) Fibrosis was assessed by αSma and sirius red staining (original magnification ×10) and are presented as percentage fibrotic area. (D) Levels of αSma, Tgfβ, Pdgfα, Pdgfrβ, and Mmp13. (E) Hspa1a in heat‐shocked HSCs isolated from Hsf1 fl/fl and Hsf1 fl/fl AlbCre +/− mice. (F,G) Hsf1 fl/fl and Hsf1 fl/fl AlbCre +/− mice were injected with an acute dose of corn oil or CCl4 (F) and hepatic αSma, Pdgfβ, Pdgfrβ, Mcp1, and Tnfα (G). (H) Hsf1 fl/fl and Hsf1 fl/fl AlbCre +/− mice were injected with corn oil or CCl4 for 6 weeks, and fibrosis was assessed by αSMA immunoblotting quantified by normalizing to tubulin using ImageJ. (I) Hepatic αSma, Col1a1, Tgfβ, Pdgfα, Pdgfβ, Pdgfrβ, Timp1, and Mmp8. (J) liver caspase‐3 activity. (K) Terminal deoxynucleotidyl transferase–mediated deoxyuridine triphosphate nick‐end labeling (TUNEL) staining of formalin‐fixed liver sections (n = 6–8 mice per treatment group). *p < 0.05, **p < 0.01, ***p < 0.001, ****p < 0.0001.
FIGURE 8
FIGURE 8
Activation of HSF1 ameliorates TGFβ‐mediated LX‐2 cell activation. (A,B) Expression of αSMA and COL1A1 in TGFβ‐stimulated heat‐shocked LX‐2 cells (A), and LX‐2 cells treated with celastrol (B). (C) Schematic representation of FKBP.cHSF1 variant of LX‐2 cells and assessment of HSP40, HSPA1A, and HSP90AA1 in the FKBP.cHSF1.LX‐2 cells in the presence or absence of Shield‐1 (n = 6). (D) αSMA and COL1A1 in TGFβ‐stimulated FKBP.cHSF1.LX2 cells in the presence or absence of Shield‐1. (E) Lysates from FKBP.cHSF1.LX2 stimulated with TGFβ were assessed for p‐JNK, JNK, HSP70, and β‐actin by immunoblotting and quantified by ImageJ. (F) Schematic representation demonstrating the effects of HSF1 deficiency on HSC activation (n = 6–9 per treatment group). *p < 0.05, ****p < 0.0001.

Similar articles

Cited by

References

    1. Weiskirchen R, Weiskirchen S, Tacke F. Recent advances in understanding liver fibrosis: bridging basic science and individualized treatment concepts. F1000Res. 2018;7:921. - PMC - PubMed
    1. Yoon YH, Chen CM. Liver cirrhosis mortality in the United States: national, state, and regional trends, 2000–2015 National Institute on Alcohol Abuse and Alcoholism Division of Epidemiology and Prevention Research Alcohol Epidemiologic Data System 2018. Surveillance Report. 2018;111:1–73.
    1. Seki E, Schwabe RF. Hepatic inflammation and fibrosis: functional links and key pathways. Hepatology. 2015;61:1066–79. - PMC - PubMed
    1. Maiers JL, Malhi H. Endoplasmic reticulum stress in metabolic liver diseases and hepatic fibrosis. Semin Liver Dis. 2019;39:235–48. - PMC - PubMed
    1. Liang S, Kisseleva T, Brenner DA. The role of NADPH oxidases (NOXs) in liver fibrosis and the activation of myofibroblasts. Front Physiol. 2016;7:17. - PMC - PubMed

Publication types