. 2022:20:4238-4250.
doi: 10.1016/j.csbj.2022.07.051. Epub 2022 Aug 5.

Analysis of co-occurring and mutually exclusive amino acid changes and detection of convergent and divergent evolution events in SARS-CoV-2

Affiliations

Analysis of co-occurring and mutually exclusive amino acid changes and detection of convergent and divergent evolution events in SARS-CoV-2

Ruba Al Khalaf et al. Comput Struct Biotechnol J. 2022.

Abstract

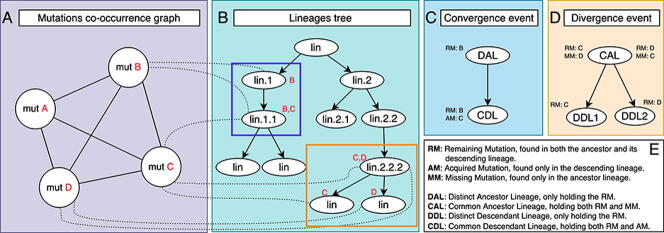
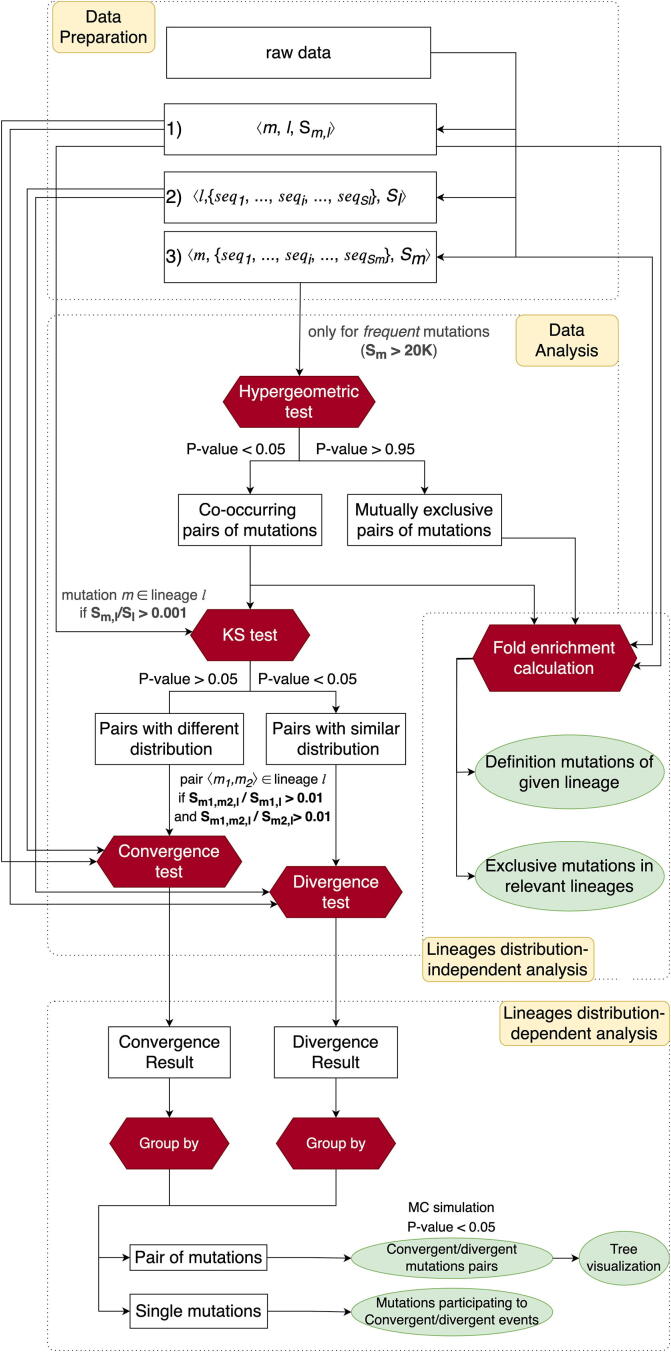
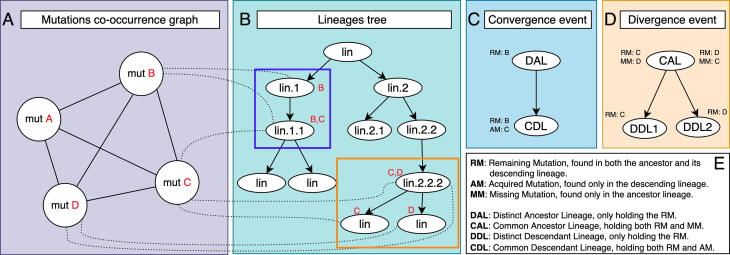
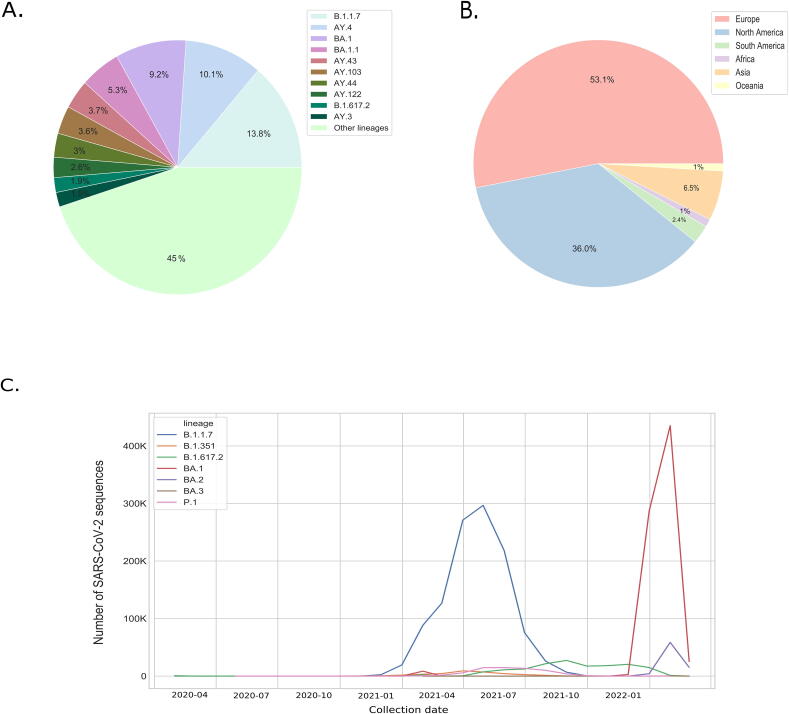
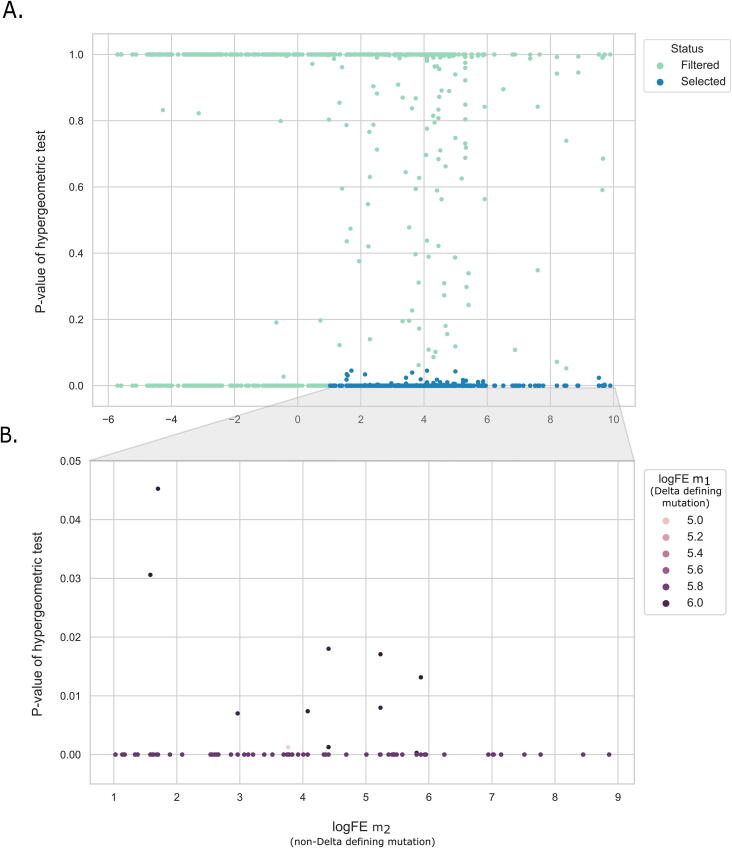
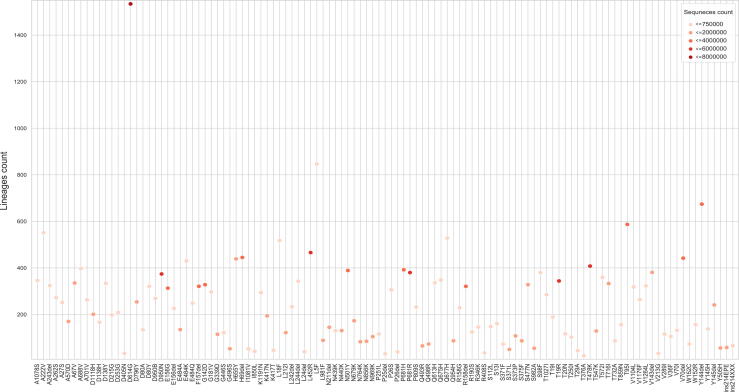
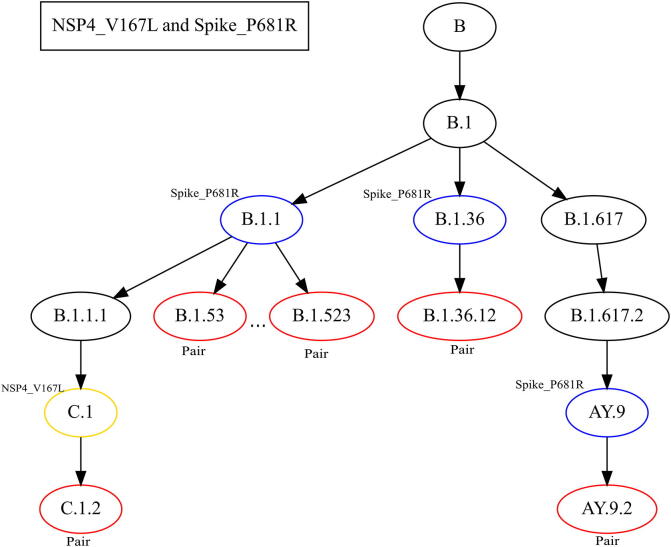
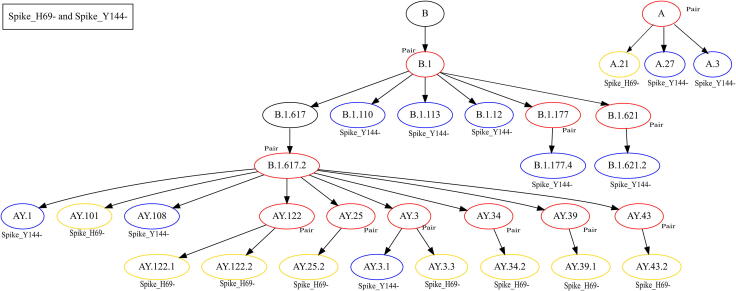
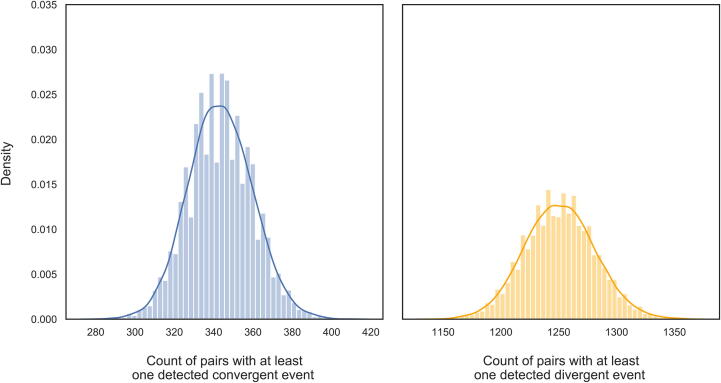
The inflation of SARS-CoV-2 lineages with a high number of accumulated mutations (such as the recent case of Omicron) has risen concerns about the evolutionary capacity of this virus. Here, we propose a computational study to examine non-synonymous mutations gathered within genomes of SARS-CoV-2 from the beginning of the pandemic until February 2022. We provide both qualitative and quantitative descriptions of such corpus, focusing on statistically significant co-occurring and mutually exclusive mutations within single genomes. Then, we examine in depth the distributions of mutations over defined lineages and compare those of frequently co-occurring mutation pairs. Based on this comparison, we study mutations' convergence/divergence on the phylogenetic tree. As a result, we identify 1,818 co-occurring pairs of non-synonymous mutations showing at least one event of convergent evolution and 6,625 co-occurring pairs with at least one event of divergent evolution. Notable examples of both types are shown by means of a tree-based representation of lineages, visually capturing mutations' behaviors. Our method confirms several well-known cases; moreover, the provided evidence suggests that our workflow can explain aspects of the future mutational evolution of SARS-CoV-2.

Keywords: Co-occurring mutations; Convergent evolution; Divergent evolution; Mutually exclusive mutations; SARS-CoV-2; Statistical testing.


Conflict of interest statement

The authors declare that they have no known competing financial interests or personal relationships that could have appeared to influence the work reported in this paper.

Figures

None
Graphical abstract
Fig. 1
Fig. 1
Methodological workflow of the study. The schema is composed of four main parts enclosed in dotted-framed areas: 1) Data preparation; 2) Data Analysis; 3) Lineages distribution-dependent analysis; and 4) Lineages distribution-independent analysis. Legend: Sl: number of sequences assigned to lineage l; Sm: number of sequences holding a mutation m; Sm,l: number of sequences from lineage l holding mutation m; Sm1,m2,l: number of sequences assigned to lineage l holding the pair of mutations m1 and m2; KS test: Kolmogorov–Smirnov test; MC simulation: Monte Carlo simulation.
Fig. 2
Fig. 2
A. Frequent mutations graph whose nodes represent mutations and edges represent the co-occurrence of the two connected nodes within same sequences. B. Tree representing the phylogenetic hierarchy among lineages. C. Schematic representation of a convergence event. D. Schematic representation of a divergence event E. Terminology used in the methods.
Fig. 3
Fig. 3
A. Sequences’ distribution across lineages, detailing the ten most representative lineages. B. Sequences’ distribution across all the continents. C. Number of sequences assigned to the lineages currently or previously considered as VOCs according to the WHO with their collection dates.
Fig. 4
Fig. 4
A. 2D Scatter plot of the p-values of the hypergeometric tests on all the pairs of mutations in which only one of the two is a defining mutation of Delta variant, mapped on the values of logFE of the mutation of the pair that is not a Delta-defining mutation (outside of the list). A total of 7,638 pairs of mutations were considered in the figure after removing mutations with FE = 0. Blue dots indicate the p-values<0.05, whose corresponding non-Delta mutations have a logFE>1. B. Zoomed version of Panel A scatter plot; it includes 68 mutations extracted from the ‘blue’ pairs selected in Panel A (co-occurring with all 19 Delta-defining mutations); here, a color scale is used to indicate the logFE of the pair mutation that belongs to the Delta variant: the darker the color, the higher the value. The corresponding 3D scatter plot is provided in Supplementary Figure S1.
Fig. 5
Fig. 5
Scatter plot indicating the number of lineages containing the frequent mutations of the Spike protein; the higher the number, the more spread a mutation is over the lineages. A color scale is used to express the number of sequence exhibiting each mutation.
Fig. 6
Fig. 6
Tree-based representation of lineages involved in the evolution of NSP4_V167L and Spike_P681R. Each node represents one lineage and the arrow between two lineages draws the phylogenetic relation between an ancestor lineage and its descendant lineage. For ease of visualization, we show only part of the tree (5 convergence events out of 17 events detected by the pair). Colors are used to indicate which mutation is present in the indicated lineage: red when both mutations are present, blue when only Spike_P681R is present, and yellow when only NSP4_V167L is present.
Fig. 7
Fig. 7
Tree-based representation of lineages involved in the evolution of Spike_H69- and Spike_Y144-. For ease of visualization, here we present a portion of the original tree, with 19 out of 307 total divergent events detected for the pair of deletions.
Fig. 8
Fig. 8
Distributions of the counts of pairs with randomly detected convergent (left) or divergent (right) events, extracted from a sample of 16,692 pairs of mutations repeated for 10,000 times.
None
Figure S1
None
Figure S2
None
Figure S3

Similar articles

Cited by

References

    1. Al Khalaf R., Alfonsi T., Ceri S., Bernasconi A. CoV2K: a knowledge base of SARS-CoV-2 variant impacts. International Conference on Research Challenges in Information Science, Springer. 2021:274–282.
    1. Alfonsi T., Al Khalaf R., Ceri S., Bernasconi A. CoV2K model, a comprehensive representation of SARS-CoV-2 knowledge and data interplay. Sci Data. 2022;9:260. doi: 10.1038/s41597-022-01348-9. - DOI - PMC - PubMed
    1. Ali F., Kasry A., Amin M. The new SARS-CoV-2 strain shows a stronger binding affinity to ACE2 due to N501Y mutant. Med Drug Discov. 2021;10 - PMC - PubMed
    1. Andreano E., Rappuoli R. SARS-CoV-2 escaped natural immunity, raising questions about vaccines and therapies. Nat Med. 2021;27:759–761. - PubMed
    1. Bernasconi A., Mari L., Casagrandi R., Ceri S. Data-driven analysis of amino acid change dynamics timely reveals SARS-CoV-2 variant emergence. Sci Rep. 2021;11:21068. doi: 10.1038/s41598-021-00496-z. - DOI - PMC - PubMed