. 2022 Aug 4:10:e13685.
doi: 10.7717/peerj.13685. eCollection 2022.

Factors limiting reproductive success in urban Greylag Geese (Anser anser)

Affiliations

Factors limiting reproductive success in urban Greylag Geese (Anser anser)

Sabrina Mai et al. PeerJ. .

Abstract

In the late eighties, Greylag Geese (Anser anser) started to colonise an urban area previously void of geese in southwestern Germany. Between 2004 and 2020, in a period of steady population increase with subsequent population stagnation, we analysed two measures of reproductive success: (1) the relation between freshly hatched to fledged young for each brood and (2) the probability of a hatchling to survive to fledging. We were able to show that the dispersal of pairs from the nesting site to a different brood rearing area resulted in higher reproductive success. However, the increasing population size of Greylag Geese and the number of breeding pairs of recently immigrated Egyptian Geese (Alopochen aegyptiaca) had a negative impact on reproductive success, indicating density dependence. Our results show that newly established populations in urban settings do not grow indefinitely, which is an important fact that should be taken into account by wildlife managers.

Keywords: Breeding pairs; Colonisation; Density dependence; Dispersal; Egyptian Geese; Reproduction; Year effect.


Conflict of interest statement

The authors declare there are no competing interests.

Figures

Figure 1
Figure 1. Population development of Greylag and Egyptian Geese and fledging success of Greylag Geese.
(A) Maximum annual count and (B) number of breeding pairs of Greylag (light grey) and Egyptian Geese (dark grey) in the study area (1981–2020). Graphs adapted from Hohmann & Woog (2021a). (C) The mean number of hatched (light grey dots) and fledged (black diamonds) goslings of Greylag Geese. (D) The fledging success per Greylag Goose brood (% of fledged/hatched). The annual mean fledging success per pair decreased over the years (lm: y =−0.02x + 47.11, t0.01 = −4.18, p < 0.0001).
Figure 2
Figure 2. Fledging success of individual pairs.
(A) Fledging success per brood (%) of the nth time a pair had a brood. The dashed line indicates a quadratic regression (y =−2.57x2 + 21.95x + 33.18). (B) Fledging success per brood (%) plotted against the total number of times each pair has bred. The dashed line indicates a logarithmic regression (y = 21.75*log(x) + 41.19). Large grey dots in a, b indicate the mean of all fledging successes per brood ± SE, bars indicate number of broods (A) and number of pairs (B), respectively. The small dots represent each brood. Shading intensity increases with overlap with other broods.
Figure 3
Figure 3. Frequency of brood sizes in Greylag Geese (2004–2020) in relation to the fledging success per brood (%).
The dashed line indicates a quadratic regression (y = −0.26x2 + 5.32x + 43.96). Grey dots indicate mean fledging success ± SE and bars indicate number of broods.
Figure 4
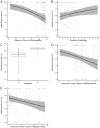
Figure 4. The probability of a hatchling to fledge (hatchling survival (%)) (A) decreased with the maximum annual count of the local population and (B) increased with the number of hatchlings per pair. (C) Dispersed pairs (n = 30) had a higher hatchling survival than pairs that did not (n = 207). Hatchling survival (%) was negatively affected by (D) the number of Greylag Geese breeding pairs and (E) the number of Egyptian Geese breeding pairs.
Graphs from model M1 (A–C) and M2 (D, E). Each hatchling is represented by a small dot; shading intensity of small dots increases with the overlap with other hatchlings thus darker dots indicate a higher number of hatchlings. Shaded area in A, B, D, E represents the 95% confidence interval (CI).

Similar articles

Cited by

References

    1. Angelier F, Weimerskirch H, Dano S, Chastel O. Age, experience and reproductive performance in a long-lived bird: a hormonal perspective. Behavioral Ecology and Sociobiology. 2007;61:611–621. doi: 10.1007/s00265-006-0290-1. - DOI
    1. Ankney CD, MacInnes CD. Nutrient reserves and reproductive performance of female lesser snow geese. The Auk. 1978;95:459–471.
    1. Baker J, Harvey KJ, French K. Threats from introduced birds to native birds. Emu - Austral Ornithology. 2014;114:1–12. doi: 10.1071/MU12122. - DOI
    1. Bartón K. MuMIn: multi-model inference. R package version 1.43.17https://cran.r-project.org/package=MuMIn 2020
    1. Bates D, Mächler M, Bolker B, Walker S. Fitting linear mixed-effects models using lme4. Journal of Statistical Software. 2015;67:1–48. doi: 10.18637/jss.v067.i01. - DOI

Publication types

LinkOut - more resources