

Dietary, comorbidity, and geo-economic data fusion for explainable COVID-19 mortality prediction
- PMID: 35945970
- PMCID: PMC9352652
- DOI: 10.1016/j.eswa.2022.118377
Dietary, comorbidity, and geo-economic data fusion for explainable COVID-19 mortality prediction
Abstract
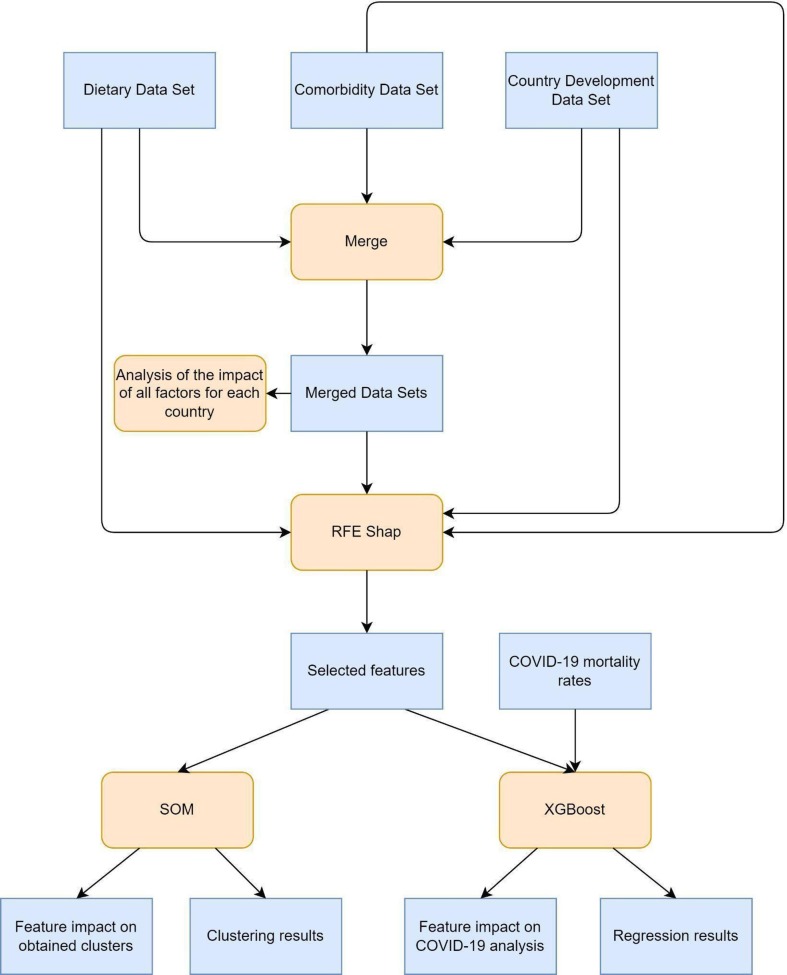
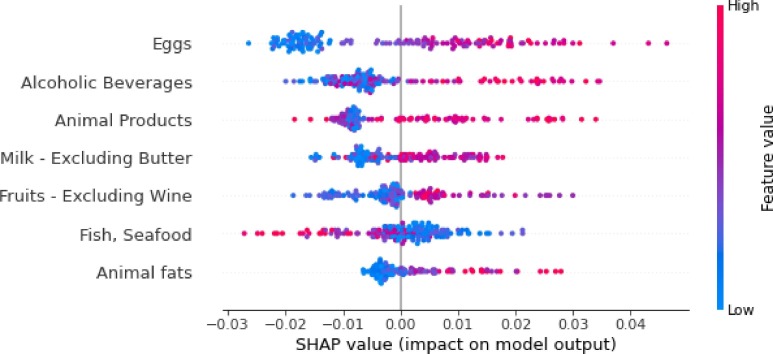
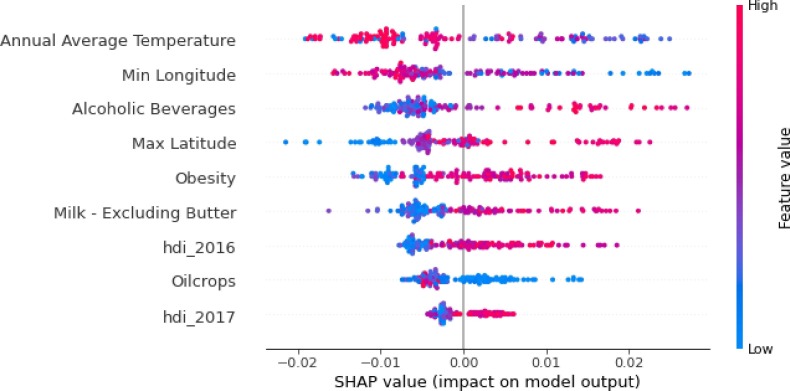
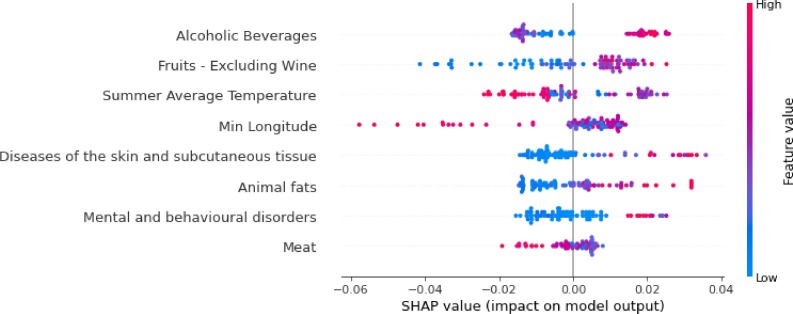
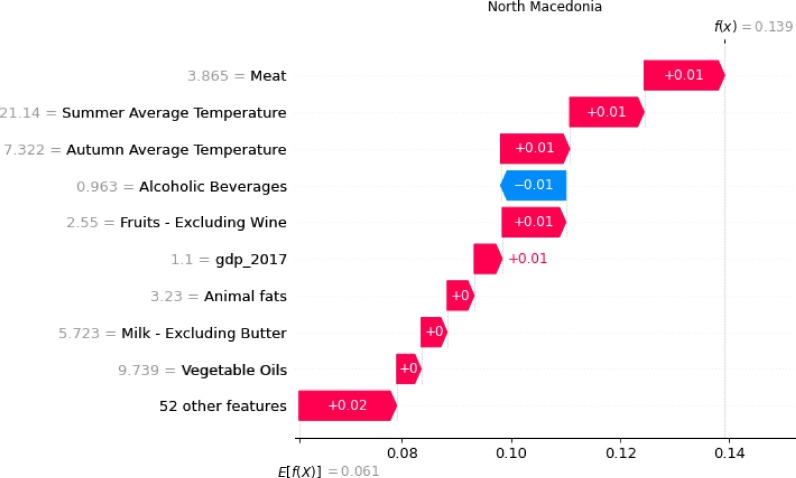
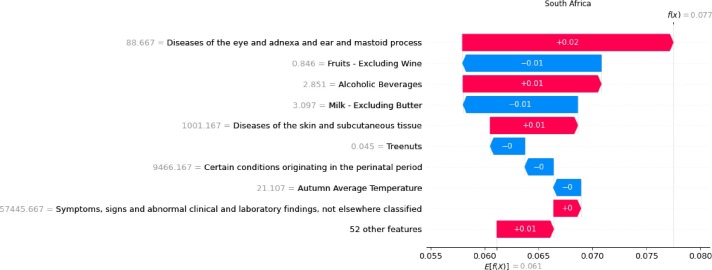
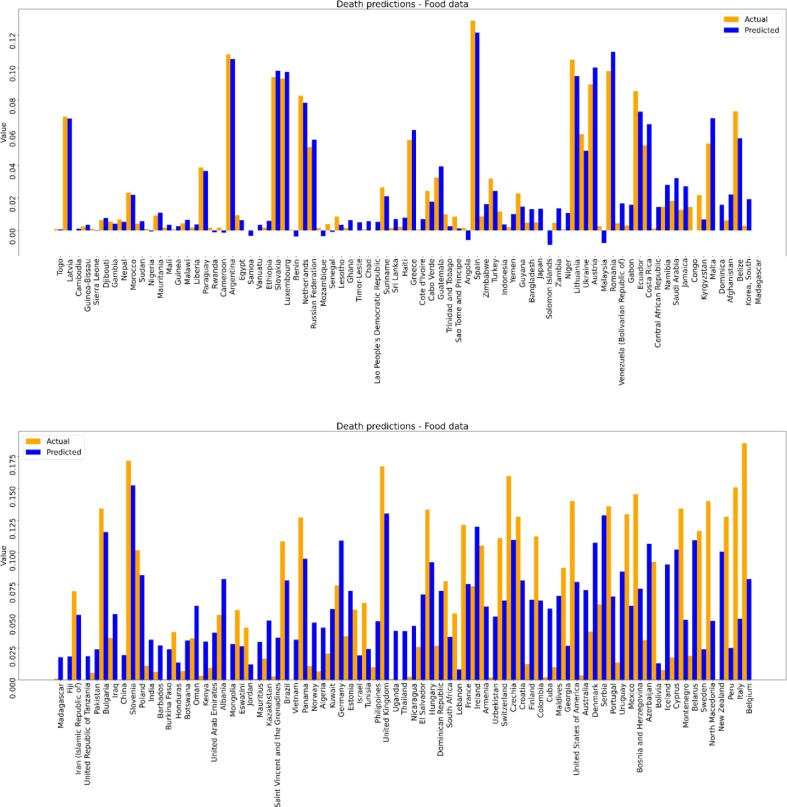
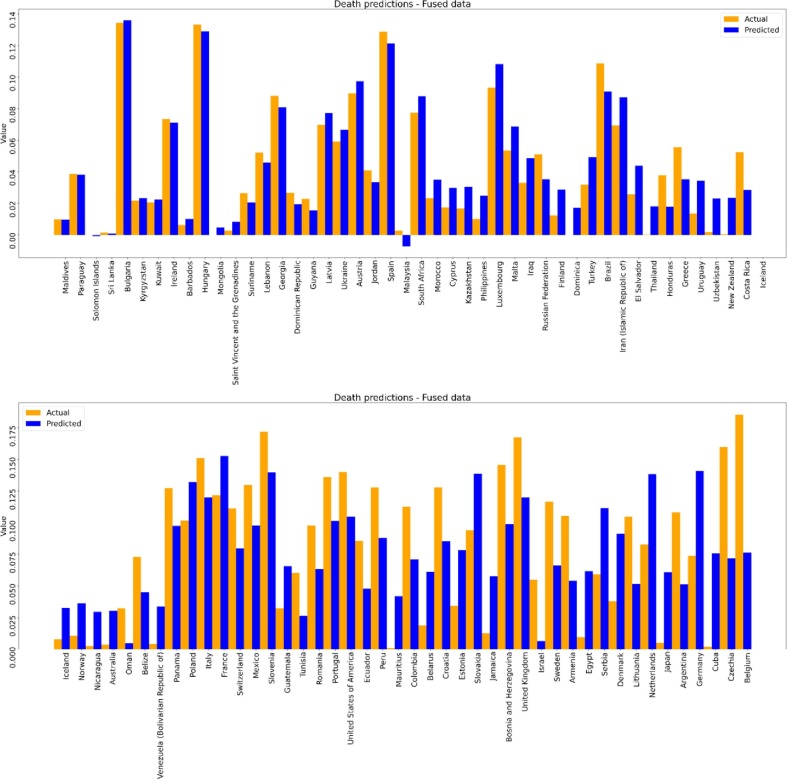
Many factors significantly influence the outcomes of infectious diseases such as COVID-19. A significant focus needs to be put on dietary habits as environmental factors since it has been deemed that imbalanced diets contribute to chronic diseases. However, not enough effort has been made in order to assess these relations. So far, studies in the field have shown that comorbid conditions influence the severity of COVID-19 symptoms in infected patients. Furthermore, COVID-19 has exhibited seasonal patterns in its spread; therefore, considering weather-related factors in the analysis of the mortality rates might introduce a more relevant explanation of the disease's progression. In this work, we provide an explainable analysis of the global risk factors for COVID-19 mortality on a national scale, considering dietary habits fused with data on past comorbidity prevalence and environmental factors such as seasonally averaged temperature geolocation, economic and development indices, undernourished and obesity rates. The innovation in this paper lies in the explainability of the obtained results and is equally essential in the data fusion methods and the broad context considered in the analysis. Apart from a country's age and gender distribution, which has already been proven to influence COVID-19 mortality rates, our empirical analysis shows that countries with imbalanced dietary habits generally tend to have higher COVID-19 mortality predictions. Ultimately, we show that the fusion of the dietary data set with the geo-economic variables provides more accurate modeling of the country-wise COVID-19 mortality rates with respect to considering only dietary habits, proving the hypothesis that fusing factors from different contexts contribute to a better descriptive analysis of the COVID-19 mortality rates.
Keywords: COVID-19 mortality prediction; Comorbidity; Data fusion; Dietary habits; Geo-economic factors.
© 2022 The Author(s).
Conflict of interest statement
The authors declare that they have no known competing financial interests or personal relationships that could have appeared to influence the work reported in this paper.
Figures
Similar articles
-
Modeling and tracking Covid-19 cases using Big Data analytics on HPCC system platformm.J Big Data. 2021;8(1):33. doi: 10.1186/s40537-021-00423-z. Epub 2021 Feb 15. J Big Data. 2021. PMID: 33614394 Free PMC article.
-
Is There a Relationship Between ADHD and COVID-19 Prevalence and Mortality Indices? An Analysis of Data From 156 Countries.J Atten Disord. 2022 Jun;26(8):1069-1077. doi: 10.1177/10870547211056894. Epub 2021 Nov 16. J Atten Disord. 2022. PMID: 34784830
-
Leveraging weather data for forecasting cases-to-mortality rates due to COVID-19.Chaos Solitons Fractals. 2021 Nov;152:111340. doi: 10.1016/j.chaos.2021.111340. Epub 2021 Aug 18. Chaos Solitons Fractals. 2021. PMID: 34421230 Free PMC article.
-
Mortality-related risk factors of COVID-19: a systematic review and meta-analysis of 42 studies and 423,117 patients.BMC Infect Dis. 2021 Aug 21;21(1):855. doi: 10.1186/s12879-021-06536-3. BMC Infect Dis. 2021. PMID: 34418980 Free PMC article.
-
Prevalence of comorbidity in Chinese patients with COVID-19: systematic review and meta-analysis of risk factors.BMC Infect Dis. 2021 Feb 22;21(1):200. doi: 10.1186/s12879-021-05915-0. BMC Infect Dis. 2021. PMID: 33618678 Free PMC article.
Cited by
-
Deep learning based hybrid prediction model for predicting the spread of COVID-19 in the world's most populous countries.Expert Syst Appl. 2023 Nov 30;231:120769. doi: 10.1016/j.eswa.2023.120769. Epub 2023 Jun 12. Expert Syst Appl. 2023. PMID: 37334273 Free PMC article.
-
Towards Improved XAI-Based Epidemiological Research into the Next Potential Pandemic.Life (Basel). 2024 Jun 21;14(7):783. doi: 10.3390/life14070783. Life (Basel). 2024. PMID: 39063538 Free PMC article. Review.
-
How impact factors, including the COVID-19 pandemic, change the quality of life of the elderly.Popul Health Metr. 2025 Jul 1;23(1):33. doi: 10.1186/s12963-025-00395-9. Popul Health Metr. 2025. PMID: 40598587 Free PMC article.
References
-
- Berkeley Earth, B. E. (2016). Data Overview. Retrieved May, 2020 from Berkeley Earth: http://berkeleyearth.org/data/.
-
- Caramelo F., Ferreira N., Oliveiros B. Estimation of risk factors for COVID-19 mortality-preliminary results. MedRxiv. 2020
LinkOut - more resources
Full Text Sources
Miscellaneous