

Fully automated breast segmentation on spiral breast computed tomography images
- PMID: 35946049
- PMCID: PMC9588268
- DOI: 10.1002/acm2.13726
Fully automated breast segmentation on spiral breast computed tomography images
Abstract
Introduction: The quantification of the amount of the glandular tissue and breast density is important to assess breast cancer risk. Novel photon-counting breast computed tomography (CT) technology has the potential to quantify them. For accurate analysis, a dedicated method to segment the breast components-the adipose and glandular tissue, skin, pectoralis muscle, skinfold section, rib, and implant-is required. We propose a fully automated breast segmentation method for breast CT images.
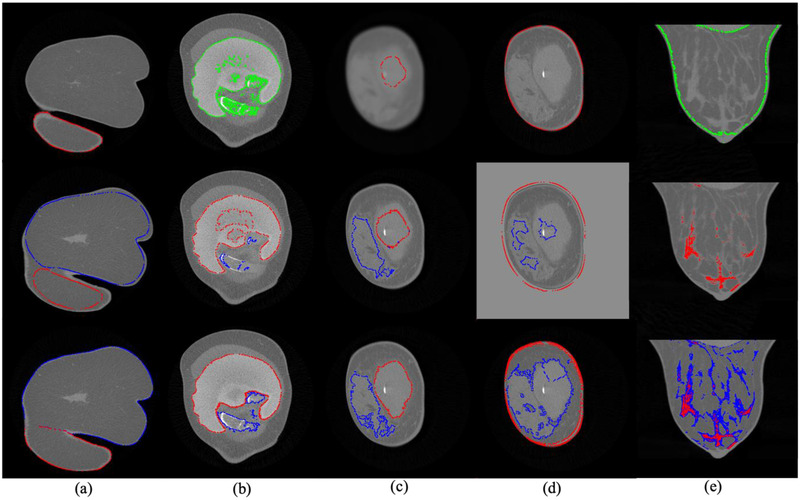
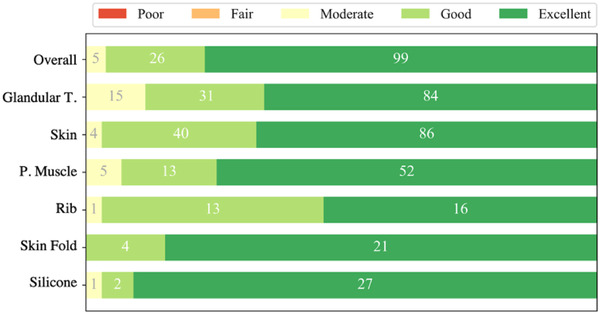
Methods: The framework consists of four parts: (1) investigate, (2) segment the components excluding adipose and glandular tissue, (3) assess the breast density, and (4) iteratively segment the glandular tissue according to the estimated density. For the method, adapted seeded watershed and region growing algorithm were dedicatedly developed for the breast CT images and optimized on 68 breast images. The segmentation performance was qualitatively (five-point Likert scale) and quantitatively (Dice similarity coefficient [DSC] and difference coefficient [DC]) demonstrated according to human reading by experienced radiologists.
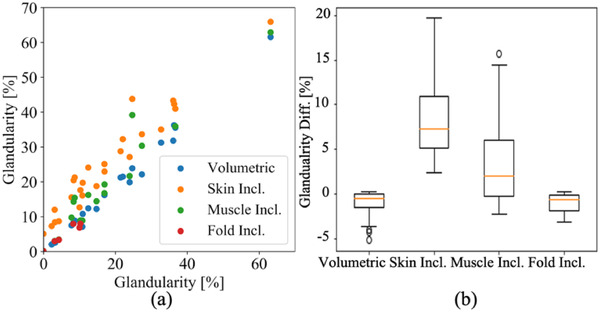
Results: The performance evaluation on each component and overall segmentation for 17 breast CT images resulted in DSCs ranging 0.90-0.97 and in DCs 0.01-0.08. The readers rated 4.5-4.8 (5 highest score) with an excellent inter-reader agreement. The breast density varied by 3.7%-7.1% when including mis-segmented muscle or skin.
Conclusion: The automatic segmentation results coincided with the human expert's reading. The accurate segmentation is important to avoid the significant bias in breast density analysis. Our method enables accurate quantification of the breast density and amount of the glandular tissue that is directly related to breast cancer risk.
Keywords: CT; breast; density; segmentation.
© 2022 The Authors. Journal of Applied Clinical Medical Physics published by Wiley Periodicals, LLC on behalf of The American Association of Physicists in Medicine.
Conflict of interest statement
All authors declare that they have no conflicts of interest.
Figures


References
-
- Sung H, Ferlay J, Siegel RL, et al. Global Cancer Statistics 2020: GLOBOCAN estimates of incidence and mortality worldwide for 36 cancers in 185 countries. CA Cancer J Clin. 2021;71(3):209‐249. - PubMed
-
- Harvey JA, Bovbjerg VE. Quantitative assessment of mammographic breast density: relationship with breast cancer risk. Radiology. 2004;230(1):29‐41. - PubMed
-
- D'Orsi CJ, Sickles EA, Mendelson EB, et al. Breast Imaging Reporting and Data System. American College of Radiology; 2013.
-
- Weigel S, Heindel W, Heidrich J, Hense HW, Heidinger O. Digital mammography screening: sensitivity of the programme dependent on breast density. Eur Radiol. 2017;27(7):2744‐2751. - PubMed
MeSH terms
LinkOut - more resources
Full Text Sources
Medical
