. 2022 Aug 10;289(1980):20220954.
doi: 10.1098/rspb.2022.0954. Epub 2022 Aug 10.

Behavioural specialization and learning in social networks

Affiliations

Behavioural specialization and learning in social networks

Olof Leimar et al. Proc Biol Sci. .

Abstract

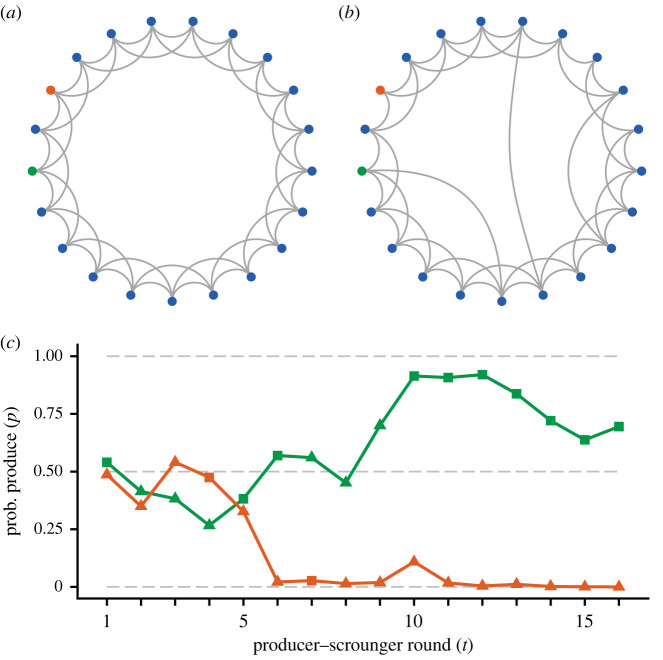
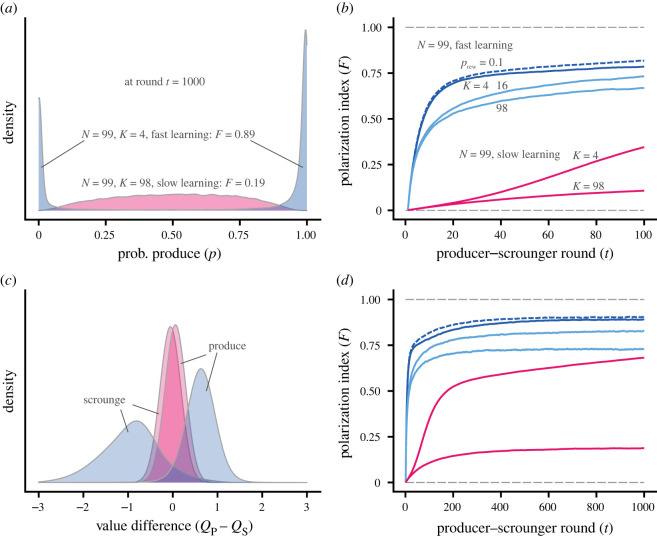
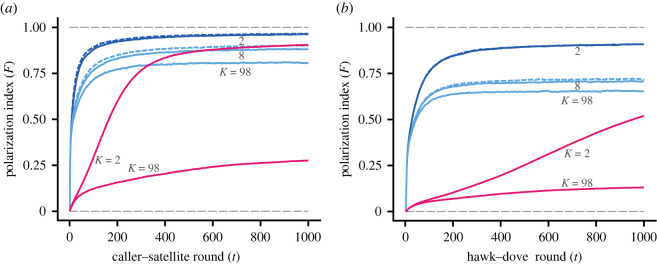
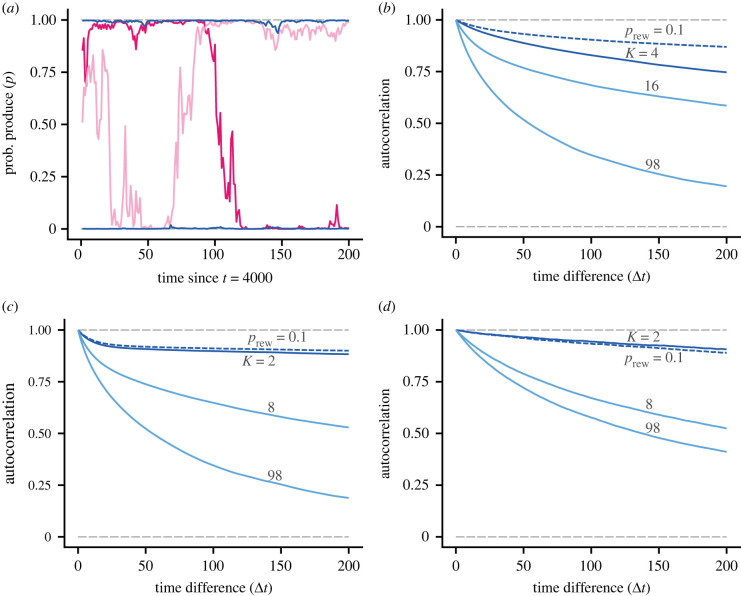
Interactions in social groups can promote behavioural specialization. One way this can happen is when individuals engage in activities with two behavioural options and learn which option to choose. We analyse interactions in groups where individuals learn from playing games with two actions and negatively frequency-dependent payoffs, such as producer-scrounger, caller-satellite, or hawk-dove games. Group members are placed in social networks, characterized by the group size and the number of neighbours to interact with, ranging from just a few neighbours to interactions between all group members. The networks we analyse include ring lattices and the much-studied small-world networks. By implementing two basic reinforcement-learning approaches, action-value learning and actor-critic learning, in different games, we find that individuals often show behavioural specialization. Specialization develops more rapidly when there are few neighbours in a network and when learning rates are high. There can be learned specialization also with many neighbours, but we show that, for action-value learning, behavioural consistency over time is higher with a smaller number of neighbours. We conclude that frequency-dependent competition for resources is a main driver of specialization. We discuss our theoretical results in relation to experimental and field observations of behavioural specialization in social situations.

Keywords: animal personality; behavioural consistency; game theory; reinforcement learning.


Conflict of interest statement

The authors declare no competing interests.

Figures

Figure 1.
Figure 1.
Illustration of networks with social interactions. (a,b) Coloured points represent individuals in a group and grey lines connect neighbours. Neighbours have interactions, implemented as games of a specified kind, such as producer–scrounger, caller–satellite or hawk–dove. Groups consist of 21 individuals (N = 21), presented as points along the perimeter of a circle. Each individual in (a) is connected to two neighbours in the clockwise and two in the counterclockwise direction, so each has four neighbours (K = 4). In graph theory such a network is called a regular ring lattice. (b) Shows a so-called small-world network, obtained from the one in (a) through a ‘rewiring procedure’, as described by Watts & Strogatz [26]. The probability of rewiring a connection is prew = 0.1. (c) Illustration of the probabilities to produce and the actions taken (squares denote produce and triangles scrounge) for two individuals, shown colour coded, in the network in (a). (Online version in colour.)
Figure 2.
Figure 2.
Behavioural polarization when there is action–value learning in a producer–scrounger game. Data are from 500 simulated groups per case and each group has N=99members. (a) Distributions of the probability p to act as a producer after t = 1000 rounds of learning. Blue indicates a case where learning is fast (α = 0.10) and each individual is connected to K = 4 neighbours. Red is a case where learning is slow (α = 0.01) and all group members are connected (K = 98). The values of the group-mean polarization index F at t = 1000 for the two cases are indicated. (b) Change over time of the group-mean polarization index F for a number of cases. Blue curves show cases with fast learning (α = 0.10) and red cases with slow learning (α = 0.01), each labelled with the value of K. The dashed dark-blue line shows polarization in a small-world network obtained through rewiring (prew = 0.1) from the network illustrated by the dark-blue solid line, with K = 4. (c) Distributions of the difference between the estimated values of producing (QP) and scrounging (QS) after t=1000rounds of learning, for the two cases in (a). The distributions are split according to an individual’s most recent action, scrounge or produce. (d) Same as (b) but over a greater number of rounds of learning. (Online version in colour.)
Figure 3.
Figure 3.
Behavioural polarization with action–value learning in caller–satellite and hawk–dove games. Data are from 500 simulated groups per case and each group has N = 99 members. (a) Change over time of the group-mean polarization index F for a number of cases of a caller–satellite game. Blue curves show cases with fast learning (α = 0.10) and red cases with slow learning (α = 0.01), each labelled with the number of neighbours K. The dashed lines shows polarization in small-world networks obtained through rewiring (prew = 0.1) from the networks with K = 2 and K = 8, respectively. (b) Same as (a) but for a hawk–dove game. (Online version in colour.)
Figure 4.
Figure 4.
Illustration of behavioural consistency for different cases of social networks and games. Consistency tends to be higher in social networks with fewer neighbours. The group size is N = 99 for all cases. (a) Four examples of the individual probability p to act as a producer. The dark-blue curves show two examples with K = 4 neighbours, and the reddish curves show examples with K = 98 neighbours. In order to illustrate steady-state situations, the curves start at round t = 4000. (b) Autocorrelation for the logit of the probability to act as producer, for the fast-learning cases in figure 2b,d and using the same colour coding. In order to illustrate steady-state situations, the autocorrelations were computed from rounds between t = 4000 and t = 5000. (c) Autocorrelation for the logit of the probability to act as caller, for the fast-learning cases in figure 3a. (d) Autocorrelation for the logit of the probability to act as hawk, for the fast-learning cases in figure 3b. The autocorrelations are estimated from simulated individuals in five groups. (Online version in colour.)

Similar articles

Cited by

References

    1. Sih A, Bell A, Johnson JC. 2004. Behavioral syndromes: an ecological and evolutionary overview. Trends Ecol. Evol. 19, 372-378. (10.1016/j.tree.2004.04.009) - DOI - PubMed
    1. Réale D, Reader SM, Sol D, McDougall PT, Dingemanse NJ. 2007. Integrating animal temperament within ecology and evolution. Biol. Rev. 82, 291-318. (10.1111/j.1469-185X.2007.00010.x) - DOI - PubMed
    1. Bell AM, Hankison SJ, Laskowski KL. 2009. The repeatability of behaviour: a meta-analysis. Anim. Behav. 77, 771-783. (10.1016/j.anbehav.2008.12.022) - DOI - PMC - PubMed
    1. Dall SRX, Houston AI, McNamara JM. 2004. The behavioural ecology of personality: consistent individual differences from an adaptive perspective. Ecol. Lett. 7, 734-739. (10.1111/j.1461-0248.2004.00618.x) - DOI
    1. Maynard Smith J, Parker GA. 1976. The logic of asymmetric animal contests. Anim. Behav. 24, 159-175. (10.1016/S0003-3472(76)80110-8) - DOI

Publication types

LinkOut - more resources