. 2022 Aug;12(8):210375.
doi: 10.1098/rsob.210375. Epub 2022 Aug 10.

Multi-omics analysis for potential inflammation-related genes involved in tumour immune evasion via extended application of epigenetic data

Affiliations

Multi-omics analysis for potential inflammation-related genes involved in tumour immune evasion via extended application of epigenetic data

Chenshen Huang et al. Open Biol. 2022 Aug.

Abstract

Accumulating evidence suggests that inflammation-related genes may play key roles in tumour immune evasion. Programmed cell death ligand 1 (PD-L1) is an important immune checkpoint involved in mediating anti-tumour immunity. We performed multi-omics analysis to explore key inflammation-related genes affecting the transcriptional regulation of PD-L1 expression. The open chromatin region of the PD-L1 promoter was mapped using the assay for transposase-accessible chromatin using sequencing (ATAC-seq) profiles. Correlation analysis of epigenetic data (ATAC-seq) and transcriptome data (RNA-seq) were performed to identify inflammation-related transcription factors (TFs) whose expression levels were correlated with the chromatin accessibility of the PD-L1 promoter. Chromatin immunoprecipitation sequencing (ChIP-seq) profiles were used to confirm the physical binding of the TF STAT2 and the predicted binding regions. We also confirmed the results of the bioinformatics analysis with cell experiments. We identified chr9 : 5449463-5449962 and chr9 : 5450250-5450749 as reproducible open chromatin regions in the PD-L1 promoter. Moreover, we observed a correlation between STAT2 expression and the accessibility of the aforementioned regions. Furthermore, we confirmed its physical binding through ChIP-seq profiles and demonstrated the regulation of PD-L1 by STAT2 overexpression in vitro. Multiple databases were also used for the validation of the results. Our study identified STAT2 as a direct upstream TF regulating PD-L1 expression. The interaction of STAT2 and PD-L1 might be associated with tumour immune evasion in cancers, suggesting the potential value for tumour treatment.

Keywords: ATAC-seq; PD-L1; STAT2; epigenetics; immune checkpoint therapy; immune evasion.


Conflict of interest statement

The authors declare that the research was conducted in the absence of any commercial or financial relationships that could be construed as a potential conflict of interest.

Figures

Figure 1.
Figure 1.
An overview of the study design.
Figure 2.
Figure 2.
Correlation analysis between PD-L1 expression and PD-L1 promoter accessibility. (a) Correlation analysis revealed that PD-L1 expression was significantly correlated with the chromatin accessibility of Region 1 (r = 0.6, p < 0.05). (b) Correlation analysis revealed that PD-L1 expression was significantly correlated with the chromatin accessibility of Region 2 (r = 0.4, p < 0.05).
Figure 3.
Figure 3.
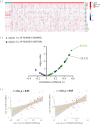
Integrative analysis of RNA-seq and ATAC-seq profiles identified STAT2 as a potential upstream for PD-L1. (a) Heatmap for gene expression of the identified 21 inflammation-related TFs, which were from NF-kB, IRFs or STATs families. The mRNA expression of all the 21 TFs could be detected in colon cancer tissues. (b) Correlation analysis revealed that STAT2 had a stronger association with chromatin accessibilities of PD-L1 promoter. (c) The STAT2 expression was significantly correlated with the chromatin accessibility of Region 1 (r = 0.6, p < 0.05). The STAT2 expression was significantly correlated with the chromatin accessibility of Region 2 (r = 0.5, p < 0.05).
Figure 4.
Figure 4.
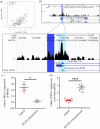
Validation of the direct regulation of STAT2 on PD-L1 through ChIP-seq profiles and cell experiments. (a) The mRNA expressions of STAT2 and PD-L1 were significantly correlated (r = 0.53, p < 0.05). (b) ChIP-seq profiles of STAT2 in colon cancer cell line revealed that STAT2 could directly bind to PD-L1 promoter. And there was a strong overlap between STAT2 binding sites and the predicted regions (Region 1 in dark blue, or Region 2 in light blue). (c) The knockdown of STAT2 could lead to downregulation of PD-L1 significantly (p < 0.05). (d) The overexpression of STAT2 could lead to upregulation of PD-L1 significantly (p < 0.05). *p < 0.05; ****p < 0.0001.
Figure 5.
Figure 5.
Exploring the potential pathways which were related with the interaction of STAT2 and PD-L1. (a) Correlation heatmap of STAT2, PD-L1, and the significant KEGG pathways. The pathways, which had a strong correlation with both STAT2 and PD-L1 (r > 0.4, p < 0.05), were displayed. (b) The dot plots showed the correlation between STAT2 expression, and the KEGG_antigen_processing_and_presentation pathway (marked in red, r = 0.6, p < 0.05) or KEGG_natural_killer_cell_mediated_cytotoxicit pathway (marked in yellow, r = 0.57, p < 0.05). (c) Correlation heatmap of STAT2, PD-L1, and the significant GO pathways. The pathways, which had a strong correlation with both STAT2 and PD-L1 (r > 0.4, p < 0.05), were displayed. (d) The dot plots showed the correlation between STAT2 expression, and the GOBP_cellular_response_to_interferon_alpha pathway (marked in green, r = 0.57, p < 0.05) or GOBP_regulation_of_lymphocyte_chemotaxis pathway (marked in blue, r = 0.56, p < 0.05).
Figure 6.
Figure 6.
Exploring the potential immune cells which were related with the interaction of STAT2 and PD-L1. (a) Correlation heatmap of STAT2, PD-L1, and the significant tumour infiltrating immune cells. After the clustering through R package corrplot, STAT2 and PD-L1 were found to be potentially associated with multiple cell types, especially macrophages. (b) The correlation heatmap showed the immune cells that had a strong correlation with both STAT2 and PD-L1 (r > 0.4, p < 0.05).
Figure 7.
Figure 7.
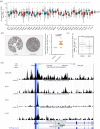
Multiple databases were used for validation. (a) Box plots of STAT2 expression in different cancers from the TCGA and GTEx databases accessed by Xena. STAT2 was widely expressed across multiple cancer types. (b) Immunohistochemical results of the protein expression of STAT2 in patients with colon cancers via the HPA database. The expression level of STAT2 in normal endothelial cells was relatively lower (p < 0.05). (c) Box plots revealed a significant difference of STAT2 expression between MSI-H and MSS (no-MSI) colon cancer (p < 0.05). (d) The overlap of STAT2 binding sites and the predicted region (Region 1 in dark blue, or Region 2 in light blue) was validated in STAT2 ChIP-seq profiles of multipe cell lines, including GM12878, K562 and LoVo.

Similar articles

Cited by

References

    1. Doroshow DB, et al. 2021. PD-L1 as a biomarker of response to immune-checkpoint inhibitors. Nat. Rev. Clin. Oncol. 18, 345-362. (10.1038/s41571-021-00473-5) - DOI - PubMed
    1. Egen JG, Ouyang W, Wu LC. 2020. Human anti-tumor immunity: insights from immunotherapy clinical trials. Immunity 52, 36-54. (10.1016/j.immuni.2019.12.010) - DOI - PubMed
    1. He X, Xu C. 2020. Immune checkpoint signaling and cancer immunotherapy. Cell Res. 30, 660-669. (10.1038/s41422-020-0343-4) - DOI - PMC - PubMed
    1. Overman MJ, et al. 2017. Nivolumab in patients with metastatic DNA mismatch repair-deficient or microsatellite instability-high colorectal cancer (CheckMate 142): an open-label, multicentre, phase 2 study. Lancet Oncol. 18, 1182-1191. (10.1016/S1470-2045(17)30422-9) - DOI - PMC - PubMed
    1. Sun C, Mezzadra R, Schumacher TN. 2018. Regulation and function of the PD-L1 checkpoint. Immunity 48, 434-452. (10.1016/j.immuni.2018.03.014) - DOI - PMC - PubMed