. 2022 Aug;12(8):220149.
doi: 10.1098/rsob.220149. Epub 2022 Aug 10.

A genetic model for in vivo proximity labelling of the mammalian secretome

Affiliations

A genetic model for in vivo proximity labelling of the mammalian secretome

Rui Yang et al. Open Biol. 2022 Aug.

Abstract

Organ functions are highly specialized and interdependent. Secreted factors regulate organ development and mediate homeostasis through serum trafficking and inter-organ communication. Enzyme-catalysed proximity labelling enables the identification of proteins within a specific cellular compartment. Here, we report a BirA*G3 mouse strain that enables CRE-dependent promiscuous biotinylation of proteins trafficking through the endoplasmic reticulum. When broadly activated throughout the mouse, widespread labelling of proteins was observed within the secretory pathway. Streptavidin affinity purification and peptide mapping by quantitative mass spectrometry (MS) proteomics revealed organ-specific secretory profiles and serum trafficking. As expected, secretory proteomes were highly enriched for signal peptide-containing proteins, highlighting both conventional and non-conventional secretory processes, and ectodomain shedding. Lower-abundance proteins with hormone-like properties were recovered and validated using orthogonal approaches. Hepatocyte-specific activation of BirA*G3 highlighted liver-specific biotinylated secretome profiles. The BirA*G3 mouse model demonstrates enhanced labelling efficiency and tissue specificity over viral transduction approaches and will facilitate a deeper understanding of secretory protein interplay in development, and in healthy and diseased adult states.

Keywords: BirA; TurboID; inter-organ communication; proximity-labelling; secretome; serum proteins.


Conflict of interest statement

A.P.M. is a scientific adviser for Novartis, TRESTLE BioTherapeutics, eGENESIS and IVIVA Medical. S.A.C. is a member of the scientific advisory boards of Kymera, PTM BioLabs, Seer and PrognomIQ. A.Y.T. declares intellectual property interests around proximity labelling technology.

Figures
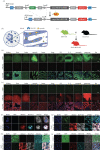
Figure 1.
Figure 1.
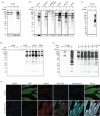
Generation and characterization of Sox2-BirA*G3 mice. (a) Schematic diagram shows CRE-mediated excision at loxP sites removes the GFP cassette resulting in production of BirA*G3-ER and mKate2 fluorescent protein. Adapted from Droujinine et al. [13]. (b) Schematic diagram shows that proteins that reside or travel through ER would be biotinylated by BirA*G3. (c) Schematic diagram of mouse mating to generate Sox2-BirA*G3 mice. All cells in control mice are expected to express GFP. All cells in Sox2-BirA*G3 mice are expected to express mKate2. Adapted from Droujinine et al. [13]. (d) Native GFP and native mKate2 fluorescence in whole-mount organs (scale bar: 2 mm) and tissue sections (scale bar: 50 µm) of control mice. S.I: small intestine. L.I: large intestine. (e) Native GFP and native mKate2 fluorescence in whole-mount organs (scale bar: 2 mm) and tissue sections (scale bar: 50 µm) of Sox2-BirA*G3 mice. (f) Immunofluorescence staining shows expression of native GFP, native mKate2, BirA*G3, and ER marker Calnexin in the cell culture of isolated mouse embryonic fibroblast (MEFs) from Sox2-BirA*G3 and control mice. Scale bar: 25 µm. (g) Immunofluorescence staining shows expression of native GFP, native mKate2, BirA*G3, and UMOD, which marks the thick ascending limb of Henle's loop (TALH), in the kidney sections of Sox2-BirA*G3 and control mice. Scale bar: 50 µm. (h) Immunofluorescence staining shows expression of native GFP, native mKate2, BirA*G3 and Albumin, a hepatocyte marker, in the liver sections of Sox2-BirA*G3 and control mice. Scale bar: 50 µm. (i) Immunofluorescence staining shows expression of native GFP, native mKate2, BirA*G3, and MAP2, a cortical neuron-specific protein, in the brain sections of Sox2-BirA*G3 and control mice. Scale bar: 50 µm. Unlike BirA*G3, mKate2 expression is not restricted to the ER, which may result in varied signal intensity due to differences in cell morphology.
Figure 2.
Figure 2.
Analysis of biotinylated proteins in Sox2-BirA*G3 and control mice. (a) Western blotting of protein lysates from brain in Sox2-BirA*G3 mice (CRE+) compared to control mice (CRE−) with or without biotin chow administration for 5 days. Upper: streptavidin labelling. Lower: BirA*G3 (approx. 35 kDa). Each lane is a biological replicate from individual mice (n = 2 per genotype). (b) Western blotting of protein lysates from selective tissues in Sox2-BirA*G3 mice compared to control mice. Note: due to varied streptavidin intensity by tissue, brain, heart, and muscle streptavidin westerns are shown with increased signal intensity. Upper: streptavidin labelling. Lower: BirA*G3 (approx. 35 kDa). Each lane is a biological replicate from individual mice (n = 1 per genotype). (c) Western blotting of serum total protein in Sox2-BirA*G3 mice compared to control mice (CRE−) with or without biotin chow administration for 5 days. Upper: streptavidin labelling. Lower: BirA*G3 (approx. 35 kDa). Each lane is a biological replicate from individual mice (n = 2 per genotype). (d) Streptavidin labelling of biotinylated proteins in total serum from Sox2-BirA*G3 and control mice administered with regular chow, biotin chow, biotin water or biotin chow and water for 7 days. Each lane is a biological replicate from individual mice (n = 2/biotin treatment). (e) Streptavidin labelling of affinity purified biotinylated proteins in serum from Sox2-BirA*G3 and control mice given biotin chow for 7 days (left) or given biotin by subcutaneous injection and water (5 mM, pH 7.4) after the injection until collection (right). (f) Immunofluorescence images of native GFP, native mKate2, BirA*G3 staining, streptavidin staining in cryo-sectioned muscle tissues from Sox2-BirA*G3 and control mice. Scale bar, 50 µm.
Figure 3.
Figure 3.
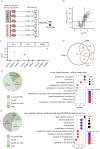
Identification of biotinylated proteins in Sox2-BirA*G3 liver, brain, and kidney tissues by mass spectrometry. (a) Representative schematic of TMT-based 6plex LC-MS/MS workflow for liver Sox2-BirA*G3 (n = 3) and control (n = 3) samples. The same 6plex LC-MS/MS design was used for brain and kidney for individual MS runs. (b) Volcano plots of proteins detected in liver of Sox2-BirA*G3 mice compared to control mice after streptavidin pulldown. Log2 FC were plotted on the x-axis and −10 log10 (p value) were plotted on the y-axis. Significantly enriched proteins (adj. p-value < 0.05 and log2FC > 1.0) in Sox2-BirA*G3 A mice compared to control mice are shown in green. (c) Relative abundance (log2FC) of representative proteins in liver, brain and kidney. ES are labelled for the abundant proteins in their corresponding tissues. (d) Venn diagram showed the overlap of enriched proteins (ES method) among liver, brain and kidney. (e) Shared enriched proteins among three tissues (113 proteins) were predicted with SignalP/TMH (left) and analysed with DAVID analysis for cellular components annotation (right). Gene ratio indicates the percentage of genes annotated with the term over the total number of genes in the list. (f) Liver-specific enriched proteins (115 proteins) predicted with SignalP/TMH were analysed with clusterProfiler (3.16.1) EnrichGO analysis. Left: a pie chart displayed the distribution of liver-specific proteins with SignalP/TMH prediction. Right: dot plots displayed the functional categorization of liver-specific enriched based on EnrichGO annotation, and the number of each category is displayed based on biological process. Gene ratio indicates the percentage of genes annotated with the term over the total number of genes in the list.
Figure 4.
Figure 4.
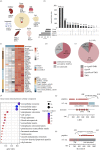
Analysis of biotinylated proteins secreted to peripheral blood. (a) Schematic of tissue secreted proteins identified by LC-MS/MS (6plex; Sox2-BirA*G3 n = 3, control n = 3) from affinity purified serum from Sox2-BirA*G3 mice. (b) Upset plot showed the overlap of enriched proteins among serum, liver, brain and kidney. (c) Heatmap of representative proteins enriched in Sox2-BirA*G3 serum relative to controls. Log2 expression values are shown by colour and intensity of shading. Grey, low; red, high. (d) Pie chart displayed the number of shared enriched proteins between serum and three tissues (220 proteins) that are annotated as secreted by UniProt/NCBI. (e) Pie chart displayed the distribution of shared enriched proteins between serum and three tissues (220 proteins) with predicted SignalP/TMH. (f) Shared enriched proteins between serum and three tissues were analysed with DAVID analysis for cellular component annotation. Gene ratio indicates the percentage of genes annotated with the term over the total number of genes in the list. (g) Schematic of detected peptides for LIFR mapped onto its respective reference sequences with SMART protein domain annotation. Reference sequence is annotated with extracellular, transmembrane (TM) and cytoplasmic based on UniProt topology information. Amino acid sequences of the most C-terminal peptide are labelled. FN3: fibronectin type 3. (h) Schematic of detected peptides for Slc38a10 mapped onto its respective reference sequences. Reference sequence is annotated with TM based on UniProt topology information. Amino acid sequences of the most N-terminal peptide are labelled.
Figure 5.
Figure 5.
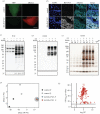
Generation and characterization of Alb-BirA*G3 mice. (a) Whole mount images of native GFP and mKate2 fluorescence in livers of Alb-BirA*G3 and control mice. Scale bar: 3 mm. (b) Immunofluorescence staining shows expression of BirA*G3 and hepatocyte marker Albumin in the liver sections from Alb-BirA*G3 and control mice. Scale bar: 50 µm. (c,d) Western blotting of total protein from (c) liver and (d) serum in Alb-BirA*G3 mice compared to control mice. Upper: Streptavidin labelling. Lower: BirA*G3 (approx. 35 kDa). Each lane is a biological replicate from individual mice (n = 3 per genotype). (e) Silver stain of affinity purified biotinylated proteins from serum in Alb-BirA*G3 mice compared to control mice. Each lane is a biological replicate from individual mice (n = 4 per genotype). (f) PCA of streptavidin-purified serum proteins from Alb-BirA*G3 and control mice. Each dot represents a sample, which is coloured by the annotation of mouse genotype and sex. Alb-BirA*G3 samples are manually circled by grey shadow. (g) Volcano plots of proteins detected in serum of Alb-BirA*G3 mice compared to control mice after streptavidin pulldown in mass spectrometry. Log2 FC were plotted on the x-axis and −10 log10 (p value) were plotted on the y-axis. Significantly enriched proteins (adj. p-value <0.05 and log2FC > 1) in Alb-BirA*G3 mice compared to control mice are shown in red.
Figure 6.
Figure 6.
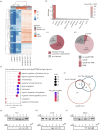
Analysis of hepatocyte-secreted serum proteins in Alb-BirA*G3 mice. (a) Cluster heatmap of proteins enriched in Alb-BirA*G3 serum relative to controls. Log2 expression values are shown by colour and intensity of shading. Blue, low; red, high. Serum-enriched proteins in the Alb-BirA*G3 group are highlighted in black colour in the hierarchical clustering. (b) Enriched proteins in Alb-BirA*G3 serum were analysed with TissueEnrich to calculate tissue-specific gene enrichment. (c) Pie chart displayed the number of enriched proteins in Alb-BirA*G3 serum that are annotated as secreted by UniProt/NCBI. (d) Pie chart displayed the distribution of enriched proteins in Alb-BirA*G3 serum with predicted SignalP/TMH. (e) Enriched proteins in Alb-BirA*G3 serum predicted with SignalP/TMH were analysed with clusterProfiler (3.16.1) EnrichGO analysis for biological process. Gene ratio indicates the percentage of genes annotated with the term over the total number of genes in the list. (f) Area-proportional venn diagram showed the overlap among enriched proteins in Alb-BirA*G3 serum, AAV-Tgb-ER-TurboID plasma [15], and Sec61-TurboID plasma [14]. (g–i) AGT levels in total protein lysates (upper) and affinity purified biotinylated proteins (lower) from liver (f), serum (g) and kidney (h) in Alb-BirA*G3 mice compared to control mice. Input: 500 µg proteins. Bead lanes are affinity purification negative control without protein input. Each lane is a biological replicate from individual mice (n = 3 per genotype).

References

    1. Mitchell KJ, et al. 2001. Functional analysis of secreted and transmembrane proteins critical to mouse development. Nat. Genet. 28, 241-249. (10.1038/90074) - DOI - PubMed
    1. Kotas ME, Medzhitov R. 2015. Homeostasis, inflammation, and disease susceptibility. Cell 160, 816-827. (10.1016/j.cell.2015.02.010) - DOI - PMC - PubMed
    1. Anbazhagan R, Kavarthapu R, Mathur PP, Kostic TS, Prakash H. 2021. Editorial: Systemic regulation of organ homeostasis and implications of hormones and immunity. Front. Endocrinol. (Lausanne) 12, 740835. (10.3389/fendo.2021.740835) - DOI - PMC - PubMed
    1. Uhlén M, et al. 2019. The human secretome. Sci. Signal. 12, eaaz0274. (10.1126/scisignal.aaz0274) - DOI - PubMed
    1. Basu RK, Wheeler DS. 2013. Kidney-lung cross-talk and acute kidney injury. Pediatr. Nephrol. 28, 2239-2248. (10.1007/s00467-012-2386-3) - DOI - PMC - PubMed

Publication types