

Stardust: improving spatial transcriptomics data analysis through space-aware modularity optimization-based clustering
- PMID: 35946989
- PMCID: PMC9364686
- DOI: 10.1093/gigascience/giac075
Stardust: improving spatial transcriptomics data analysis through space-aware modularity optimization-based clustering
Abstract
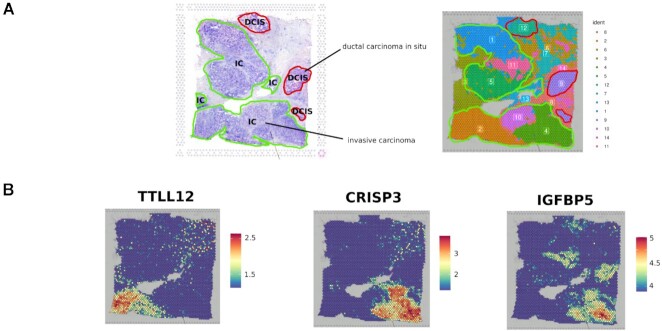
Background: Spatial transcriptomics (ST) combines stained tissue images with spatially resolved high-throughput RNA sequencing. The spatial transcriptomic analysis includes challenging tasks like clustering, where a partition among data points (spots) is defined by means of a similarity measure. Improving clustering results is a key factor as clustering affects subsequent downstream analysis. State-of-the-art approaches group data by taking into account transcriptional similarity and some by exploiting spatial information as well. However, it is not yet clear how much the spatial information combined with transcriptomics improves the clustering result.
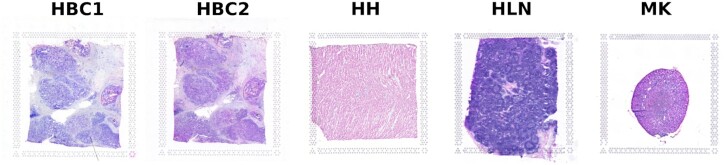
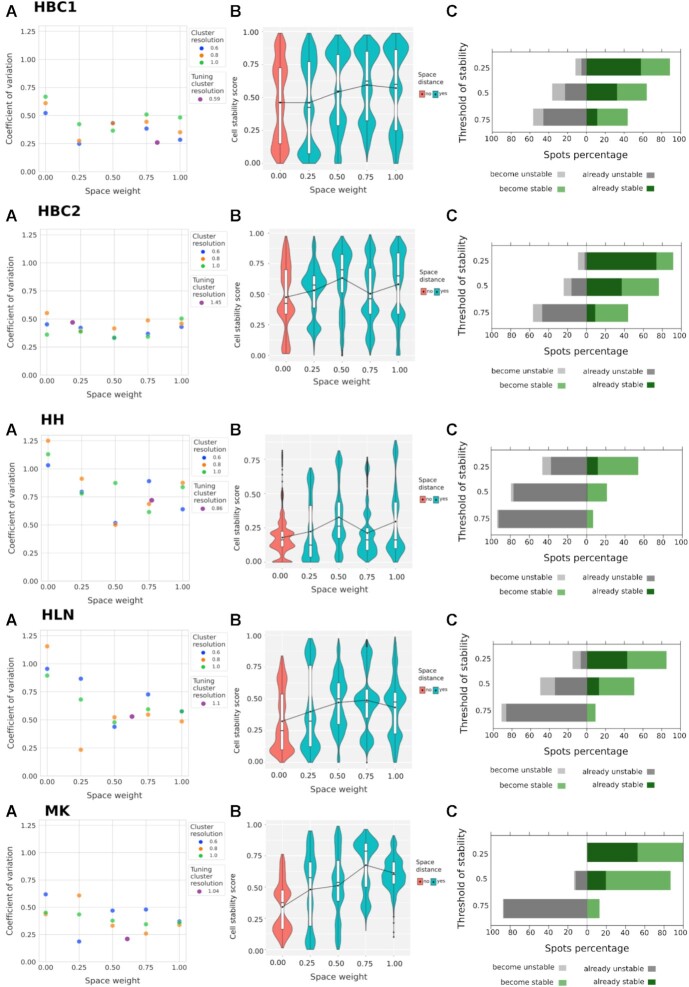
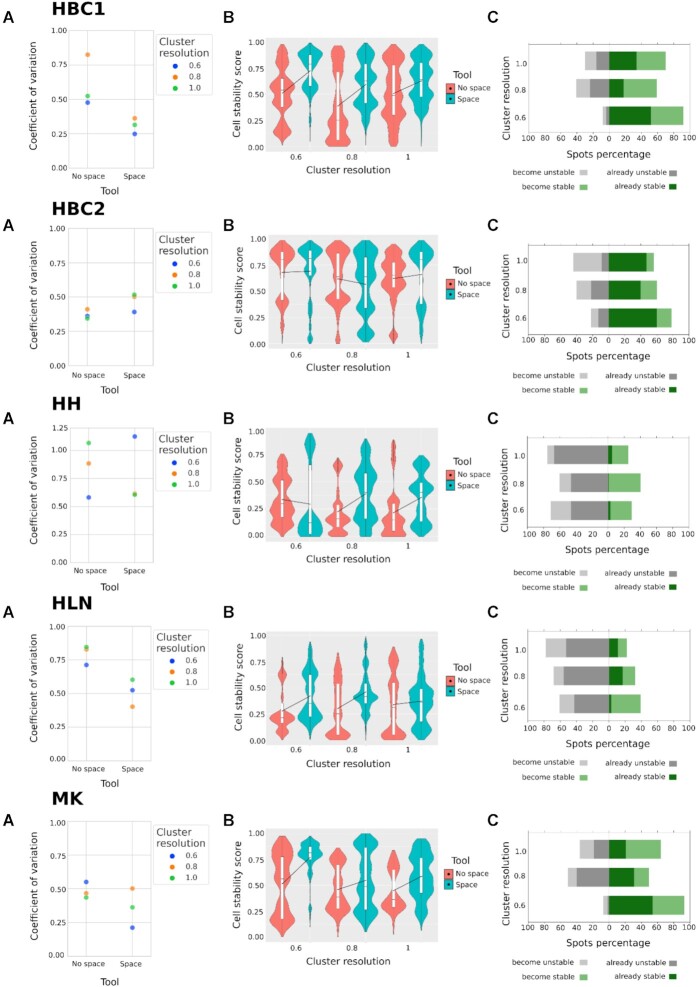
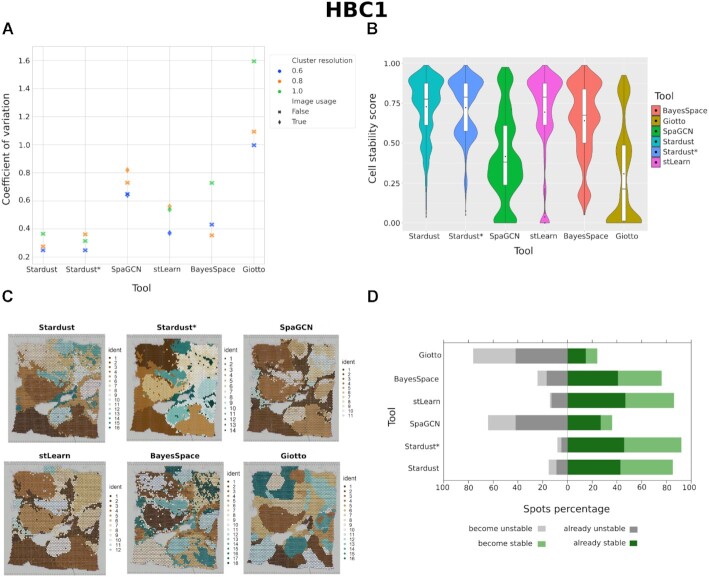
Results: We propose a new clustering method, Stardust, that easily exploits the combination of space and transcriptomic information in the clustering procedure through a manual or fully automatic tuning of algorithm parameters. Moreover, a parameter-free version of the method is also provided where the spatial contribution depends dynamically on the expression distances distribution in the space. We evaluated the proposed methods results by analyzing ST data sets available on the 10x Genomics website and comparing clustering performances with state-of-the-art approaches by measuring the spots' stability in the clusters and their biological coherence. Stability is defined by the tendency of each point to remain clustered with the same neighbors when perturbations are applied.
Conclusions: Stardust is an easy-to-use methodology allowing to define how much spatial information should influence clustering on different tissues and achieving more stable results than state-of-the-art approaches.
Keywords: clustering; spatial transcriptomics analysis; stability scores, parameters tuning, software comparison.
© The Author(s) 2022. Published by Oxford University Press GigaScience.
Figures
Similar articles
-
STGNNks: Identifying cell types in spatial transcriptomics data based on graph neural network, denoising auto-encoder, and k-sums clustering.Comput Biol Med. 2023 Nov;166:107440. doi: 10.1016/j.compbiomed.2023.107440. Epub 2023 Sep 9. Comput Biol Med. 2023. PMID: 37738898
-
STCC enhances spatial domain detection through consensus clustering of spatial transcriptomics data.Genome Res. 2025 Jun 2;35(6):1415-1428. doi: 10.1101/gr.280031.124. Genome Res. 2025. PMID: 40355284
-
BFAST: joint dimension reduction and spatial clustering with Bayesian factor analysis for zero-inflated spatial transcriptomics data.Brief Bioinform. 2024 Sep 23;25(6):bbae594. doi: 10.1093/bib/bbae594. Brief Bioinform. 2024. PMID: 39552067 Free PMC article.
-
Computational solutions for spatial transcriptomics.Comput Struct Biotechnol J. 2022 Sep 1;20:4870-4884. doi: 10.1016/j.csbj.2022.08.043. eCollection 2022. Comput Struct Biotechnol J. 2022. PMID: 36147664 Free PMC article. Review.
-
Novel insights from spatial transcriptome analysis in solid tumors.Int J Biol Sci. 2023 Sep 4;19(15):4778-4792. doi: 10.7150/ijbs.83098. eCollection 2023. Int J Biol Sci. 2023. PMID: 37781515 Free PMC article. Review.
Cited by
-
A comprehensive overview of graph neural network-based approaches to clustering for spatial transcriptomics.Comput Struct Biotechnol J. 2023 Nov 30;23:106-128. doi: 10.1016/j.csbj.2023.11.055. eCollection 2024 Dec. Comput Struct Biotechnol J. 2023. PMID: 38089467 Free PMC article. Review.
-
Deciphering progressive lesion areas in breast cancer spatial transcriptomics via TGR-NMF.Brief Bioinform. 2024 Nov 22;26(1):bbae707. doi: 10.1093/bib/bbae707. Brief Bioinform. 2024. PMID: 39780487 Free PMC article.
-
Deep clustering representation of spatially resolved transcriptomics data using multi-view variational graph auto-encoders with consensus clustering.Comput Struct Biotechnol J. 2024 Dec 2;23:4369-4383. doi: 10.1016/j.csbj.2024.11.041. eCollection 2024 Dec. Comput Struct Biotechnol J. 2024. PMID: 39717398 Free PMC article.
-
AFSC: A self-supervised augmentation-free spatial clustering method based on contrastive learning for identifying spatial domains.Comput Struct Biotechnol J. 2024 Sep 10;23:3358-3367. doi: 10.1016/j.csbj.2024.09.005. eCollection 2024 Dec. Comput Struct Biotechnol J. 2024. PMID: 39310278 Free PMC article.
-
Machine Learning for Uncovering Biological Insights in Spatial Transcriptomics Data.ArXiv [Preprint]. 2023 Mar 29:arXiv:2303.16725v1. ArXiv. 2023. PMID: 37033464 Free PMC article. Preprint.
References
-
- Buettner F, Natarajan KN, Casale FP, et al. Computational analysis of cell-to-cell heterogeneity in single-cell RNA-sequencing data reveals hidden subpopulations of cells. Nat Biotechnol. 2015;33(2):155–60. - PubMed
-
- Lewis SM, Asselin-Labat ML, Nguyen Q, et al. Spatial omics and multiplexed imaging to explore cancer biology. Nat Methods. 2021;18(9):1–16. - PubMed
-
- Ståhl PL, Salmén F, Vickovic S, et al. Visualization and analysis of gene expression in tissue sections by spatial transcriptomics. Science. 2016;353(6294):78–82. - PubMed
-
- Asp M, Bergenstråhle J, Lundeberg J. Spatially resolved transcriptomes—next generation tools for tissue exploration. Bioessays. 2020;42(10):1900221. - PubMed
-
- Marx V. Method of the year: spatially resolved transcriptomics. Nat Methods. 2021;18(1):9–14. - PubMed
MeSH terms
LinkOut - more resources
Full Text Sources
