. 2022 Sep;36(9):e22482.
doi: 10.1096/fj.202101398R.

Hepatic circadian and differentiation factors control liver susceptibility for fatty liver disease and tumorigenesis

Affiliations

Hepatic circadian and differentiation factors control liver susceptibility for fatty liver disease and tumorigenesis

Baharan Fekry et al. FASEB J. 2022 Sep.

Abstract

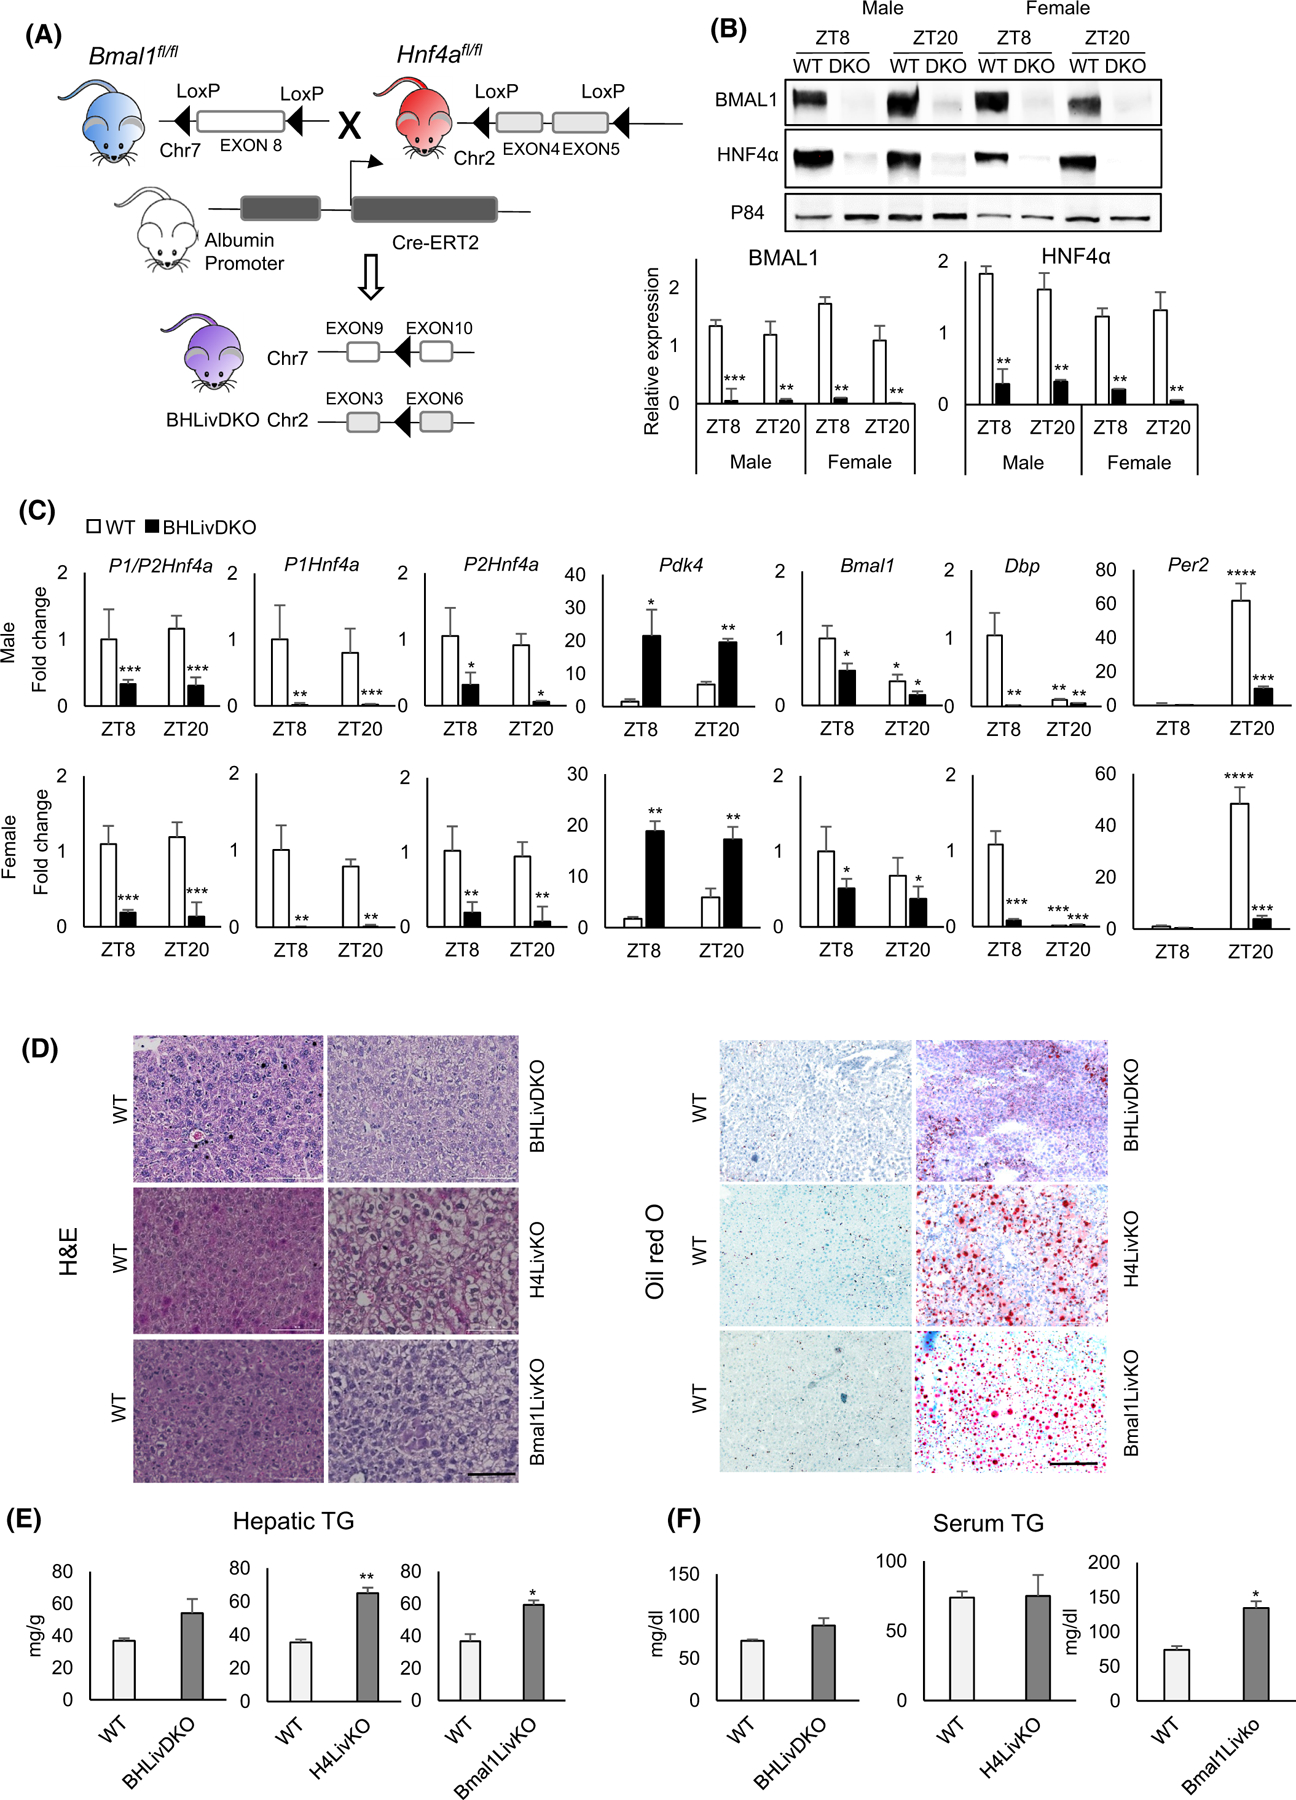
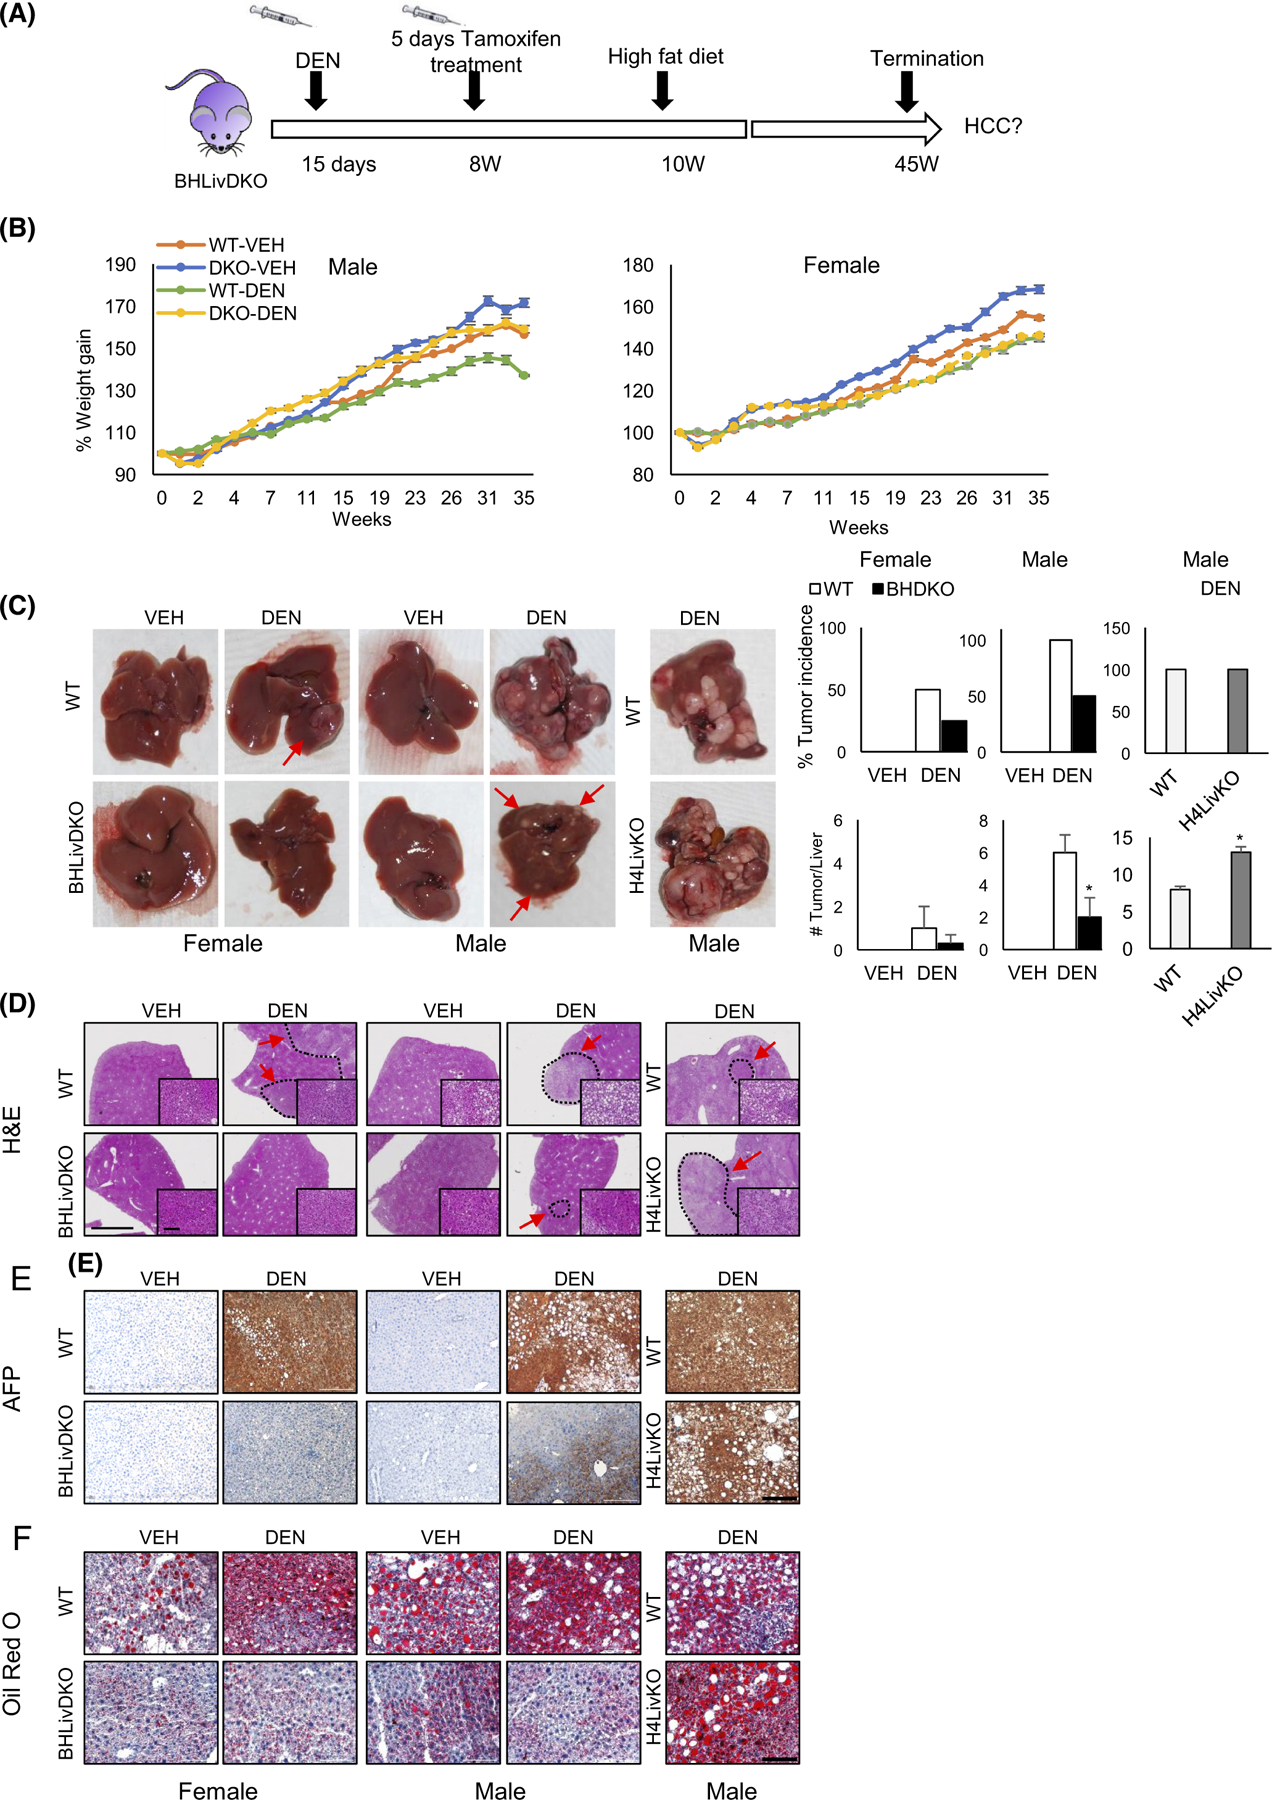
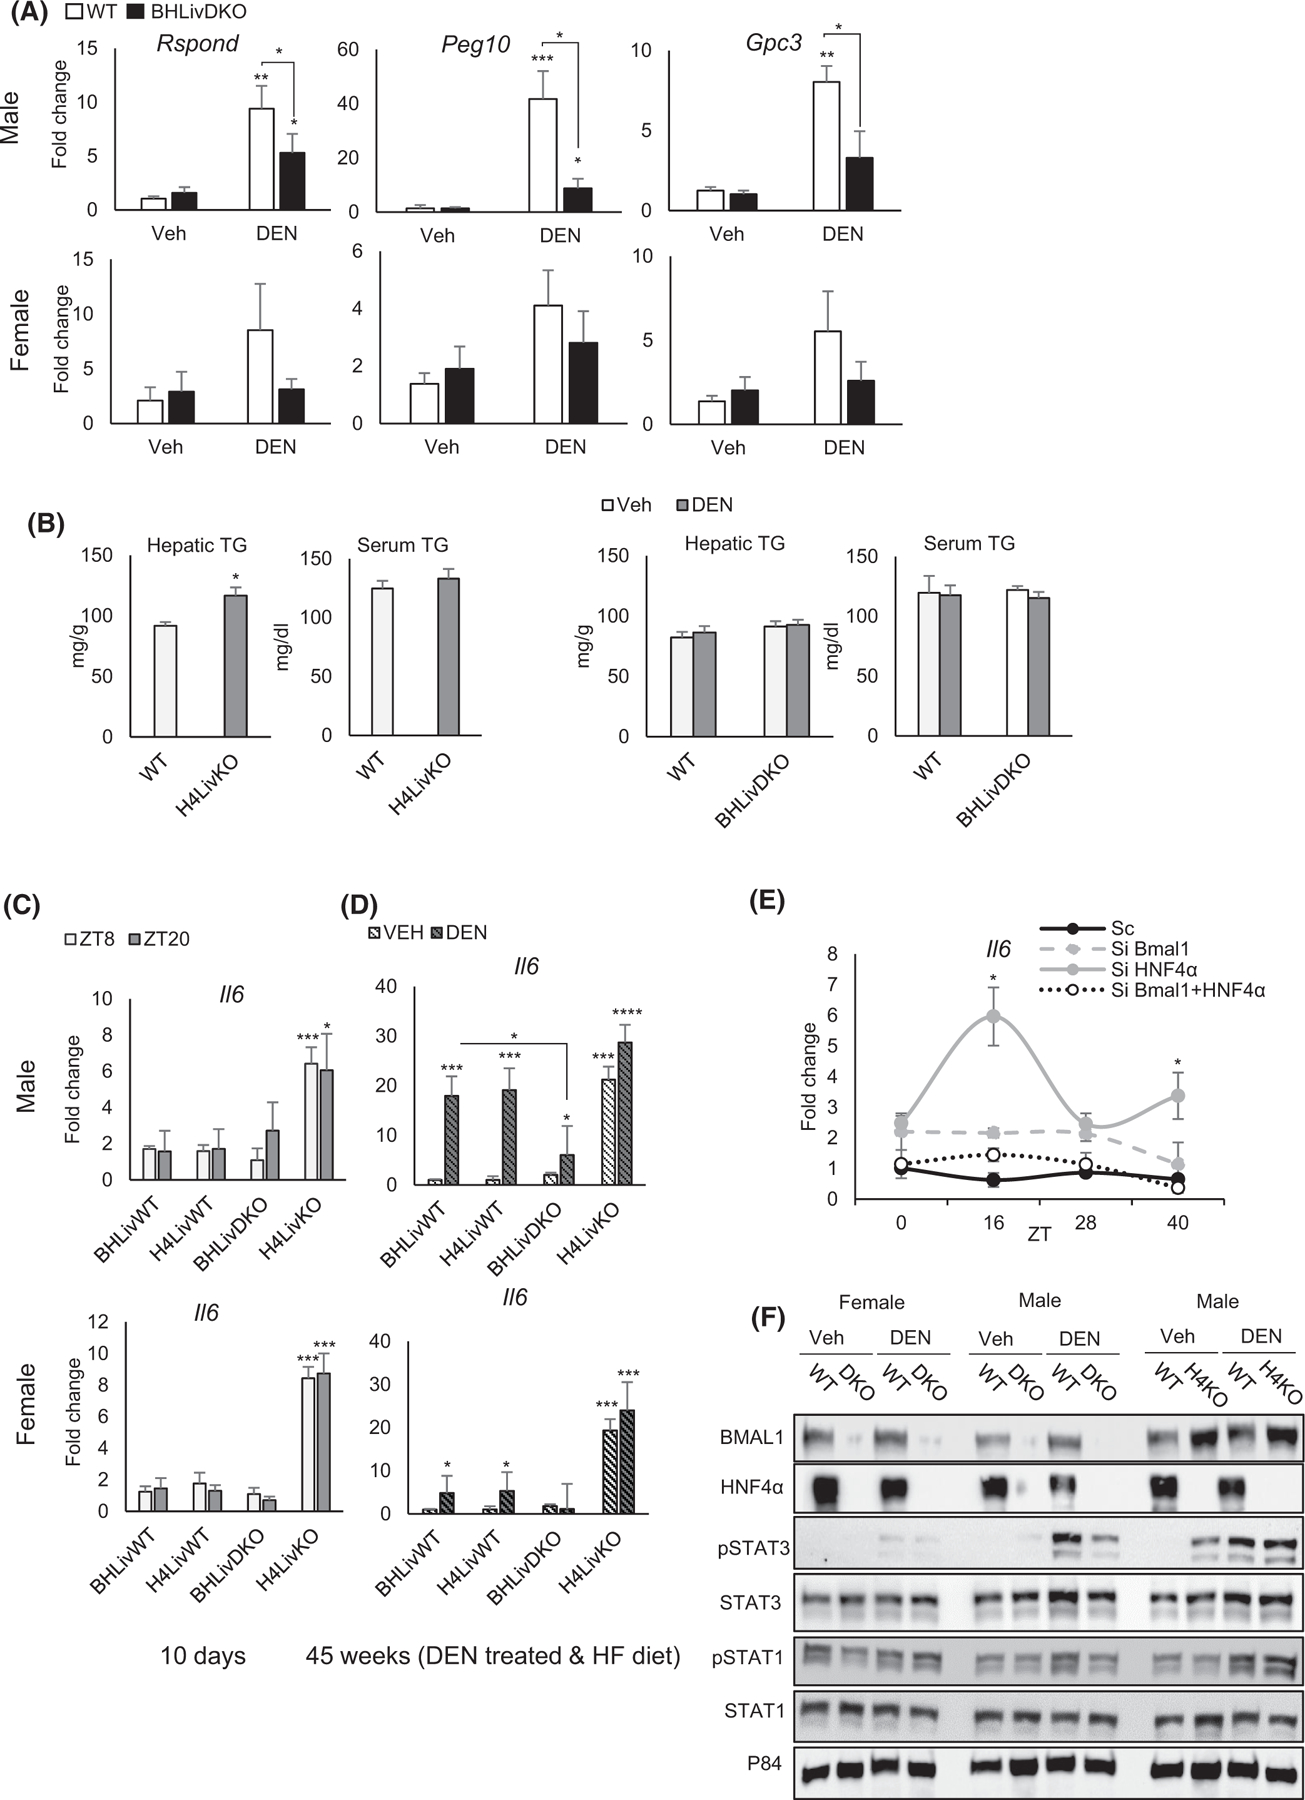
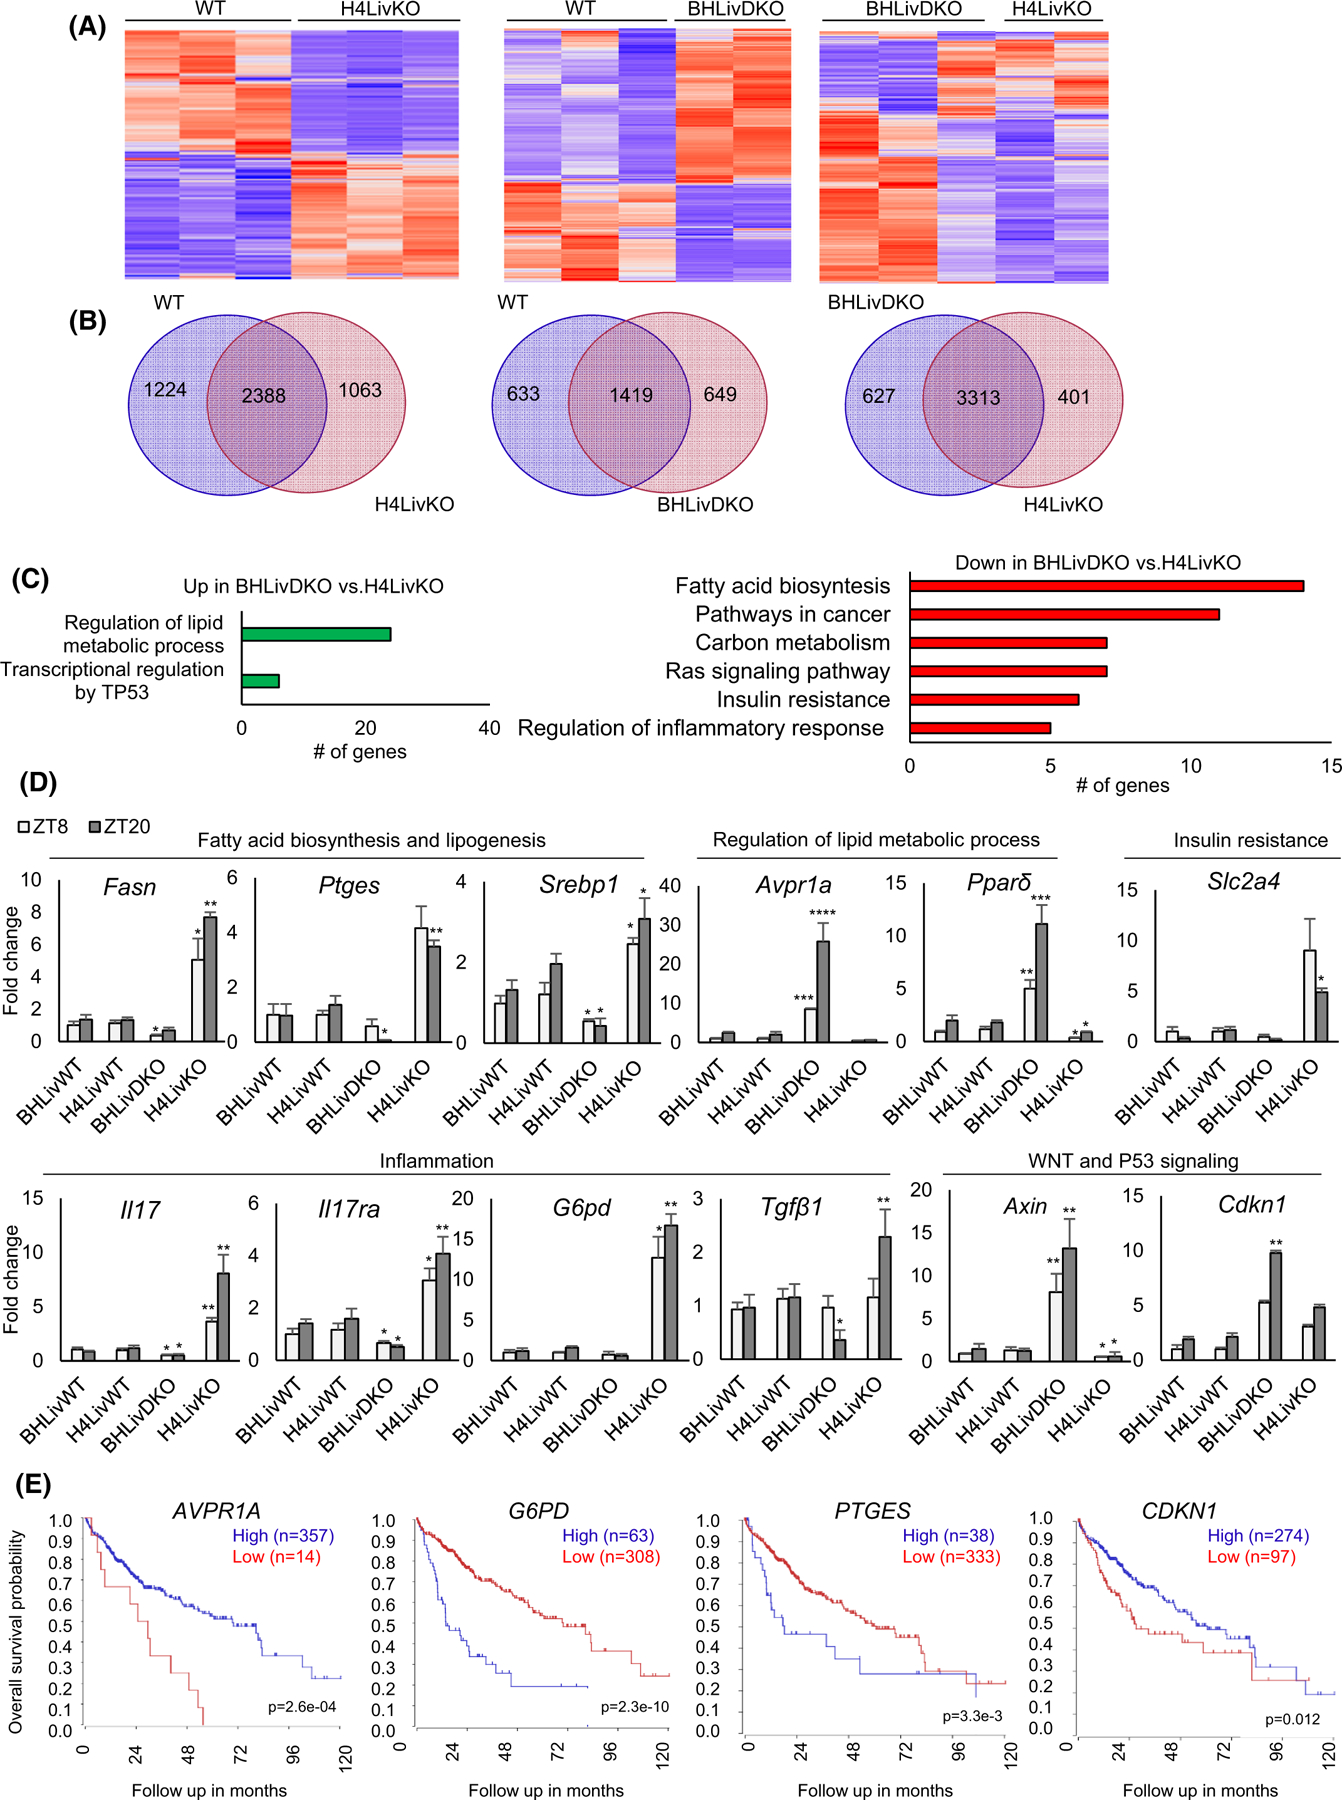
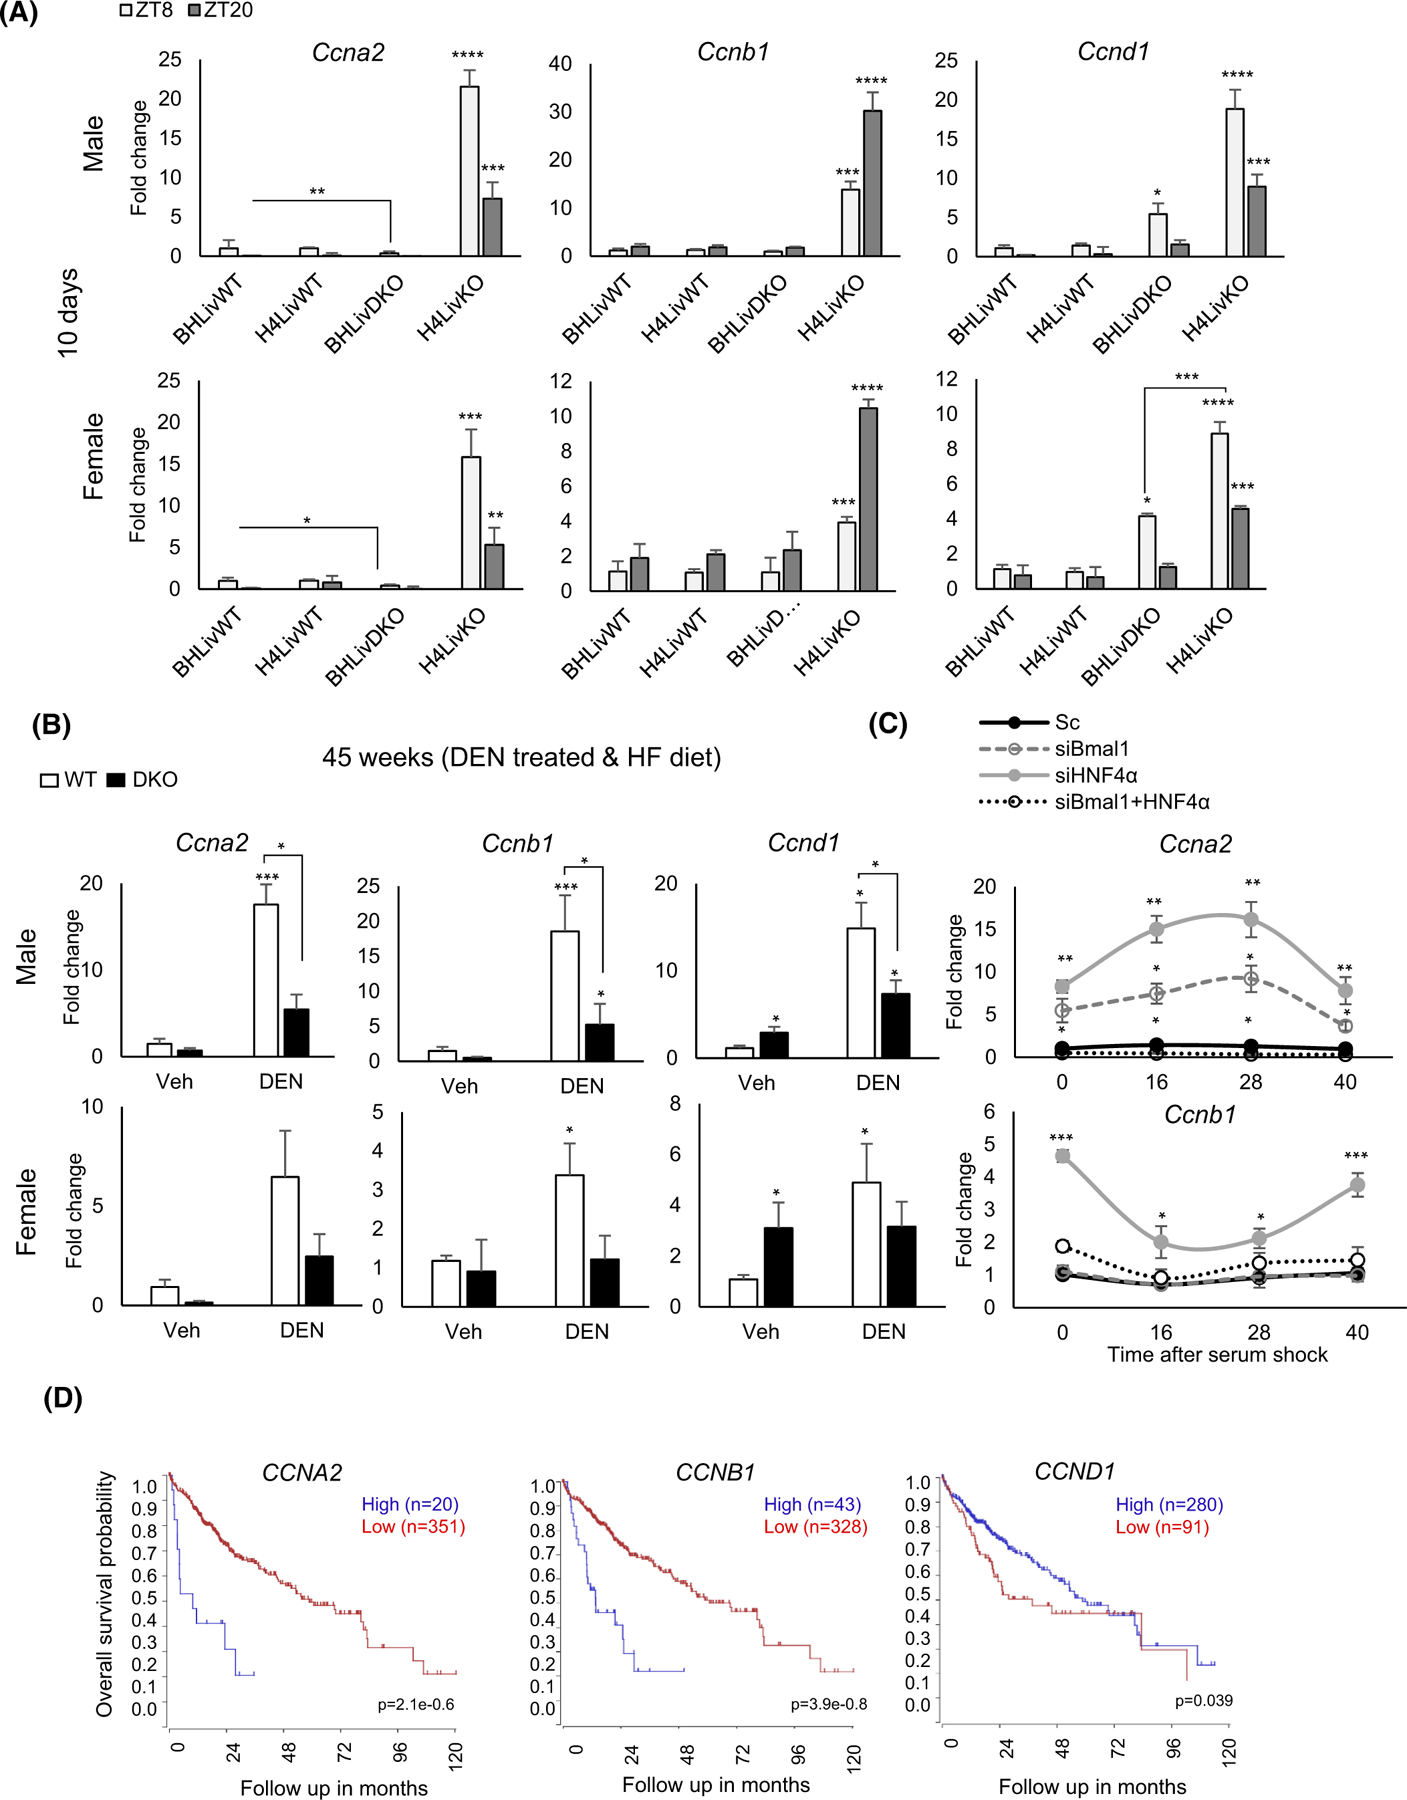
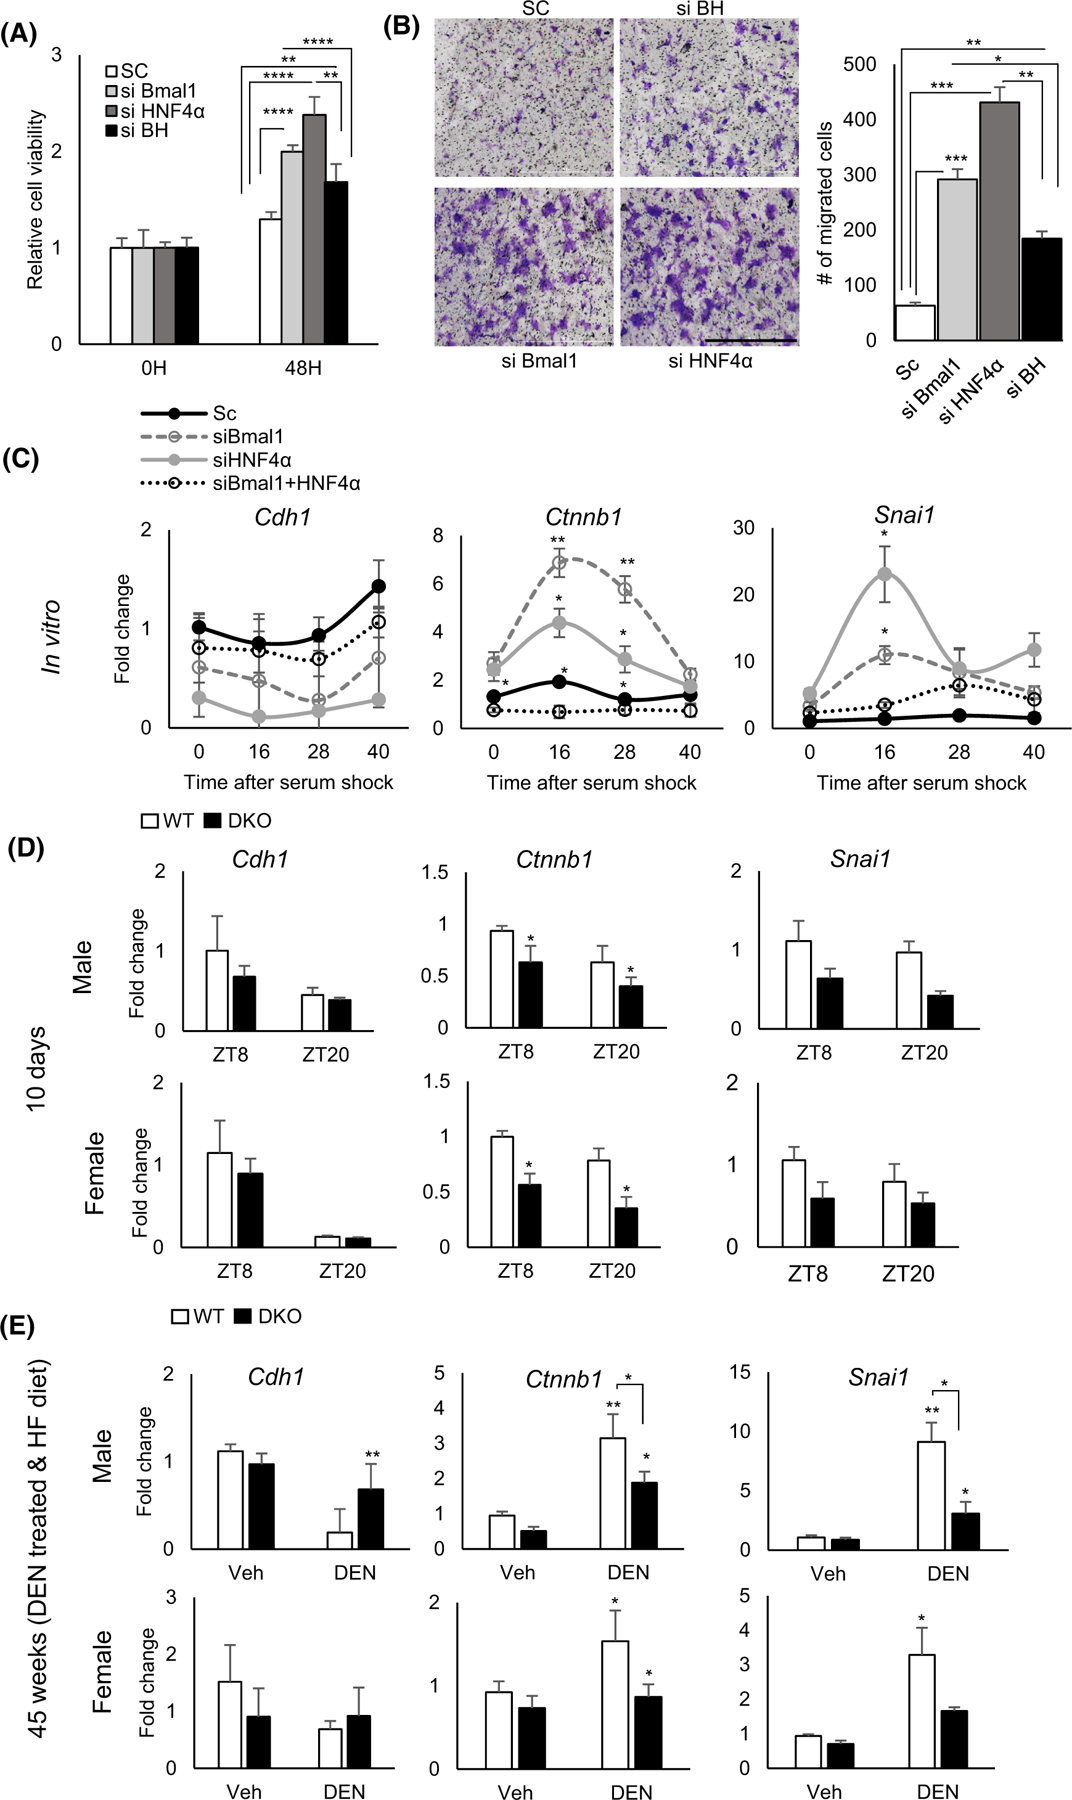
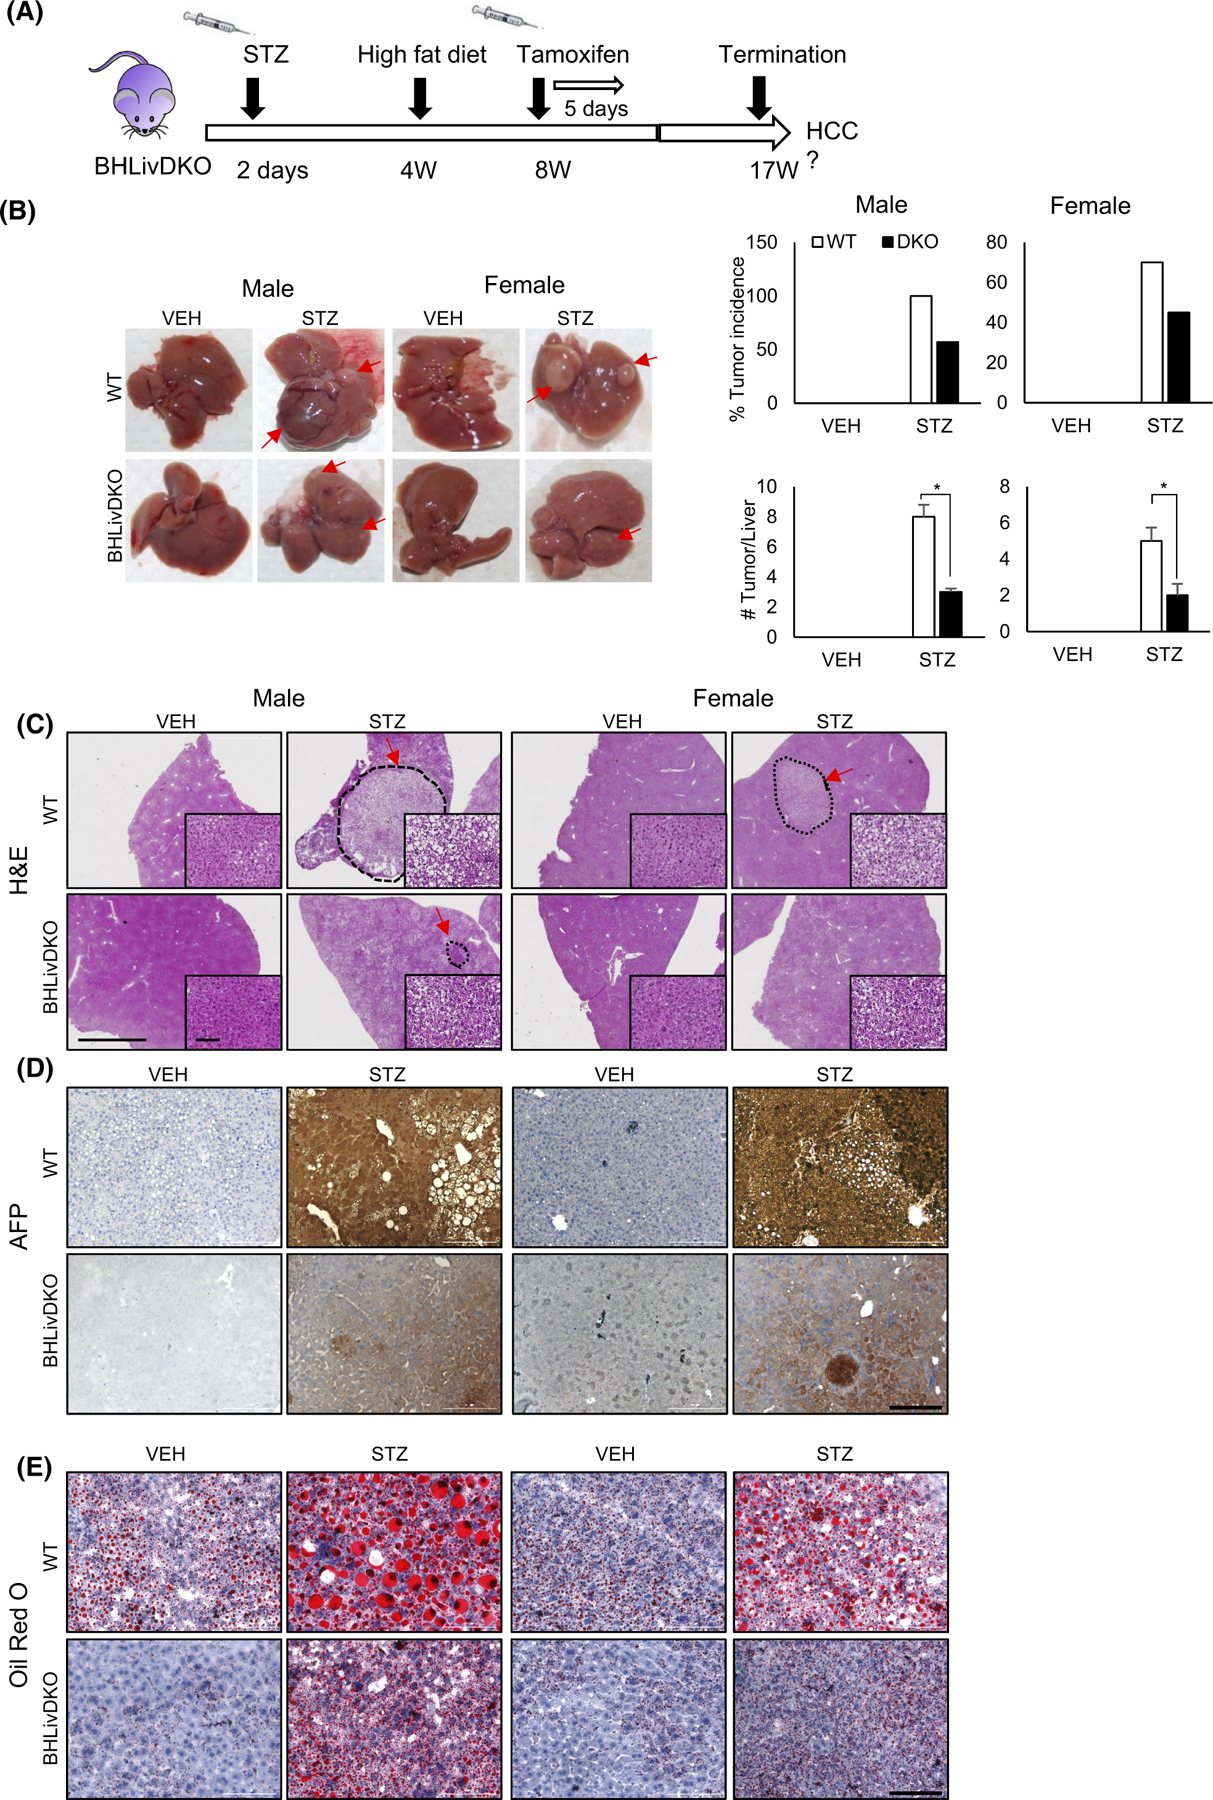
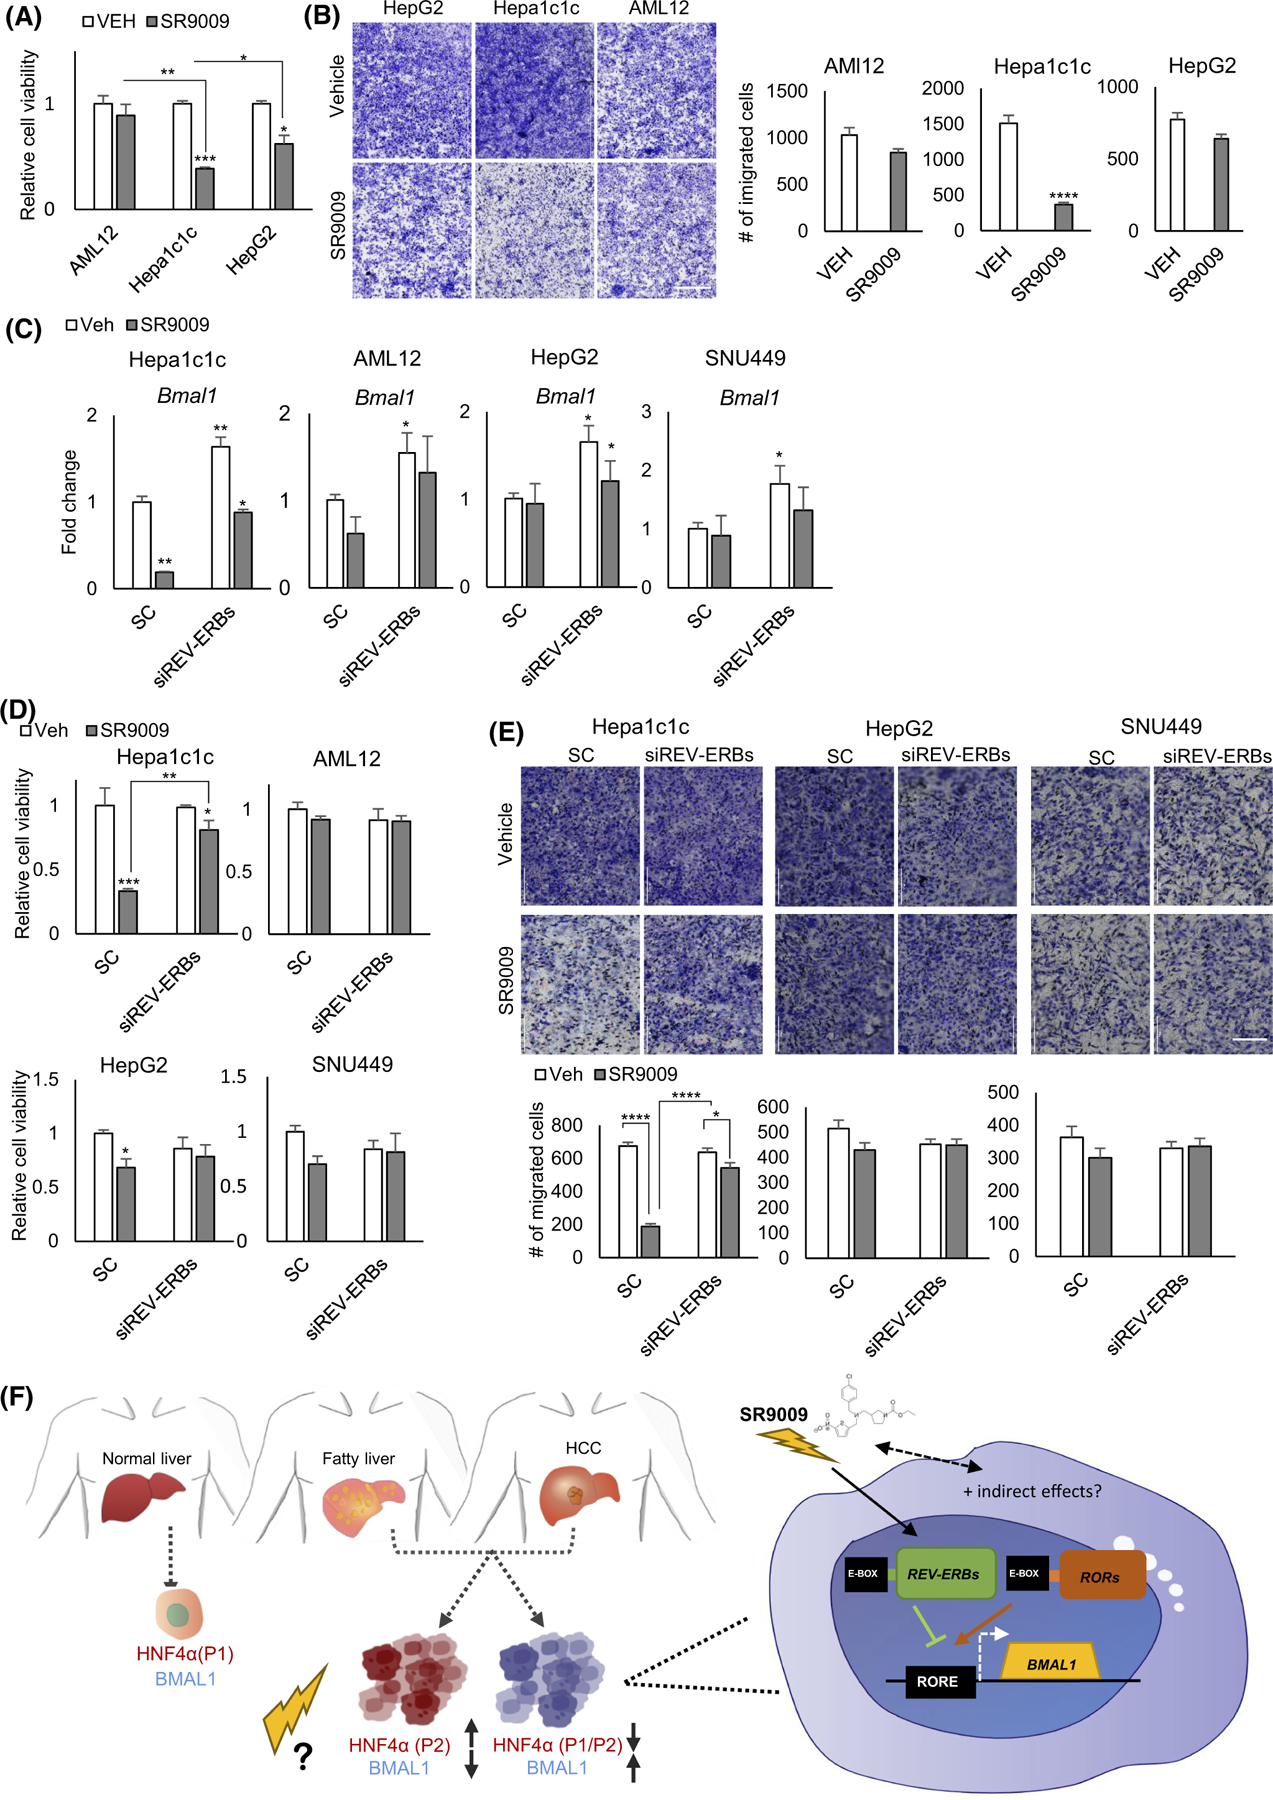
Hepatocellular carcinoma (HCC) is a leading cause of cancer deaths, and the most common primary liver malignancy to present in the clinic. With the exception of liver transplant, treatment options for advanced HCC are limited, but improved tumor stratification could open the door to new treatment options. Previously, we demonstrated that the circadian regulator Aryl Hydrocarbon-Like Receptor Like 1 (ARNTL, or Bmal1) and the liver-enriched nuclear factor 4 alpha (HNF4α) are robustly co-expressed in healthy liver but incompatible in the context of HCC. Faulty circadian expression of HNF4α- either by isoform switching, or loss of expression- results in an increased risk for HCC, while BMAL1 gain-of-function in HNF4α-positive HCC results in apoptosis and tumor regression. We hypothesize that the transcriptional programs of HNF4α and BMAL1 are antagonistic in liver disease and HCC. Here, we study this antagonism by generating a mouse model with inducible loss of hepatic HNF4α and BMAL1 expression. The results reveal that simultaneous loss of HNF4α and BMAL1 is protective against fatty liver and HCC in carcinogen-induced liver injury and in the "STAM" model of liver disease. Furthermore, our results suggest that targeting Bmal1 expression in the absence of HNF4α inhibits HCC growth and progression. Specifically, pharmacological suppression of Bmal1 in HNF4α-deficient, BMAL1-positive HCC with REV-ERB agonist SR9009 impairs tumor cell proliferation and migration in a REV-ERB-dependent manner, while having no effect on healthy hepatocytes. Collectively, our results suggest that stratification of HCC based on HNF4α and BMAL1 expression may provide a new perspective on HCC properties and potential targeted therapeutics.

Keywords: BMAL1; HCC; HNF4α; SR9009; circadian; hepatocellular carcinoma.


Conflict of interest statement

DISCLOSURES

The authors declare no potential conflicts of interest.

Figures

FIGURE 1
FIGURE 1
Loss of hepatic BMAL1 and HNF4α is protective against ectopic lipid deposition in the liver. (A) Mouse model of the hepatic Bmal1 and Hnf4a inducible double knockout (BHLivDKO). (B) Western blot of BMAL1 and HNF4α in the liver of BHLivDKO mice 10 days post-tamoxifen injection. Quantification of the immunoblots normalized to P84 (bottom panels). Student’s t-test. **P ≤ 0.01; ***P ≤ 0.001. (C) Hepatic gene expression in WT and BHLivDKO measured by qPCR. Two-way ANOVA, Sidak’s multiple comparisons test (N = 6–8): *p < .03; **p < .005; ***p < .0005. (D) H&E (left panel) and Oil Red O (right panel) staining of WT, BHLivDKO, H4LivKO and Bmal1LivKO (Scale bar = 100 μm). (E and F) Hepatic (E) and serum (F) triglyceride levels in WT, BHLivDKO and H4LivKO mice. Significance (p < 0.05) was determined by Mann–Whitney U-test.
FIGURE 2
FIGURE 2
Mice with hepatic BMAL1and HNF4α deficiency are less prone to develop hepatocellular carcinoma (HCC). (A) Experimental timeline for carcinogen (DEN)-induced HCC in WT and BHLivKO mice. (B) Body weights of WT and BHLivDKO mice fed high fat diet (HFD) for 35 weeks with VEH versus DEN treatment. (C) Whole livers taken from mice fed HFD following VEH or DEN injection, left panel. Percent tumor incidence and the number of tumors per liver per animal group (right panel). Two-way ANOVA, Sidak’s multiple comparisons test (N = 8–12): *p < .03. (D–F) H&E (D), AFP (E), and Oil-Red O (F) staining of WT and BHLivDKO, and H4LivKO mouse livers after VEH or DEN injection and after 35 weeks of HFD. (Scale bar = 2000 μm, magnified scale bar = 100 μm, 200 μm).
FIGURE 3
FIGURE 3
Loss of hepatic BMAL1 and HNF4α protects against high fat diet-induced hepatocellular carcinoma (HCC). (A) Expression of HCC-specific genes in the livers of WT and BHLivDKO mice as measured by qPCR. (B) Hepatic and serum triglyceride levels in the WT, H4LivKO and BHLivKO mice following VEH or DEN administration and 35 weeks of HFD feeding. (C and D) RT-PCR reveals mRNA abundance of Il6 in WT and BHLivDKO mice 10 days after tamoxifen treatment (C) and 45 weeks after DEN plus HFD (D). (E) qPCR reveals expression of Il6 following Hnf4α and Bmal1 siRNA or scrambled control treatment. Two-way ANOVA, Sidak’s multiple comparisons test (N = 6–10):*p < .03; **p < .005; ***p < .0005, ****p < .0001. (F) Western blot of whole cell liver lysates from WT, BHLivDKO and H4LivKO mice fed with HFD following VEH/DEN injections, using antibodies to STAT1, STAT3, total STAT protein, and P84. Two-way ANOVA, Sidak’s multiple comparisons test (N = 8–12): *p < .03; **p < .005; ***p < .0005, ****p < .0001.
FIGURE 4
FIGURE 4
Dual loss of BMAL1and HNF4α alters the expression of genes involved in lipogenesis and cancer progression. (A) Heat maps of RNA-seq data reveal changes in gene expression of the top 5% of genes expressed between WT versus H4LivKO, WT versus BHLivDKO and H4LivKO versus BHLivDKO mice. (B) Venn diagrams for the total number of differentially expressed genes between WT versus H4LivKO, WT versus BHLivDKO and H4LivKO versus BHLivDKO genotypes. (C). Gene annotation of altered genes in BHLivDKO versus H4LivKO mice shows pathways both upregulated (red) or downregulated (green) in the BHLivDKO. (D) RT-PCR reveals altered expression of genes involved in lipid metabolism, inflammation, and inhibition of WNT/β-catenin signaling. Two-way ANOVA, Sidak’s multiple comparisons test (N = 6–8): *p < .03; **p < .005; ***p < .0005, ****p < .0001. (E) Kaplan–Meier survival curves of patients with HCC separated according to AVPR1A, G6P, PTGES and CDKN1 gene expression using the tumor liver hepatocellular carcinoma (TCGA) LIHC dataset in the R2 Genomics Analysis and Visualization Platform (http://r2.amc.nl). Survival time measured from the time of initial diagnosis to the date of death or the date of last follow up. The survival distribution estimated by Kapan–Meier method. p-values <.05 were considered to be statistically significant.
FIGURE 5
FIGURE 5
Expression of cyclin genes is significantly reduced in BHLivDKO mice compared to H4LivKO mice. (A) qPCR analysis shows expression of cyclin genes Ccnd1, Ccnb1 and Ccna2 10 days post-tamoxifen injection. Two-way ANOVA, Sidak’s multiple comparisons test (N = 6–8): *p < .03; **p < .005; ***p < .0005, ****p < .0001. (B) qPCR analysis of cyclin genes after DEN and HFD treatment, Two-way ANOVA, Sidak’s multiple comparisons test (N = 8–12): *p < .03; ***p < .0005. (C) Cyclin A2 (Ccna2) expression in Aml12 cells following knockdown of Bmal1, Hnf4α, or both Bmal1 and Hnf4α using siRNA at 0,16, 20, and 40 h post-serum shock. Scrambled oligonucleotide (Sc) was used as a control. Two-way ANOVA, Sidak’s multiple comparisons test (N = 10): *p < .03; **p < .005; ***p < .0005, ****p < .0001. (D) Survival curves show CCNA2, CCNB1, CCND1 genes expression using the tumor liver hepatocellular carcinoma (TCGA) LIHC dataset using the R2 Genomics Analysis and Visualization Platform (http://r2.amc.nl). Survival time measured from the time of initial diagnosis to the date of death or the date of last follow up. The survival distribution estimated by Kaplan–Meier method. p-values <.05 were considered to be statistically significant.
FIGURE 6
FIGURE 6
The Epithelial–Mesenchyme Transition (EMT) is impaired by dual loss of BMAL1 and HNF4α in the liver. (A) Fold change in proliferating Aml12 cells following HNF4α, Bmal1 or both Bmal1 and HNF4α knockdown using siRNA or scrambled control at 48 hr using MTT assay. (B) Migrated Aml12 cells following Hnf4α, Bmal1 or both Bmal1 and Hnf4α knockdown using siRNA or scrambled control. Quantification, left panel. (Scale bar = 1000 μm, N = 8). (C) qPCR reveals expression of EMT-related genes. in synchronized cells following Hnf4α, Bmal1 or both Bmal1 and Hnf4α using siRNA or scrambled control Two-way ANOVA, Sidak’s multiple comparisons test (N = 6–10): *p < .03; **p < .005; ***p < .0005, ****p < .0001 (D and E) Expression of EMT-related genes in BHLivDKO livers 10 days post tamoxifen injection (D) (Two-way ANOVA, Sidak’s multiple comparisons test [N = 6–8]: *p < .03) and in liver of BHLivDKO mice post VEH/DEN injection and 35 weeks of high fat diet feeding (E). Two-way ANOVA, Sidak’s multiple comparisons test (N = 6–8): *p < .03; **p < .005.
FIGURE 7
FIGURE 7
BMAL1 and HNF4α loss is protective in the STAM model and SR9009 blocks invasion of BMAL1-expressing tumor cells. (A) Experimental timeline for STAM model on the BHLivDKO background. (B) Whole livers of VEH and STZ treated STAM mice (WT/ BHLivDKO) at 17 weeks of age (left panel), and percent tumor incidence and number of tumors per liver (right panel). (C–E) H&E, AFP, and oil-Red O staining of WT and, BHLivDKO, and H4LivKO mouse livers after VEH or STZ injection followed by HFD AT 16 weeks (scale bar = 2000 μm, magnified scale bar = 100 μm, 200 μm).
FIGURE 8
FIGURE 8
SR9009 blocks proliferation and migration of Bmal1 expressing tumor cells. (A) MTT assay shows normalized cell viability following SR9009 or vehicle treatment. Two-way ANOVA, Sidak’s multiple comparisons test (N = 8): *p < .03; **p < .005; ***p < .0005. (B) Migration assay reveals effects of SR9009 versus vehicle on AMl12, Hepa-1c1c, and HepG2 cells 48-h post-treatment (left panel). Quantification, right panel. ****p < .0001 was determined by Mann–Whitney U-test (N = 6) (Scale bar = 1000 μm). (C) Bmal1 gene expression in Aml12, Hepa-1c1c, HepG2, and SNU449 cells post-VEH/SR9009 treatment following REV-ERBs siRNA or the scrambled control. (D) Cell viability measurement using MTT assay at 48 h following VEH/SR9009and SC/REV-ERBs siRNA treatment. (E) Cell migration assays show effects of SR9009 versus vehicle and scrambled (sc) versus siREV-ERB oligonucleotides on Aml12, Hepa-1c1c, HepG2, and SNU449 cells 48-h post-treatment (top panel). Quantification, bottom panel. ****p < .0001 was determined by Mann–Whitney U-test (N = 6) (Scale bar = 200 μm). (F) Model of HCC stratification. Previous results indicate that while healthy hepatocytes co-express BMAL1 and HNF4α, human HCC with high levels of HNF4α contain the “fetal” form of the protein, which is not tumor suppressive and transcriptionally inhibits BMAL1 expression. Conversely, HCC which shows high levels of BMAL1 is deficient in HNF4α. Our data suggest that treating these tumor types with modulators of BMAL1 may provide opportunities for improved therapy.

Similar articles

Cited by

References

    1. Kulik L, El-Serag HB. Epidemiology and management of hepatocellular carcinoma. Gastroenterology 2019;156(2):477–491 e1. - PMC - PubMed
    1. Kanwal F, Kramer JR, Mapakshi S, et al. Risk of hepatocellular cancer in patients with non-alcoholic fatty liver disease. Gastroenterology 2018;155(6):1828–1837 e2. - PMC - PubMed
    1. Partch CL, Green CB, Takahashi JS. Molecular architecture of the mammalian circadian clock. Trends Cell Biol 2014;24(2):90–99. - PMC - PubMed
    1. Stevens RG. Light-at-night, circadian disruption and breast cancer: assessment of existing evidence. Int J Epidemiol 2009;38(4):963–970. - PMC - PubMed
    1. Schernhammer ES, Kroenke CH, Laden F, Hankinson SE. Night work and risk of breast cancer. Epidemiology 2006;17(1):108–111. - PubMed

Publication types

MeSH terms

Substances