. 2022 Nov;40(6):900-913.
doi: 10.1007/s00774-022-01361-3. Epub 2022 Aug 10.

Defective bone repletion in aged Balb/cBy mice was caused by impaired osteoblastic differentiation

Affiliations

Defective bone repletion in aged Balb/cBy mice was caused by impaired osteoblastic differentiation

Matilda H-C Sheng et al. J Bone Miner Metab. 2022 Nov.

Abstract

Introduction: This study was undertaken to gain mechanistic information about bone repair using the bone repletion model in aged Balb/cBy mice.

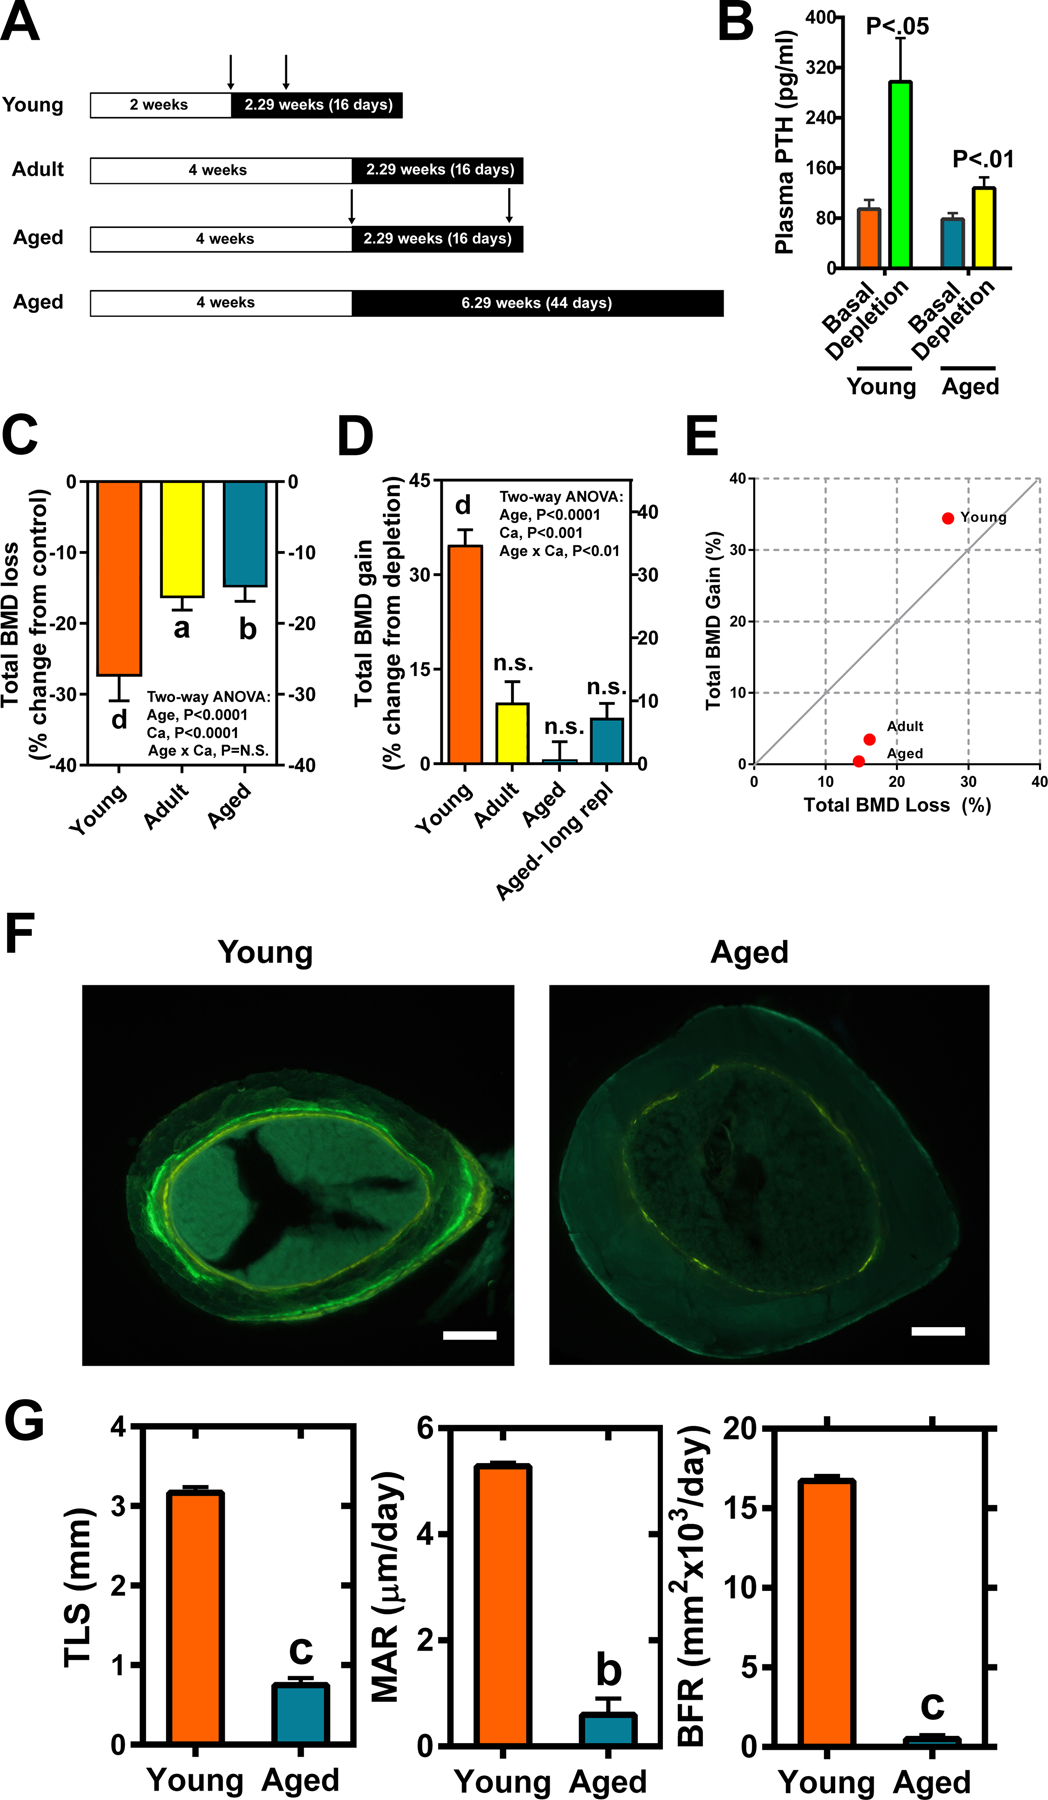
Materials and methods: one month-old (young) mice were fed a calcium-deficient diet for 2 weeks and 8 month-old (adult) and 21-25 month-old (aged) female mice for 4 weeks during depletion, which was followed by feeding a calcium-sufficient diet for 16 days during repletion. To determine if prolonged repletion would improve bone repair, an additional group of aged mice were repleted for 4 additional weeks. Control mice were fed calcium-sufficient diet throughout. In vivo bone repletion response was assessed by bone mineral density gain and histomorphometry. In vitro response was monitored by osteoblastic proliferation, differentiation, and senescence.

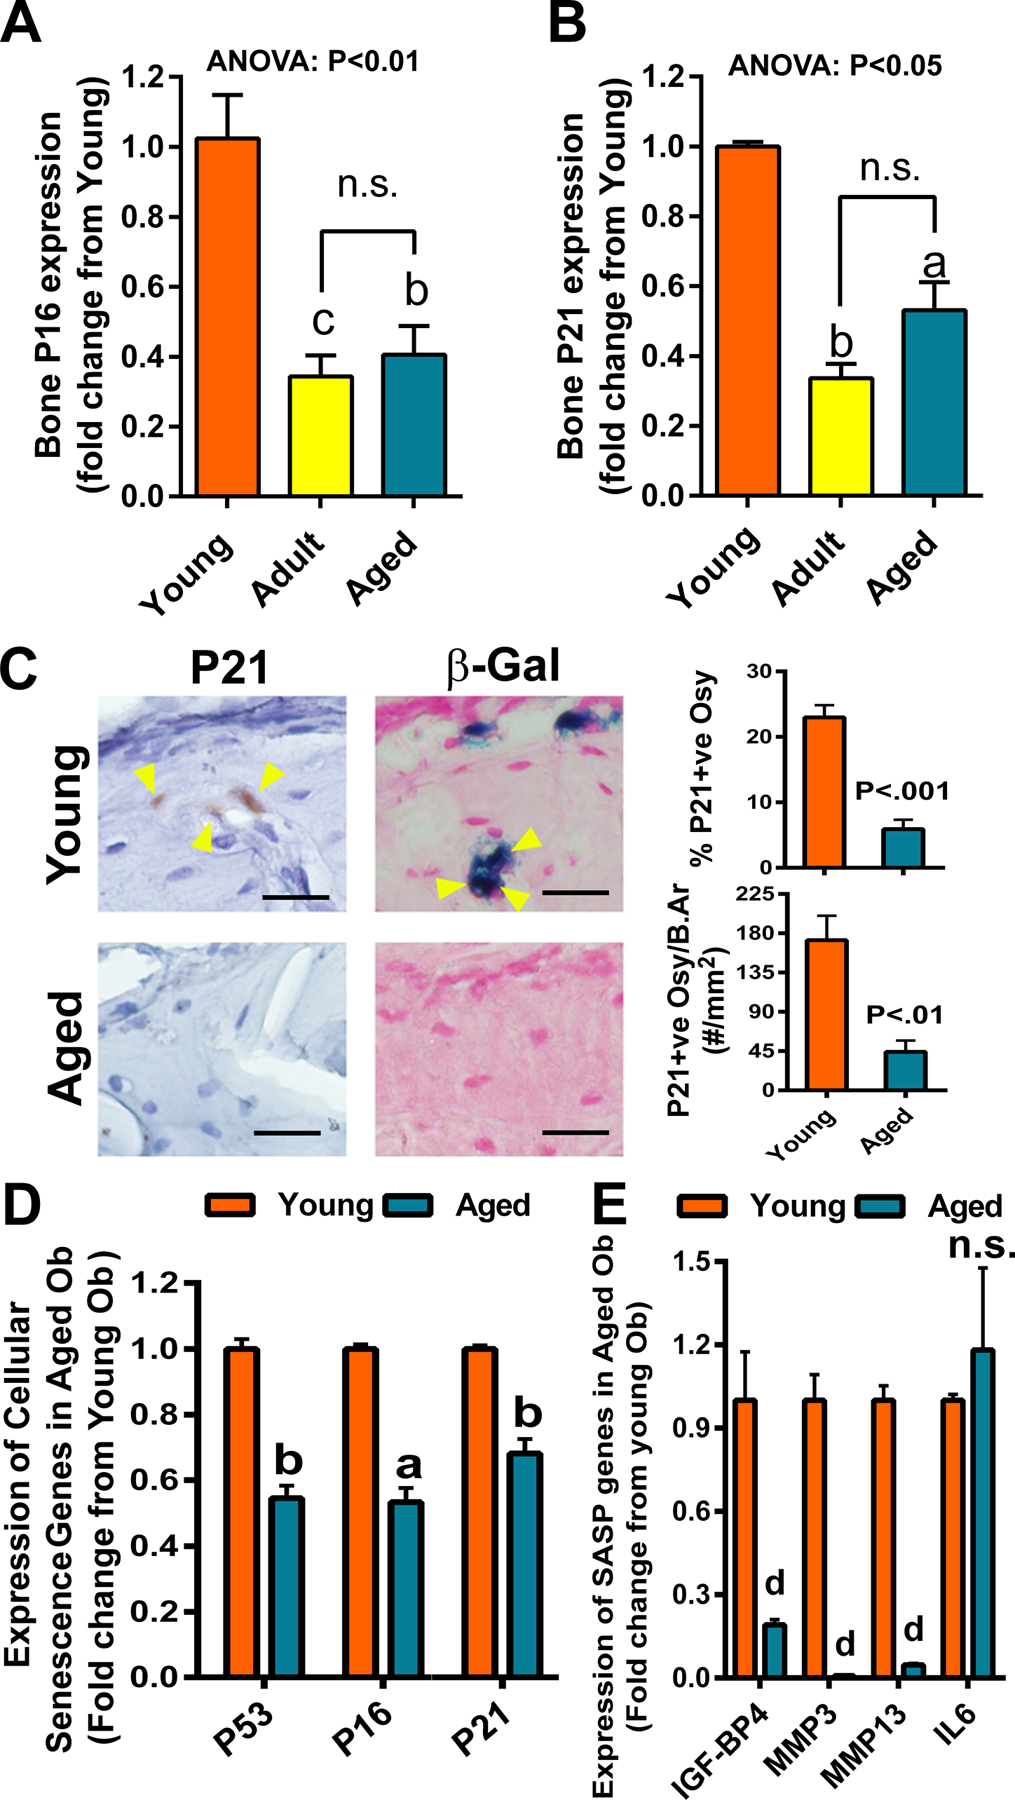
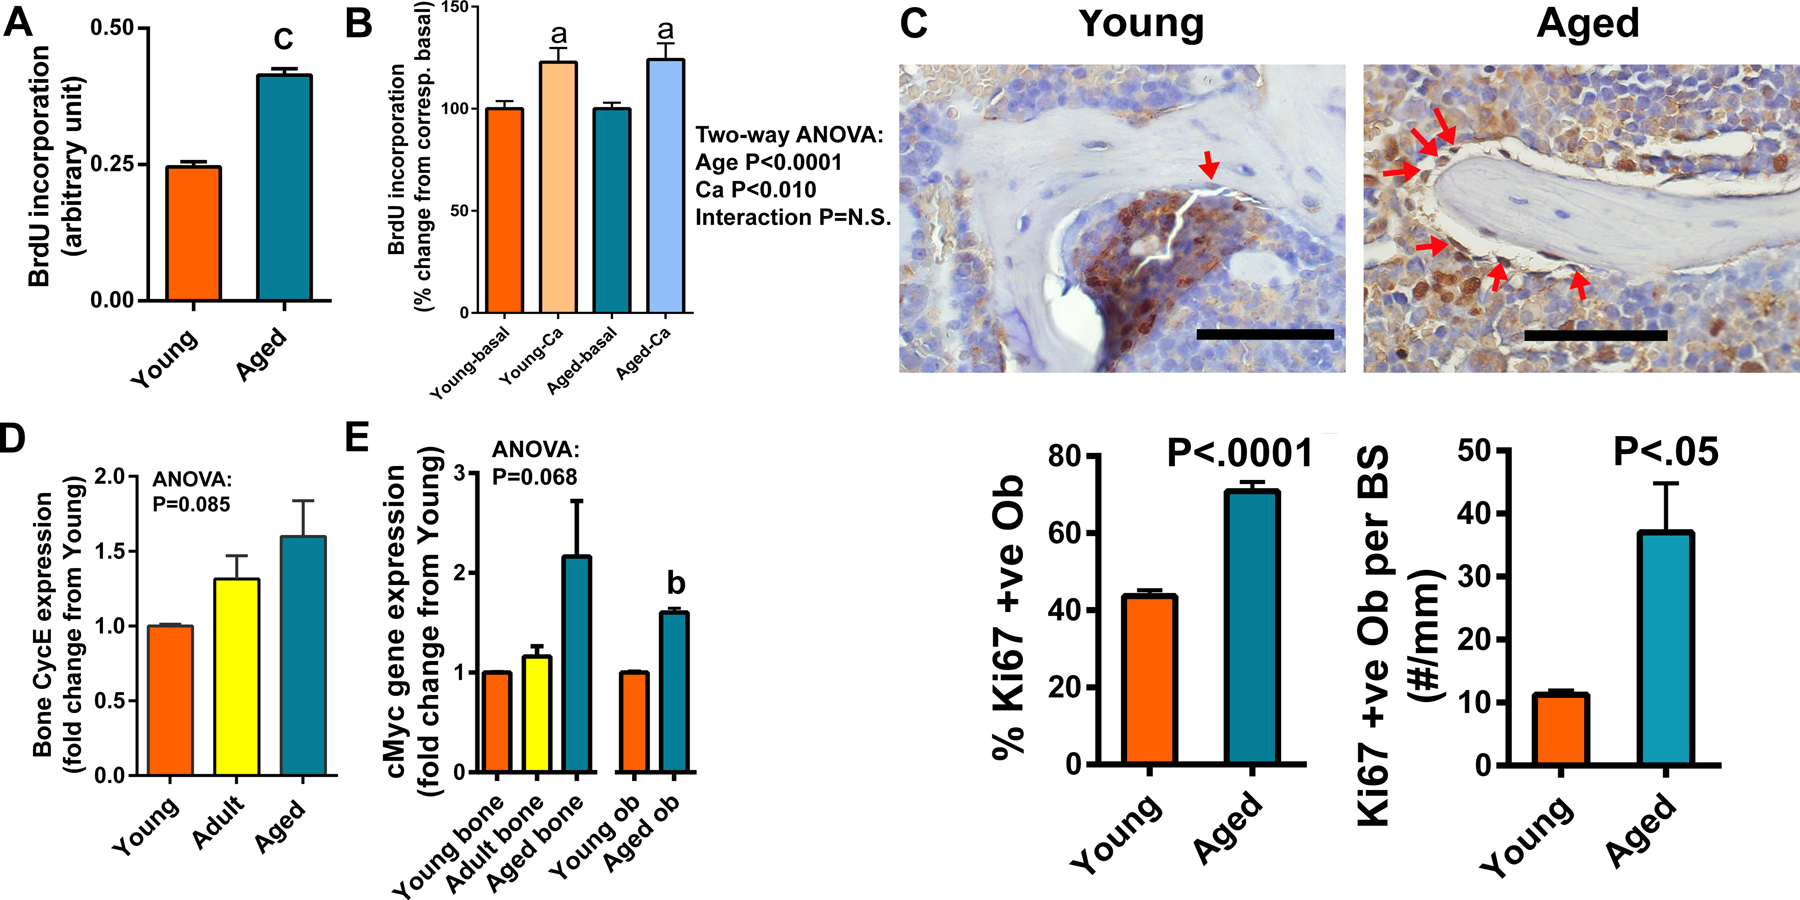
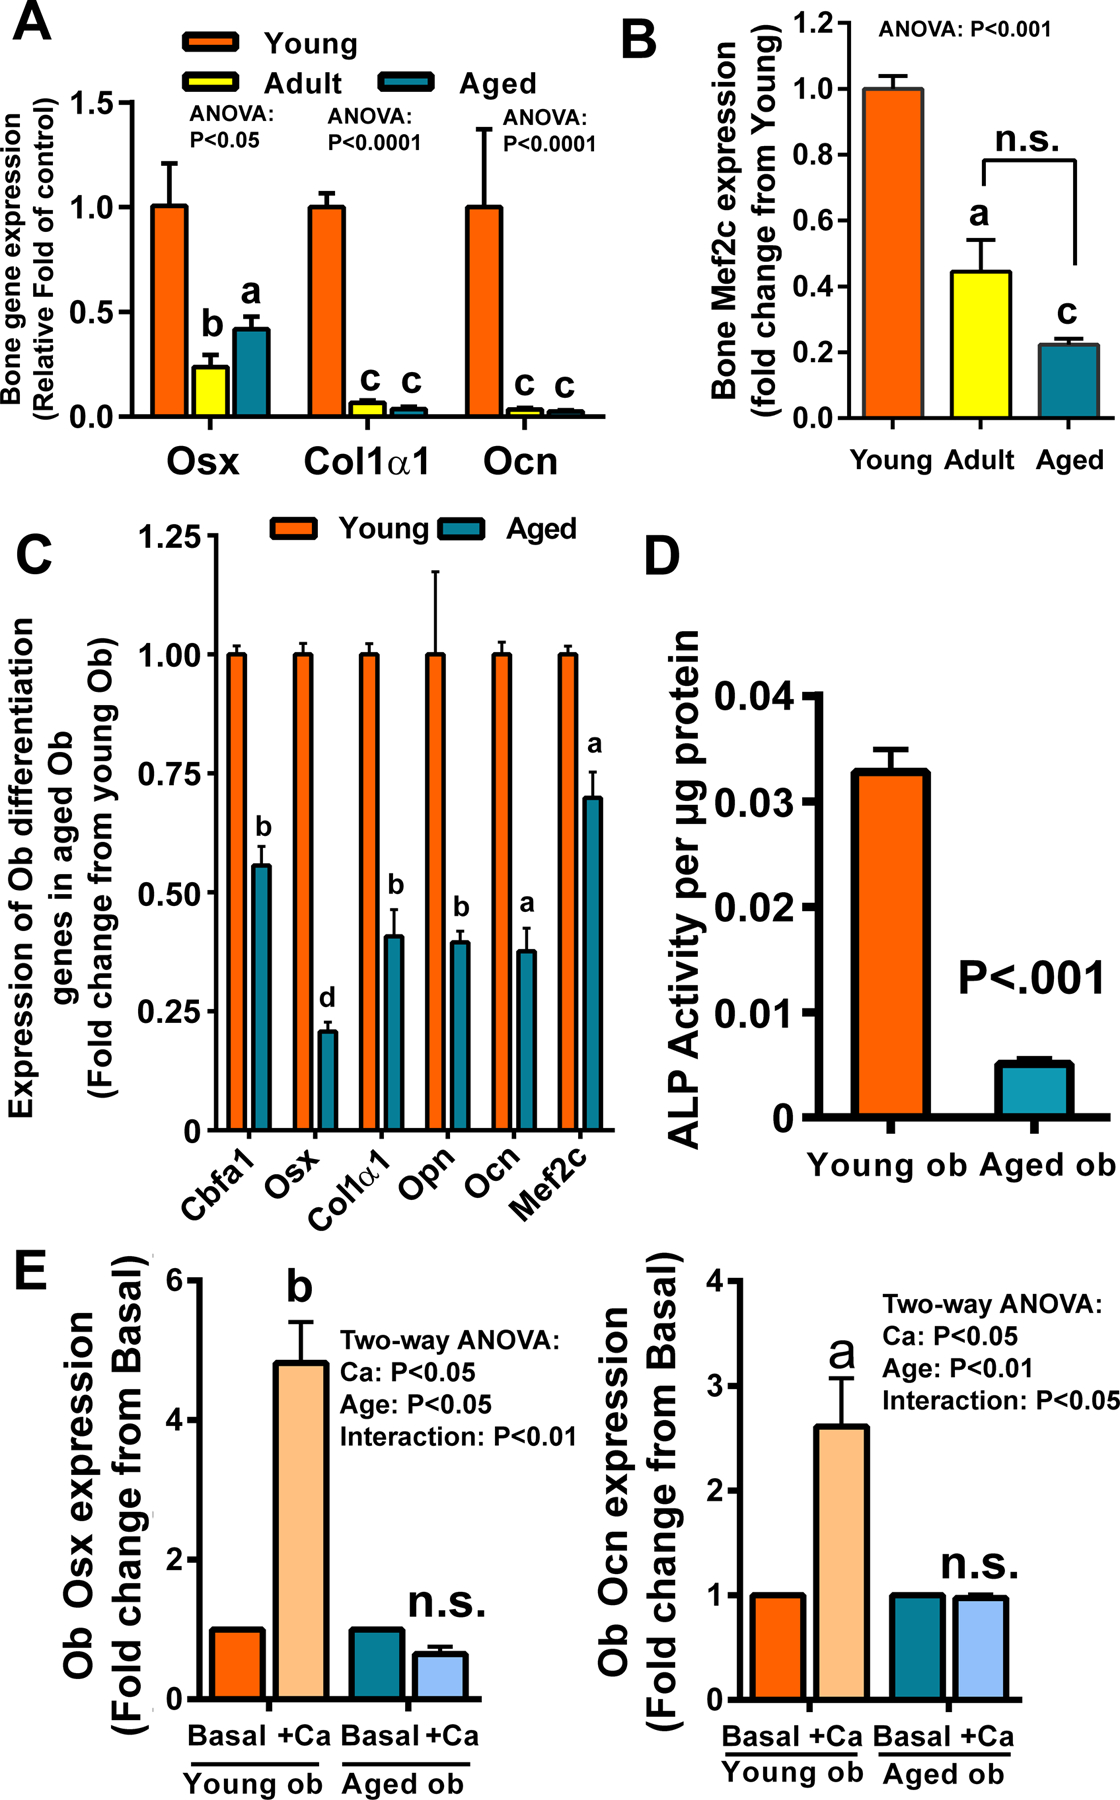
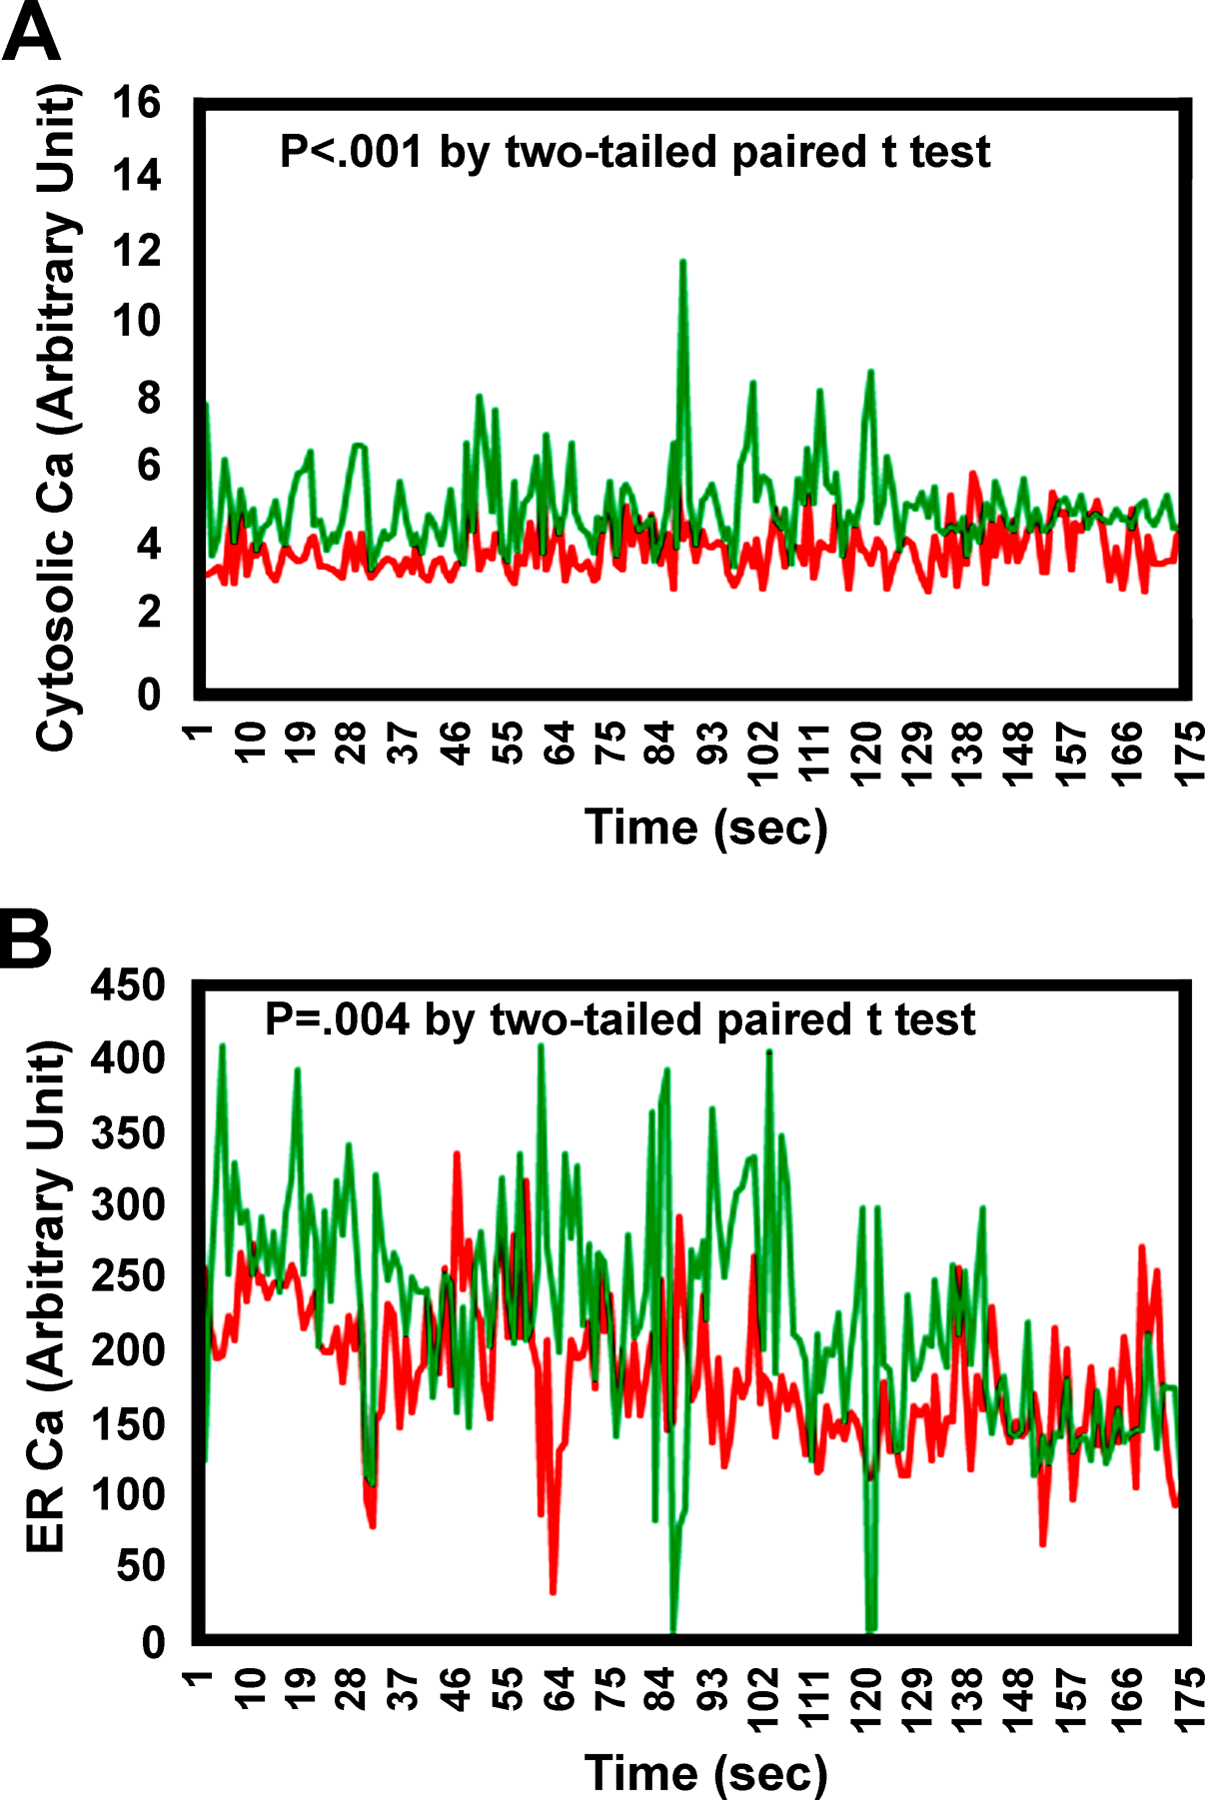
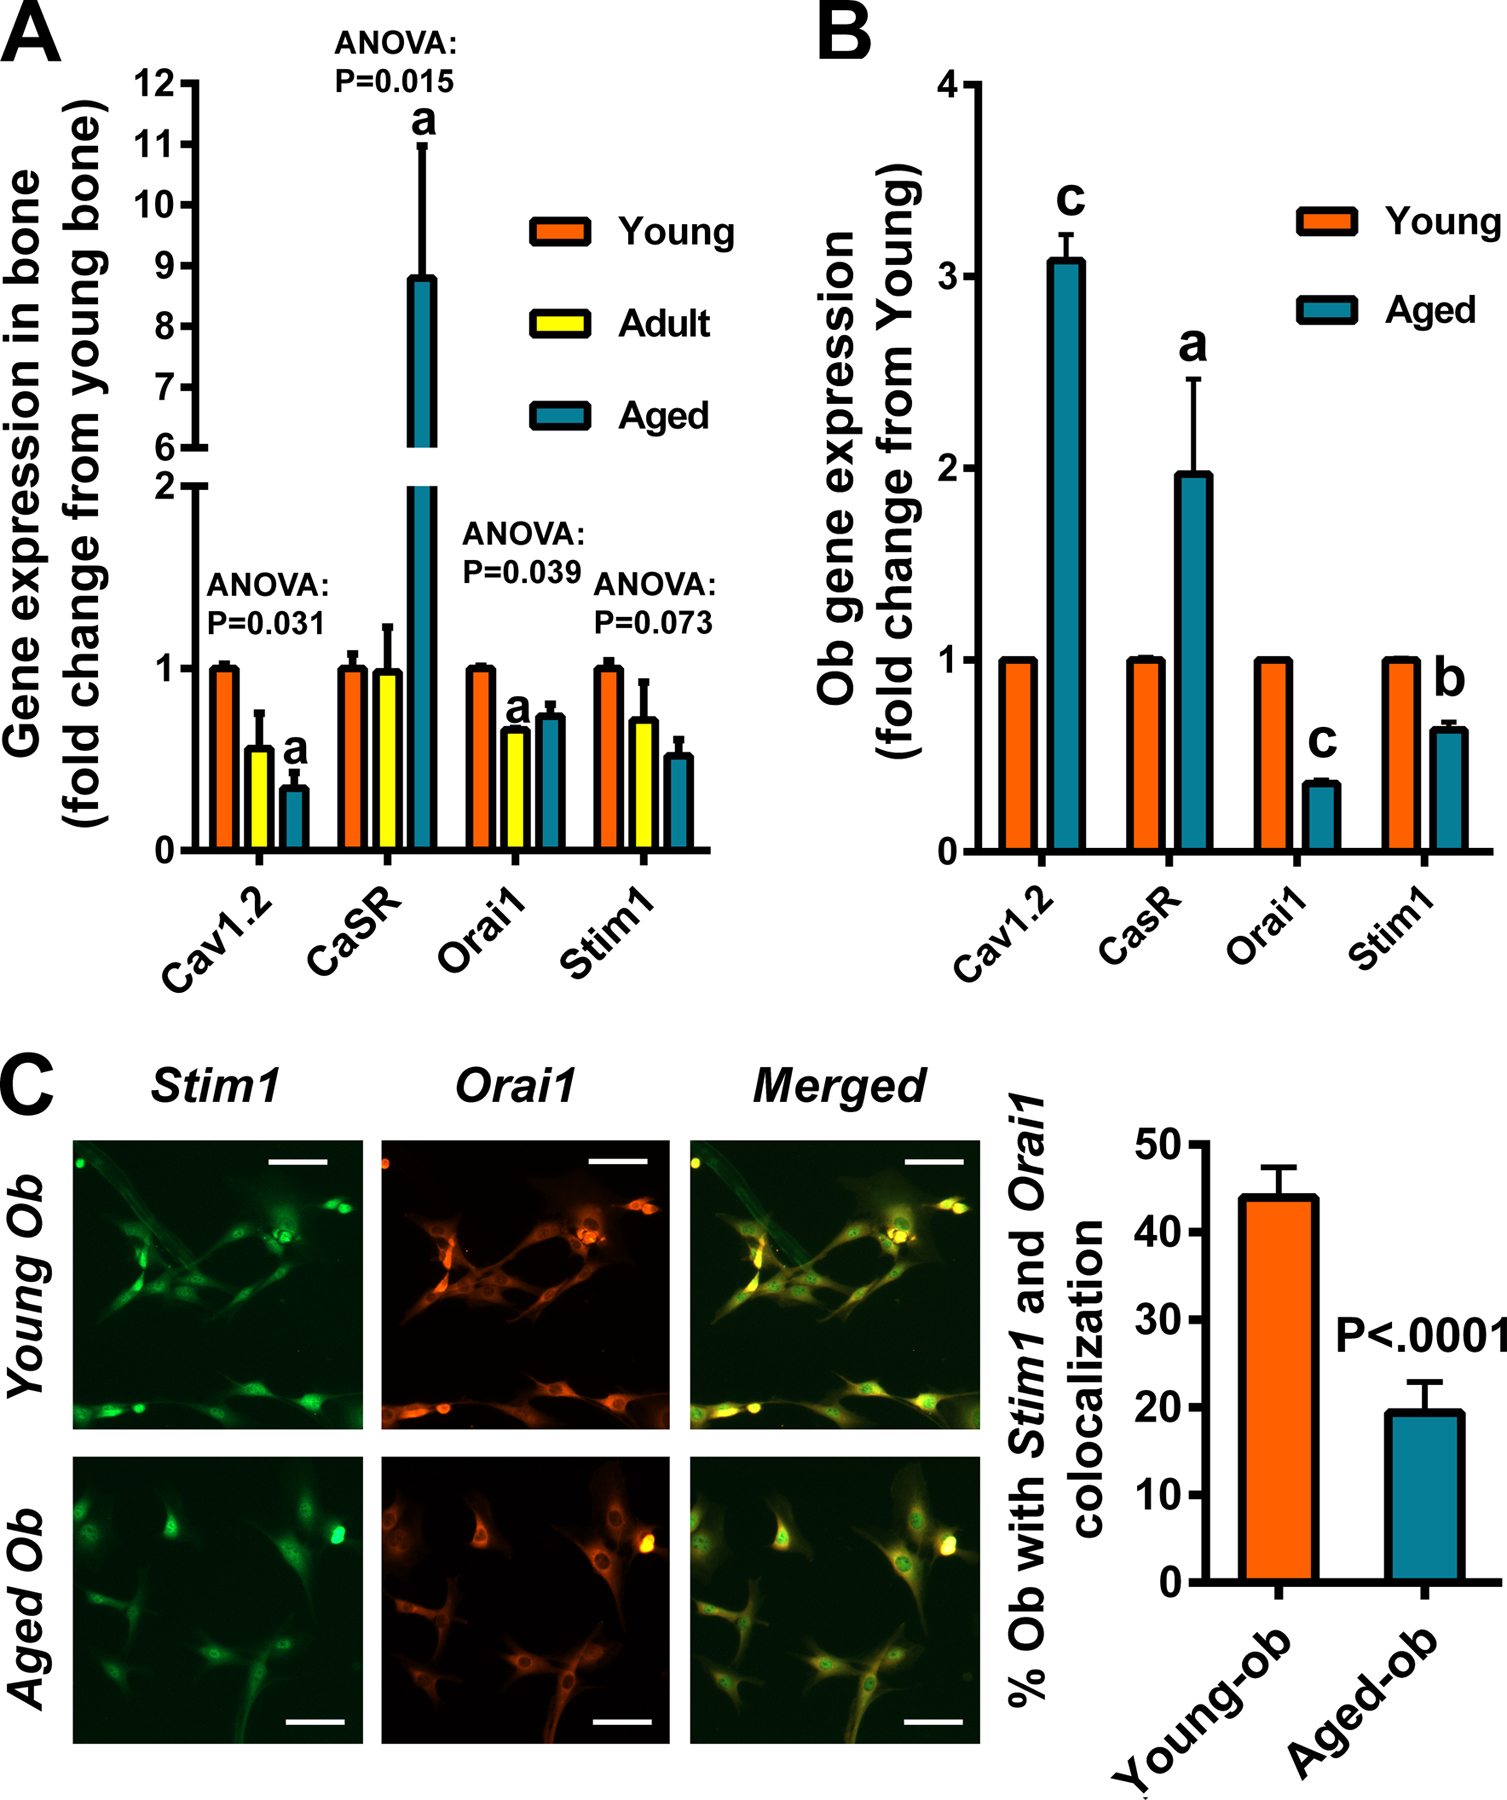
Results: There was no significant bone repletion in aged mice even with an extended repletion period, indicating an impaired bone repletion. This was not due to an increase in bone cell senescence or reduction in osteoblast proliferation, but to dysfunctional osteoblastic differentiation in aged bone cells. Osteoblasts of aged mice had elevated levels of cytosolic and ER calcium, which were associated with increased Cav1.2 and CaSR (extracellular calcium channels) expression but reduced expression of Orai1 and Stim1, key components of Stored Operated Ca2+ Entry (SOCE). Activation of Cav1.2 and CaSR leads to increased osteoblastic proliferation, but activation of SOCE is associated with osteoblastic differentiation.

Conclusion: The bone repletion mechanism in aged Balb/cBy mice is defective that is caused by an impaired osteoblast differentiation through reducedactivation of SOCE.

Keywords: Aging; Bone repletion; Calcium channels; Osteoblast differentiation; Stored operated calcium entry.


Conflict of interest statement

Conflicts of Interest Statement

All authors (Matilda H.-C. Sheng, Kin-Hing William Lau, Charles H. Rundle, Anar Alsunna, Sean M. Wilson, and David J. Baylink) have no conflict of interest to declare.

Figures

Figure 1.
Figure 1.. Comparison of bone loss and gain in young, adult, or aged Balb mice (n=6–8) after the dietary calcium depletion and repletion challenge, respectively.
A: Study design. B: Plasma PTH levels in young and aged mice after 2 and 4 weeks of calcium depletion, respectively. In C&D: total BMD was determined by pQCT in the secondary spongiosa of the femurs. C: The relative bone loss after the dietary calcium depletion period was calculated as relative percent change in total BMD from the control group. D: The relative bone gain after the bone repletion period was calculated as relative percent change in total BMD from the depletion group. For the long repletion group (long repl), the aged mice were subjected to calcium sufficient diet for 6.29 weeks (44 days), and calculation of relative percent change in total BMD was calculated in the same manner as for the regular repletion group. E: The plot of bone gain against bone loss in the three age groups of Balb mice using the corresponding mean value. The line is indicative of normal perfect remodeling (e.g., gain/loss =1). F: A representative microphotograph of cross section at the mid-point of the femurs with two tetracycline labels after 2.29 weeks (16 days) of bone repletion. The inter-labeling time was 6 and 13 days for young and aged mice, respectively. G: The calculated histomorphometry parameters of bone formation in the aged mice (Azure bars) versus young mice (Orange bars). TLS=total labeled surface; MAR=mineral apposition rate; BFR=bone formation rate. Scale bars = 50 μm. Significance is determined two-tailed Student’s t-test. aP<.05; bP<.01; cP<.001; dP<.0001 vs. corresponding controls, baselines, or the young group; n.s. = not significant (P>.05).
Figure 2.
Figure 2.. Comparison of basal expression of cellular senescence marker genes among the three test age groups.
Gene expression was determined by RT-qPCR with the Sybr-green method. Expression level of P16 (A) and P21 (B) mRNA in bone was each normalized against β-actin mRNA and compared among the three test age groups (n=4). aP<.05; bP<.01; cP<.001 vs. Young by one-way ANOVA followed by Tukey post hoc test. n.s.=not significant (P>.05) between the adult and the aged group of mice. (C) Immuno- and histochemical staining of P21 and SA-β-gal activity in osteocytes (indicated by yellow arrowheads) of Young (top panels) and Aged (bottom panels) mice. Scale bars = 50 μm. P21 positive osteocytes (Osy) in the cortex were identified by specific anti-P21 antibody immunostaining and counted with the OsteoMeasure system. The relative % of P21 positive osteocytes and the number of P21 positive osteocytes per bone area were reported. SA-β-gal activity in osteocytes on a frozen bone section was shown in bluish color after overnight incubation with substrate solution at 37°C followed by nuclear fast red counterstaining. Expression of cellular senescence marker genes (D) and selective senescence-associated secretory phenotype (SASP) factors (E) in osteoblasts (n=4), after culturing for 6 days in α-MEM supplemented with 2%FBS, 10 mM β-glycerophosphate, and 50 μg/ml of ascorbic acid, was each determined by RT-qPCR. aP<.05; bP<.01; dP<.0001 vs. young osteoblasts by two-tailed Student’s t-test.
Figure 3.
Figure 3.. Comparison of basal and calcium-stimulated BrdU incorporation, Ki67 immuno-positive osteoblasts, CycE expression, and cMyc gene expression among the three age groups.
A: The relative basal proliferating activity of osteoblasts derived from bones of young versus aged mice, determined by measuring BrdU incorporation into cultured cells using a commercial ELISA kit (Abcam). Each assay had 6 replicates and there were 2 repeats of the assay. B: Comparison of the stimulatory effects of added 2 mM calcium (Ca) in culture medium on BrdU incorporation of primary osteoblasts isolated from young and aged Balb mice (n=6). C: The proliferative cells, are determined by Ki67 immunostaining in a representative young and an aged bone. Yellow arrows indicate Ki67 positive osteoblasts, which is stained in brownish color. Negative cells are counter-stained in bluish color by hematoxylin. Scale bars = 100 μm. The Ki67 positive osteoblasts on the bone forming surface of the trabeculae in the metaphysis were counted with the Osteo-Measure System. D&E: Cyclin E (CycE) (D) mRNA level in tibial bone extract (n=4) and cMyc (E) mRNA level in tibial bone extract (n=4) and in isolated osteoblastic cell extract (Ob) (n=3), after normalization against β-actin mRNA expression by RT-qPCR. Statistical significance was determined by one- or two-way ANOVA followed by Tukey post-hoc test or two-tailed Student’s t test. aP<.05; bP<.01; cP<.001 vs. Young or Basal.
Figure 4.
Figure 4.. Comparison of the expression of genes associated with osteoblastic differentiation (A) and Mef2c (B) among bones of the three test age groups under basal conditions and between osteoblasts isolated from bone of young and aged mice (C, D), and the extracellular calcium-stimulated expression of osteoblastic genes in primary osteoblastic cells isolated from bones of young and aged mice (E).
In A&B, total RNA was extracted from the tibia (n=4). Gene expression was determined by RT-qPCR. The mRNA expression levels (normalized against corresponding β-actin mRNA level) of osterix (Osx), collagen type 1α1 (Col1α1), osteocalcin (Ocn) in (A) and Mef2C in (B) in bones of the three test age groups were compared and reported as relative fold change from the corresponding Young group. In C, osteoblastic cells (Ob) isolated from one-month-old young mice or 25-month-old aged mice. Isolated cells (n=4) were then cultured in the differentiation medium containing 2% FBS, 10 mM β-glycerophosphate, and 50 μg/ml of ascorbic acid for 6 days. The expression of genes of interest after normalized against β-actin was determined by RT-qPCR. In D, osteoblasts were cultured in the differentiation medium and change in ALP activity per cellular protein was determined with a spectrophotometric assay at 405 nm. In E, isolated osteoblasts (Ob) were cultured in the α-MEM medium supplemented with (+Ca) or without (basal) 3 mM extra calcium for 24 hrs. The expression of Osx or Ocn, normalized against β-actin mRNA, were determined by RT-qPCR (n=3 per group), and reported as relative fold of each corresponding basal control. Statistical significance was determined by one- or two-way ANOVA followed by Tukey post-hoc test (A, B, E) or by two-tailed Student’s t-test (C, D). aP<.05; bP<.01; cP<.001; dP<.0001 vs. Young or Basal. In B, comparison is also made between the adult and aged groups by two-tailed Student’s t-test.
Figure 5.
Figure 5.. Comparison of time-dependent cytosolic and ER calcium levels in young versus aged osteoblasts.
Osteoblasts were isolated from long bones of young and aged mice. Cytosolic and ER calcium levels were determined using a calcium indicator, fluo-4 AM; and fluorescence signal upon binding to calcium was captured by a Zeiss confocal microscopy system. (A) Comparison of cytosolic calcium levels between young and aged osteoblasts over the indicated time point. (B) Comparison of ER calcium levels at the presence of ionomycin to induce the release of calcium from the ER into cytoplasm over the indicated period. Red = Young osteoblasts; Green = Aged osteoblasts. Each data point at the peak height from each age group over this time course was analyzed by two-tailed paired Student’s t-test.
Figure 6.
Figure 6.. Comparison of basal mRNA expression levels of genes responsible for calcium cellular entry in bone (A) or in isolated primary osteoblasts (B, C).
In A, total RNA was extracted from long bones of three age groups and reversely transcribed into cDNA. In B, osteoblasts (Ob) were isolated from long bones of young and aged mice (n=3). In both A&B, the mRNA expression of each test calcium entry gene, i.e., L-type calcium channel Cav1.2, calcium-sensing receptor (CaSR), Stim1, and Orai1 (each normalized against β-actin mRNA) was determined by RT-qPCR. Statistical significance is determined by one-way ANOVA followed by Tukey post-hoc test or Student’s two-tailed t-test. aP<.05; bP<.01; cP<.001 compared to the young group. In C, osteoblasts were treated with 150 nM of thapsigargin for 5 minutes to induce the depletion of ER calcium stores. Sequential dual immunostaining was performed. Stim1 was first detected using anti-stim1 antibody and DyLight488-anti-rabbit IgG conjugate, which was followed by detection of orai 1 using anti-orai1 antibody and Cy3-anti-rabbit IgG conjugate. Fluorescence signals were detected with a ZEISS fluorescence microscope equipped with the ZEN3.0 (blue edition) software. Stim1 positive cells are shown in greenish fluorescence. Orai1 positive cells are shown in orange-red fluorescence. Cells with co-localization of Stim1 and orai1 are shown as yellow fluorescence. Scale bar = 100 μm. Statistical significance was determined by two-tailed Student’s t-test.

Similar articles

Cited by

References

    1. Gudmundsdottir SL, Indridason OS, Franzson L, Sigurdsson G (2005) Age-related decline in bone mass measured by dual-energy X-ray absorptiometry and quantitative ultrasound in a population-based sample of both sexes: identification of useful ultrasound thresholds for osteoporosis screening. J Clin Densitom 8:80–6 doi:10.1385/jcd:8:1:080 - DOI - PubMed
    1. Ferguson VL, Ayers RA, Bateman TA, Simske SJ (2003) Bone development and age-related bone loss in male C57BL/6J mice. Bone 33:387–98 doi:10.1016/s8756-3282(03)00199-6 - DOI - PubMed
    1. Chapuy MC, Arlot ME, Duboeuf F, Brun J, Crouzet B, Arnaud S, Delmas PD, Meunier PJ (1992) Vitamin D3 and calcium to prevent hip fractures in elderly women. N Engl J Med 327:1637–42 doi:10.1056/NEJM199212033272305 - DOI - PubMed
    1. Binkley N, Blank RD, Leslie WD, Lewiecki EM, Eisman JA, Bilezikian JP (2017) Osteoporosis in Crisis: It’s Time to Focus on Fracture. J Bone Miner Res 32:1391–94 doi:10.1002/jbmr.3182 - DOI - PubMed
    1. Farr JN, Fraser DG, Wang H, Jaehn K, Ogrodnik MB, Weivoda MM, Drake MT, Tchkonia T, LeBrasseur NK, Kirkland JL, Bonewald LF, Pignolo RJ, Monroe DG, Khosla S (2016) Identification of Senescent Cells in the Bone Microenvironment. J Bone Miner Res 31:1920–29 doi:10.1002/jbmr.2892 - DOI - PMC - PubMed

LinkOut - more resources