

DNA methylation trajectories and accelerated epigenetic aging in incident type 2 diabetes
- PMID: 35947335
- PMCID: PMC9768051
- DOI: 10.1007/s11357-022-00626-z
DNA methylation trajectories and accelerated epigenetic aging in incident type 2 diabetes
Abstract
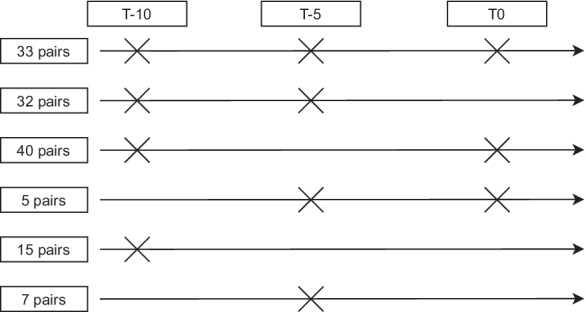
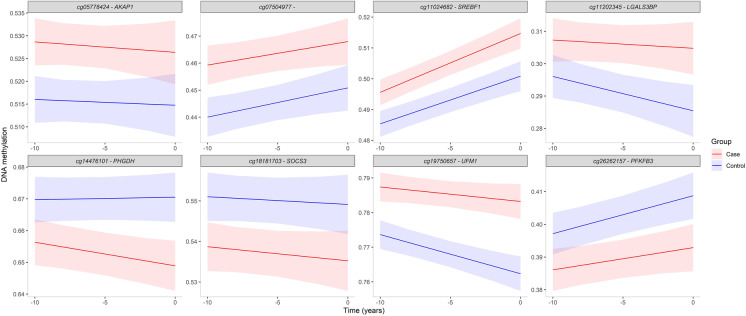
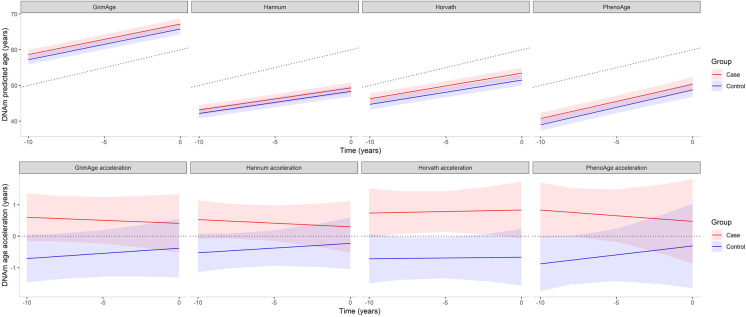
DNA methylation (DNAm) patterns across the genome changes during aging and development of complex diseases including type 2 diabetes (T2D). Our study aimed to estimate DNAm trajectories of CpG sites associated with T2D, epigenetic age (DNAmAge), and age acceleration based on four epigenetic clocks (GrimAge, Hannum, Horvath, phenoAge) in the period 10 years prior to and up to T2D onset. In this nested case-control study within Doetinchem Cohort Study, we included 132 incident T2D cases and 132 age- and sex-matched controls. DNAm was measured in blood using the Illumina Infinium Methylation EPIC array. From 107 CpG sites associated with T2D, 10 CpG sites (9%) showed different slopes of DNAm trajectories over time (p < 0.05) and an additional 8 CpG sites (8%) showed significant differences in DNAm levels (at least 1%, p-value per time point < 0.05) at all three time points with nearly parallel trajectories between incident T2D cases and controls. In controls, age acceleration levels were negative (slower epigenetic aging), while in incident T2D cases, levels were positive, suggesting accelerated aging in the case group. We showed that DNAm levels at specific CpG sites, up to 10 years before T2D onset, are different between incident T2D cases and healthy controls and distinct patterns of clinical traits over time may have an impact on those DNAm profiles. Up to 10 years before T2D diagnosis, cases manifested accelerated epigenetic aging. Markers of biological aging including age acceleration estimates based on Horvath need further investigation to assess their utility for predicting age-related diseases including T2D.
Keywords: Aging markers; Biological age; DNA methylation; Epigenetic clock; Type 2 diabetes.
© 2022. The Author(s), under exclusive licence to American Aging Association.
Conflict of interest statement
The authors declare that they have no conflict of interest.
Figures

References
-
- Saeedi P, Petersohn I, Salpea P, et al Global and regional diabetes prevalence estimates for 2019 and projections for 2030 and 2045: Results from the International Diabetes Federation Diabetes Atlas, 9th edition. Diabetes Research and Clinical Practice. 2019;157. 10.1016/j.diabres.2019.107843 - PubMed
Publication types
MeSH terms
LinkOut - more resources
Full Text Sources
Medical
