. 2023 Mar;19(3):904-925.
doi: 10.1080/15548627.2022.2111081. Epub 2022 Aug 25.

Autophagy-mediated NCOR1 degradation is required for brown fat maturation and thermogenesis

Affiliations

Autophagy-mediated NCOR1 degradation is required for brown fat maturation and thermogenesis

Alba Sabaté-Pérez et al. Autophagy. 2023 Mar.

Erratum in

  • Correction.
    [No authors listed] [No authors listed] Autophagy. 2025 Jun;21(6):i. doi: 10.1080/15548627.2022.2123145. Epub 2022 Sep 14. Autophagy. 2025. PMID: 36102791 Free PMC article. No abstract available.

Abstract

Brown adipose tissue (BAT) thermogenesis affects energy balance, and thereby it has the potential to induce weight loss and to prevent obesity. Here, we document a macroautophagic/autophagic-dependent mechanism of peroxisome proliferator-activated receptor gamma (PPARG) activity regulation that induces brown adipose differentiation and thermogenesis and that is mediated by TP53INP2. Disruption of TP53INP2-dependent autophagy reduced brown adipogenesis in cultured cells. In vivo specific-tp53inp2 ablation in brown precursor cells or in adult mice decreased the expression of thermogenic and mature adipocyte genes in BAT. As a result, TP53INP2-deficient mice had reduced UCP1 content in BAT and impaired maximal thermogenic capacity, leading to lipid accumulation and to positive energy balance. Mechanistically, TP53INP2 stimulates PPARG activity and adipogenesis in brown adipose cells by promoting the autophagic degradation of NCOR1, a PPARG co-repressor. Moreover, the modulation of TP53INP2 expression in BAT and in human brown adipocytes suggests that this protein increases PPARG activity during metabolic activation of brown fat. In all, we have identified a novel molecular explanation for the contribution of autophagy to BAT energy metabolism that could facilitate the design of therapeutic strategies against obesity and its metabolic complications.

Keywords: Autophagy; brown adipose tissue; metabolism; obesity; thermogenesis.


Conflict of interest statement

No potential conflict of interest was reported by the author(s).

Figures

Figure 1.
Figure 1.
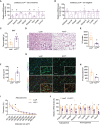
TP53INP2-dependent autophagy induces brown fat differentiation and maturation. (A) LC3B protein abundance and (B) LC3B-II fold accumulation in control (C) and tp53inp2 knockout (KO) mouse brown preadipocytes treated with vehicle (−) or with bafilomycin A1 (BAF) (+) 200 nM for 6 h (n = 3). (C) LC3B protein abundance and (D) LC3B-II-fold accumulation in mouse brown preadipocytes transfected with siRNA control (siSCR) or with different siRnas targeting Tp53inp2 (si#1 and si#2) and treated with vehicle (−) or with bafilomycin A1 (BAF) (+) 200 nM for 4 h (n = 5). Panels (E) to (G): C and KO mouse brown preadipocytes. (E) Optical microscopy images at day 9 of differentiation. (F) PPARG, UCP1, TIMM44, and MFN2 protein abundance during differentiation (n = 3–6). (G) Relative mRNA levels of adipogenic and thermogenic genes at day 9 of differentiation (n = 4–5). (H) LC3B, PPARG, and UCP1 protein abundance in adipocytes treated for the last 3 or 7 days of differentiation with 15 µm chloroquine (CQ). Panels (I) to (L): control (LoxP) and KOMyf5 male or female mice at 3 months of age housed at 22°C and subjected to a chow diet (n = 7–9 LoxP or KOMyf5 mice). (I) Weight of iBAT. (J) Hematoxylin-eosin (H&E) staining of iBAT sections. (K) iBAT sections stained with DAPI (blue), wheat germ agglutinin (WGA, green), and UCP1 (red). (L) Expression of adipogenic and thermogenic genes in iBAT. Data are mean ± SEM. *p < 0.05 vs. control group. Scale bar: 100 μm (H&E images) or 50 μm (DAPI, WGA, and UCP1 images).
Figure 2.
Figure 2.
TP53INP2 maintains the differentiation state of brown adipocytes. Expression of genes in brown adipocytes from (A) tp53inp2 LoxP+/+Ubc-Cre-ERT2 mice or from (B) Tp53inp2 LoxP+/+Cre-negative mice treated with vehicle or with 4-hydroxy-tamoxifen for 3 days (n = 3). Panels (C) to (I): control (LoxP) and KOUbc male mice at 8 months of age housed at 22°C and subjected to a chow diet (n = 4–8 LoxP or KOUbc mice). (C) Weight of iBAT. (D) Hematoxylin-eosin (H&E) staining of iBAT sections, (E) lipid droplet (LD) number, and (F) LD average area measurements. (G) iBAT sections stained with DAPI (blue), wheat germ agglutinin (WGA, green), and UCP1 (red), (H) number of adipocytes per surface unit, and (I) adipocyte size distribution measurements. (J) Expression of adipogenic and thermogenic genes in iBAT from 4-month-old LoxP and KOUbc male mice housed at 22°C and subjected to a chow diet (n = 4–7 LoxP or KOUbc mice). Data are mean ± SEM. *p < 0.05 vs. control group. Scale bar: 100 μm (H&E images) or 50 μm (DAPI, WGA, and UCP1 images).
Figure 3.
Figure 3.
TP53INP2 stimulates PPARG activity. Panels (A) to (C): transcriptomic analysis performed in iBAT from LoxP (n = 4) or KOMyf5 mice (n = 4) and compared to transcriptomic analysis from WT mice housed at 22°C (n = 2) or 30°C (n = 2) in iBAT samples. (A) Number of genes upregulated or downregulated (hypergeometric test p-val <0.001). Enrichment plot (GSEA) of the gene sets composed by the (B) 100 top upregulated and (C) downregulated genes in iBAT from KOMyf5 mice compared to the LoxP group using as background ranked list 30°C/22°C test statistics (p-val <0.001). GSEA of the most significantly downregulated pathways from Broad Hallmarks by tp53inp2 ablation in iBAT from (D) KOMyf5 or (E) KOUbc mice. (F) GSEA of PPAR signaling pathway from Kyoto Encyclopedia of Genes and Genomes (KEGG) in the LoxP vs KOMyf5 transcriptomic analysis (p-val <0.001). (G) PPRE reporter activity in control (SCR) or tp53inp2 knockdown (KD) brown preadipocytes transfected with empty vector (-) or PPARG (+) and treated with vehicle (-) or with rosiglitazone (+) 1 μM for 24 h (n = 5). (H) PPRE reporter activity in brown preadipocytes stably expressing empty vector (-) or HA-PPARG (+), with TP53INP2 endogenous levels (C) or tp53inp2 knockout (KO) treated with vehicle (-) or with rosiglitazone (+) 1 μM for 24 h (n = 3). Data are mean ± SEM. *p < 0.05 vs. control group.
Figure 4.
Figure 4.
TP53INP2 promotes NCOR1 degradation through autophagy. (A) NCOR1, LC3B, and TP53INP2 protein abundance, (B) NCOR1 and (C) LC3B-II-fold accumulation in control (SCR) or tp53inp2 knockdown (KD) brown preadipocytes in basal or upon treatment with 200 nM bafilomycin A1 (BAF) for 4 h (n = 9, 7 and 9 respectively). (D) NCOR1, LC3B, and TP53INP2 protein abundance, (E) NCOR1 and (F) LC3B-II-fold accumulation in control (Empty), TP53INP2 or TP53INP2-LIR stably overexpressing brown preadipocytes in basal (−) or upon treatment with BAF (+) for 4 h (n = 4 and 6, respectively). (G) NCOR1, LC3B, and TP53INP2 protein abundance in day 4 adipocytes transfected at day 2 with siRNA control (SCR) or against Tp53inp2 in basal (−) or upon treatment with BAF (+) for the last 6 h (n = 5, 6, and 6, respectively). (H) NCOR1 protein abundance and (I) quantification in iBAT from LoxP or KOMyf5 male mice at 3 months of age housed at 22ºC and subjected to a chow diet (n = 4–7 LoxP or KOMyf5 mice).
Figure 5.
Figure 5.
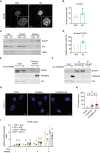
TP53INP2 promotes the cytosolic recruitment of NCOR1 in an autophagy-dependent manner. Panels (A) to (D): Control (SCR) or tp53inp2 knockdown (KD) brown preadipocytes. (A) NCOR1 immunostaining and (B) nuclear:cytosolic ratio quantification (n = 3, each experiment is the average of 17–65 cells). (C) NCOR1 protein abundance in total, cytosolic, and nuclear homogenates, and (D) nuclear NCOR1 quantification (n = 5). Panels (E) and (F): HEK cells stably expressing empty vector (−) or HA-TP53INP2 (+). (E) HA affinity isolation and NCOR1, TP53INP2, and VCL immunoblot in input and pull-down fractions (n = 7). (F) NCOR1 immunoprecipitation and NCOR1, TP53INP2, and VCL immunoblot in input and immunoprecipitated fractions (n = 3). (G) Proximity ligation assay (PLA) and nuclei staining (DAPI), and (H) PLA dots by nucleus quantification in control (Empty), TP53INP2 or TP53INP2-LIR stably overexpressing brown preadipocytes (representative experiment of n = 3 independent experiments). (I) PPRE reporter activity in cells transfected with control (siCtr) or Ncor1 (siNcor1) siRNA and with empty vector (−) or PPARG (+) and treated with vehicle (−) or with rosiglitazone (+) 1 μM for 24 h (n = 4). Data are mean ± SEM. *p < 0.05 vs. control group. #p < 0.05 vs. siCtr. Scale bar: 10 μm.
Figure 6.
Figure 6.
TP53INP2 induces non-shivering adaptive thermogenesis. Panels (A) to (C): control (LoxP) and KOMyf5 male mice at 3 months of age housed at 22°C and subjected to a chow diet (n = 7 LoxP or KOMyf5 mice). (A) Energy expenditure, (B) oxygen consumption (VO2), and (C) carbon dioxide production (VCO2) plotted against body weight. (D) Oxygen consumption increase (ΔVO2) upon norepinephrine injection (NE) and (E) area under the curve quantification in anesthetized mice at 30°C. LoxP or KOMyf5 mice were acclimated to the indicated temperatures for 2 months before performing the experiment (n = 7–11 LoxP or KOMyf5 mice at 22ºC and n = 5–9 LoxP or KOMyf5 mice at 30ºC). (F) High-resolution respirometry in iBAT isolated mitochondria (n = 5–6 LoxP or KOMyf5 mice). Panels (G) to (L): LoxP and KOMyf5 male or female mice at 6 months of age housed at 22°C and subjected to a chow diet (n = 4–9 LoxP or KOMyf5 mice). (G) Body weight. (H) Weight of iBAT. (I) Body weight gain and (J) fat mass gain from 3 to 6 months of age. (K) iBAT sections stained with DAPI (blue), wheat germ agglutinin (WGA, green) and UCP1 (red). (L) UCP1 protein abundance in iBAT. Data are mean ± SEM. *p < 0.05 vs. control group. Scale bar: 50 μm.
Figure 7.
Figure 7.
BAT-Specific diet induced thermogenesis is impaired by tp53inp2 ablation. Panels (A) to (I): control (LoxP) and KOMyf5 male mice at 6 months of age housed at 30°C for 5 months and subjected to a chow diet (CD) (n = 8–12 LoxP or KOMyf5 mice) or to a high-fat diet (HFD) (n = 8–10 LoxP or KOMyf5 mice). (A) Body weight. (B) Total fat mass. (C) Weight of iBAT. (D) Weight of ingWAT. (E) Weight of pgWAT. (F) Total lean mass. (G) Hematoxylin-eosin staining of iBAT sections, (H) lipid droplet (LD) number and (I) LD average area measurements. (J) Oxygen consumption increase (ΔVO2) upon norepinephrine injection (NE) and (K) area under the curve quantification in anesthetized mice at 30°C. LoxP or KOMyf5 mice were acclimated to 30°C and to the indicated diet for 2 months before performing the experiment (n = 5–9 LoxP or KOMyf5 mice subjected to a CD and n = 7–9 LoxP or KOMyf5 mice subjected to a HFD). Data are mean ± SEM. *p < 0.05 vs. LoxP control group. Scale bar: 100 μm.
Figure 8.
Figure 8.
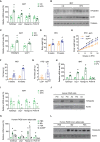
TP53INP2 expression in brown adipose tissue is modulated by thermogenesis. (A) Tp53inp2, Ucp1, Ppargc1a and Prdm16 mRNA levels (n = 4–6), (B) TP53INP2 and UCP1 protein abundance and (C) quantification (n = 5–6) in iBAT from control mice subjected to a chow diet (CD) or a high-fat diet (HFD) for 16 weeks. Panels (D) to (G): control (LoxP) and KOMyf5 male mice housed at 22°C and subjected to a HFD for a total of 16 weeks (n = 6–10 LoxP or KOMyf5 mice). (D) Body weight. (E) Body weight gain. (F) Total fat mass. (G) Fat mass gain from 8 to 16 weeks of HFD. (H) Tp53inp2, Ucp1, Ppargc1a and Prdm16 mRNA levels in iBAT from control mice housed at 22°C or 4°C for 10 h (n = 4–5). (I) Tp53inp2, Ucp1, Ppargc1a and Prdm16 mRNA levels in iBAT from control mice housed at 22°C or at 30ºC for 5 months (n = 5–6). (J) TP53INP2 protein abundance in human PAZ6 preadipocytes (Pre) or differentiated adipocytes (Ad) (n = 3). (K) Tp53inp2, Ucp1, Ppargc1a and Prdm16 mRNA levels in mature human PAZ6 brown adipocytes treated with vehicle (PBS), with 8-bromo-cAMP (8br), with forskolin (FSK) or with dibutyryl-cAMP (dcAMP) for 4 h (n = 3). (L) TP53INP2 protein abundance in mature human PAZ6 brown adipocytes treated with PBS, 8br or FSK for 4 h (n = 3). Data are mean ± SEM. *p < 0.05 vs. control group in each case.

References

    1. Chouchani ET, Kazak L, Spiegelman BM.. New advances in adaptive thermogenesis: UCP1 and beyond. Cell Metab. 2019;29(1):27–37. - PubMed
    1. Nedergaard J, Cannon B. Brown adipose tissue as a heat-producing thermoeffector. Handb Clin Neurol. 2018;156:137–152. - PubMed
    1. Virtanen KA, Lidell ME, Orava J, et al. Functional brown adipose tissue in healthy adults. N Engl J Med. 2009;360(15):1518–1525. DOI:10.1056/NEJMoa0808949. - DOI - PubMed
    1. Nedergaard J, Bengtsson T, Cannon B. Unexpected evidence for active brown adipose tissue in adult humans. Am J Physiol Endocrinol Metab. 2007;293(2):E444–52. - PubMed
    1. Wd VML, Vanhommerig JW, Smulders NM, et al. Cold-activated brown adipose tissue in healthy men. N Engl J Med. 2009;360(15):1500–1508. DOI:10.1056/NEJMoa0808718. - DOI - PubMed

Publication types