. 2022 Aug 16;119(33):e2203203119.
doi: 10.1073/pnas.2203203119. Epub 2022 Aug 10.

Host translesion polymerases are required for viral genome integrity

Affiliations

Host translesion polymerases are required for viral genome integrity

Sebastian Zeltzer et al. Proc Natl Acad Sci U S A. .

Abstract

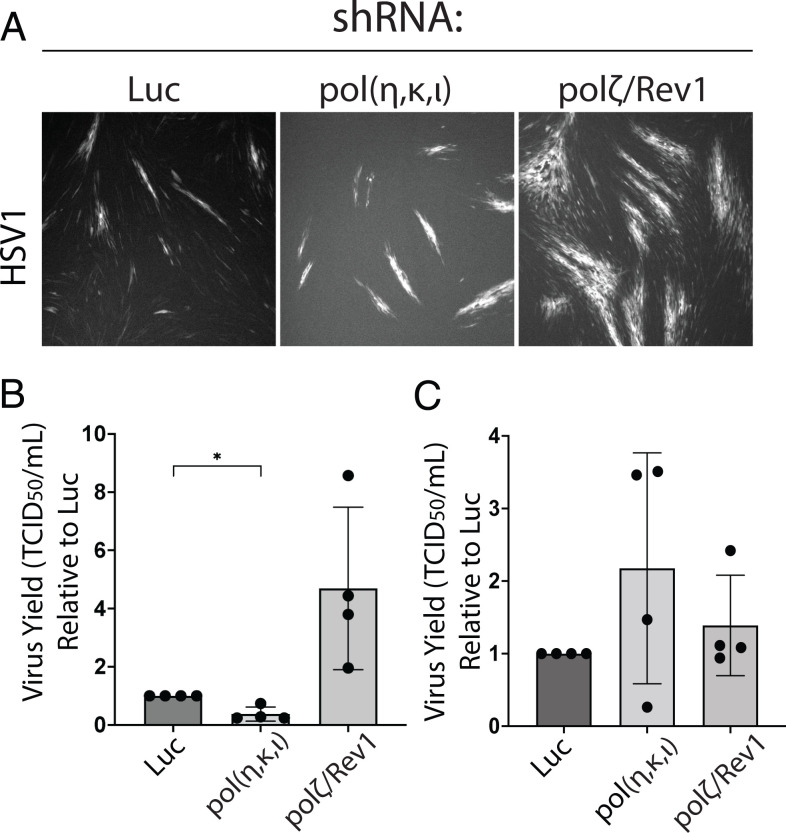
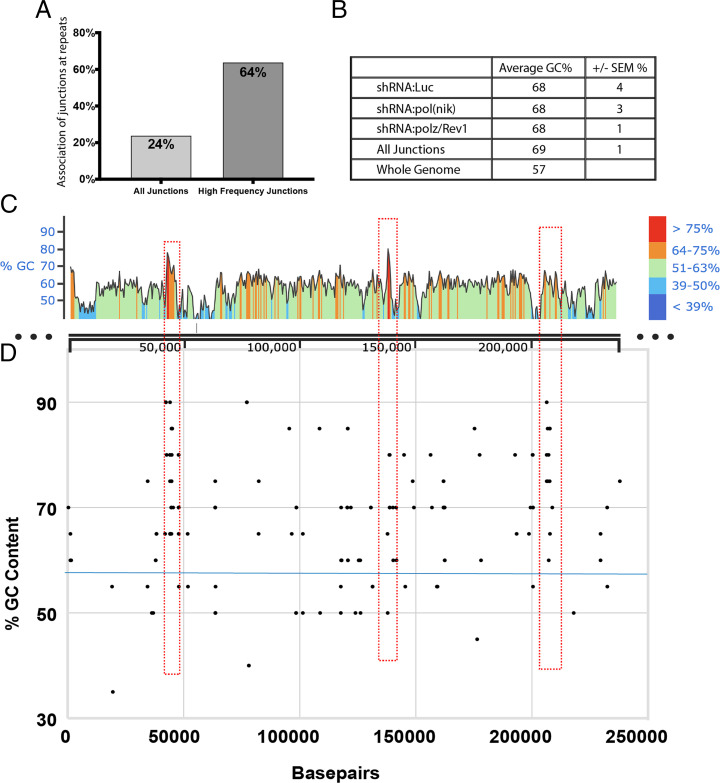
Human cells encode up to 15 DNA polymerases with specialized functions in chromosomal DNA synthesis and damage repair. In contrast, complex DNA viruses, such as those of the herpesviridae family, encode a single B-family DNA polymerase. This disparity raises the possibility that DNA viruses may rely on host polymerases for synthesis through complex DNA geometries. We tested the importance of error-prone Y-family polymerases involved in translesion synthesis (TLS) to human cytomegalovirus (HCMV) infection. We find most Y-family polymerases involved in the nucleotide insertion and bypass of lesions restrict HCMV genome synthesis and replication. In contrast, other TLS polymerases, such as the polymerase ζ complex, which extends past lesions, was required for optimal genome synthesis and replication. Depletion of either the polζ complex or the suite of insertion polymerases demonstrate that TLS polymerases suppress the frequency of viral genome rearrangements, particularly at GC-rich sites and repeat sequences. Moreover, while distinct from HCMV, replication of the related herpes simplex virus type 1 is impacted by host TLS polymerases, suggesting a broader requirement for host polymerases for DNA virus replication. These findings reveal an unexpected role for host DNA polymerases in ensuring viral genome stability.

Keywords: DNA repair; TLS polymerase; cytomegalovirus; genome replication; herpesvirus.


Conflict of interest statement

The authors declare no competing interest.

Figures

Fig. 1.
Fig. 1.
Infection with HCMV results in TLS pol recruitment to RCs. Fibroblasts were mock-infected or infected with HCMV TB40/E at a multiplicity of infection (MOI) of 1. (A) At 72 h postinfection (HPI), cells were fixed and processed for immunofluorescence. All polymerases (green) indicated were indirectly detected with monoclonal antibodies specific to each. RCs (red) were labeled using antibody to pUL44 in the case of polη, polι, or Rev1or FANDC2 in the case of polκ, and secondary antibodies were conjugated to Alexa Fluor 546 (green) or 647 (red). Coverslips were imaged using a DeltaVision deconvolution microscope. All images correspond to a single focal plane. A merged image with a higher-magnification inset of each channel plus DAPI staining to indicate nuclei is shown on the right of single-color panels. Magnification: 600×. (BG) Uninfected or HCMV-infected cell lysates were collected at 24, 48, 72, and 96 HPI to analyze PCNA by immunoblotting using monoclonal antibodies. Immediate-early proteins (IE1 and IE2) are shown as a control for infection and tubulin is used as a loading control. (B) Total PCNA was analyzed over time in uninfected of HCMV-infected cells. (C) PCNA band intensity was quantified and normalized to tubulin and then to that of uninfected cells at 24 HPI. (D) Ub-PCNA was analyzed over time. (E) The ratio of Ub-PCNA to PCNA band intensity was quantified and normalized to tubulin at each time point. (F) Lysates were prepared from free, soluble (F lanes) and nuclear, chromatin-bound (N lanes) fractions isolated over a time course of infection. Tubulin and lamin serve as fractionation and loading controls. (G) PCNA band intensity was quantified and normalized to tubulin and then to that of uninfected cells at 24 HPI. (G) Ub-PCNA band intensity was normalized to tubulin for soluble fractions and lamin for chromatin bound fractions. The y axis depicts a ratio of chromatin bound to soluble Ub-PCNA. Bars on all graphs for quantifications represent the average over three or more independent replicates with SD shown, except for 96 HPI in F represents two replicates. Statistical significance was determined by two-way ANOVA with Tukey’s multiple comparisons test in C and G. In E, statistical significance was determined with two-tailed, paired t test with Bonferroni’s correction. Asterisks (**P < 0.001, ***P < 0.0001) represent statistically significant differences determined in three or more independent experiments. (H) PCNA (green) and pUL44 (red) were localized using monoclonal antibodies to each and secondary antibodies conjugated to Alexa Fluor 546 (green) or 647 (red) and imaged as described for A.
Fig. 2.
Fig. 2.
Y-family polymerases differentially influence HCMV replication. (AC) Growth-arrested primary fibroblasts were transduced with shRNA lentiviruses targeting Luc or respective Y-family polymerase: polη, polι, polκ, or Rev1. Forty-eight hours later media was refreshed with puromycin at 2 μg/mL to select for transduced cells. (A) Twenty-four hours later, cells were infected with HCMV at an MOI of 0.001. Cells were lysed at 16 d postinfection (DPI) and RNA was processed for reverse-transcriptase-qPCR (RT-qPCR). Relative knockdown of transcripts was determined using ΔΔCt analysis between luciferase and experimental conditions. The housekeeping transcript, H6PD, was used as a control for cell number. Absolute values are an average of three to five replicates of 2ΔΔCt. (B and C) Following transduction, as described above, knockdown cells were infected with HCMV at an MOI of 0.001 and cells were lysed at 16 DPI. (B) Viral genome copy number for each knockdown was determined by qPCR using a BAC standard curve and a primer to the β2.7 region of the viral genome relative to the luciferase knockdown control. (C) Viral yields were measured by TCID50 and normalized to Luc control. (D) Growth-arrested fibroblasts were transduced with shRNA lentiviruses targeting Luc or the combined insertion pol(η,κ,ι) at cumulative MOI of 9. Forty-eight hours later media was refreshed with puromycin at 2 μg/mL; 24 h later, cells were infected with HCMV TB40/E at an MOI of 1. Lysates were collected at 4 DPI and viral titers determined by TCID50. (AD) Bars represents the average of three to six independent experiments where dots represent each independent replicate. Statistical significance was determined by two-tailed, paired t test with Bonferroni correction; asterisks (*P < 0.01, **P < 0.001, ***P < 0.0001) represent statistically significant differences relative to the Luc.
Fig. 3.
Fig. 3.
Rev1 and polζ facilitate HCMV replication. (AC) Growth-arrested primary MRC5 fibroblasts were transduced with shRNA lentiviruses against Luc, or Rev3L or Rev7 at an MOI of 3. Forty-eight hours later, media was refreshed with puromycin at 2 μg/mL; 24 h later, cells were infected with HCMV at an MOI of 0.001. (A) RNA was isolated for cDNA synthesis at 20 DPI. Knockdown was quantified by RT-qPCR as described in Fig. 2A. (B and C) Knockdown cells indicated were infected with HCMV at an MOI of 0.001 and cells were lysed at 16 DPI. (B) Viral genome copy number for each knockdown was determined by qPCR using a BAC standard curve and a primer to the β2.7 region of the viral genome relative to the Luc knockdown control. (C) Viral yields were measured by TCID50 and normalized to Luc control. (D and E) Growth-arrested fibroblasts were transduced with shRNA lentiviruses targeting Luc or the combined Rev3L + Rev7 (polζ) and Rev1 at a cumulative MOI of 9. Forty-eight hours later media was refreshed with puromycin at 2 μg/mL; 24 h later, cells were infected with HCMV TB40/E at an MOI of 1. Lysates were collected at 4 DPI and (D) genome copy number and (E) viral titers were determined as described above. (AE) Bars represent an average of three to six independent experiments and dots represent the data point for each replicate. Statistical significance was determined by two-tailed, paired t test with Bonferroni correction. Asterisks (*P < 0.01; **P < 0.001, ***P < 0.0001) represent statistically significant differences determined in three or more independent experiments. (F) Fibroblasts uninfected or infected with HCMV at an MOI of 1. At 72 HPI, cells were fixed and processed for immunofluorescence. UL44 or Rev3L were indirectly detected using monoclonal antibodies to Rev3L or UL44 and secondary antibodies were conjugated to Alexa Fluor 546 (green) or 647 (red). Coverslips were imaged using a DeltaVision deconvolution microscope. A merged image with a high magnification. Inset of each channel plus DAPI staining to indicate nuclei is shown on the right of single-color panels.
Fig. 4.
Fig. 4.
Y-family polymerases differentially influence the replication of other DNA viruses. Growth-arrested fibroblasts were transduced with shRNA lentiviruses targeting Luc, insertion pol(η,κ,ι) or postinsertion polζ/Rev1 at a cumulative MOI of 9. Forty-eight hours later media was refreshed with puromycin at 2 μg/mL; 24 h later, cells were infected with HSV-1 (expressing GFP as a marker for infection) or vaccinia at an MOI of 0.01. (A) Images of the monolayer of cells infected with HSV1 at 33 HPI (200×). (B and C) Viral titers were measured at 33 HPI by TCID50 for (B) HSV-1 and (C) vaccinia. Bars represent the average of four independent experiments and dots represent individual replicates. Statistical significance was determined by a two-tailed, paired t test with Bonferonni’s correction, Asterisks (*P < 0.01) represent statistically significant differences from the Luc control.
Fig. 5.
Fig. 5.
Host TLS polymerases contribute to viral genome integrity. Growth-arrested fibroblasts were transduced with shRNA lentiviruses against Luc, insertion pol(η,κ,ι), or extension polζ/Rev1 at a cumulative MOI of 9. Forty-eight hours later, media was refreshed with puromycin at 2 μg/mL; 24 h later, cells were infected with HCMV at an MOI of 1 and total DNA was isolated at 4 DPI for sequencing. Sequences from each knockdown condition as well as from the V1 stock were aligned to the TB40/E-GFP reference genome sequence. (A) Mean novel junction frequency within each condition. HCMV genomic coordinates are plotted along the circular axis in graphs for Luc, pol(η,κ,ι), and polζ/Rev1 and the UL (orange) and US (green) regions of the genome are marked. The arcs connect novel junction points detected at the average frequency for the given condition indicated by the color scale. (B) Quantification of the number of novel junctions detected per sample (n = 6) for each condition. (C) Quantification of the number of novel SNVs (point mutations, deletions, or insertions) detected per sample (n = 6) for each condition. Statistical significance was determined by pairwise two-sided exact Poisson tests and adjusted using Bonferroni correction (ns, P > 0.05; *P < 0.05; ***P < 0.001).
Fig. 6.
Fig. 6.
HCMV genome rearrangement junction sites occur at GC-rich regions. (A) Proportion of novel junctions associated with repeat sequences, as defined by whether 20 bp on either side of the novel junction is found more than once in the reference genome with 100% identity. (B) Average percent GC content for whole HCMV reference genome and 20-nucleotides on both sides of novel junctions (±SEM, SEM). (C) Percent HCMV GC content and heat map calculated for 25-nucleotide sliding window (using Snapgene 6.0). (D) Percent GC content of each 20-nucleotide sequence flanking novel junctions plotted over their reference genome base pair coordinates. Blue horizontal line indicates 57% genome average GC content. Red dotted rectangles highlight regions of high GC content overlapping clusters of novel junctions.

Similar articles

Cited by

References

    1. Goodman M. F., Woodgate R., Translesion DNA polymerases. Cold Spring Harb. Perspect. Biol. 5, a010363 (2013). - PMC - PubMed
    1. Bębenek A., Ziuzia-Graczyk I., Fidelity of DNA replication-a matter of proofreading. Curr. Genet. 64, 985–996 (2018). - PMC - PubMed
    1. Xia S., Konigsberg W. H., RB69 DNA polymerase structure, kinetics, and fidelity. Biochemistry 53, 2752–2767 (2014). - PMC - PubMed
    1. Ling H., Boudsocq F., Woodgate R., Yang W., Crystal structure of a Y-family DNA polymerase in action: A mechanism for error-prone and lesion-bypass replication. Cell 107, 91–102 (2001). - PubMed
    1. Sertic S., et al. , Coordinated activity of Y family TLS polymerases and EXO1 protects non-S phase cells from UV-induced cytotoxic lesions. Mol. Cell 70, 34–47.e4 (2018). - PubMed

Publication types

Substances

LinkOut - more resources