. 2022 Aug 16;119(33):e2114734119.
doi: 10.1073/pnas.2114734119. Epub 2022 Aug 10.

An intermediate-effect size variant in UMOD confers risk for chronic kidney disease

Affiliations

An intermediate-effect size variant in UMOD confers risk for chronic kidney disease

Eric Olinger et al. Proc Natl Acad Sci U S A. .

Abstract

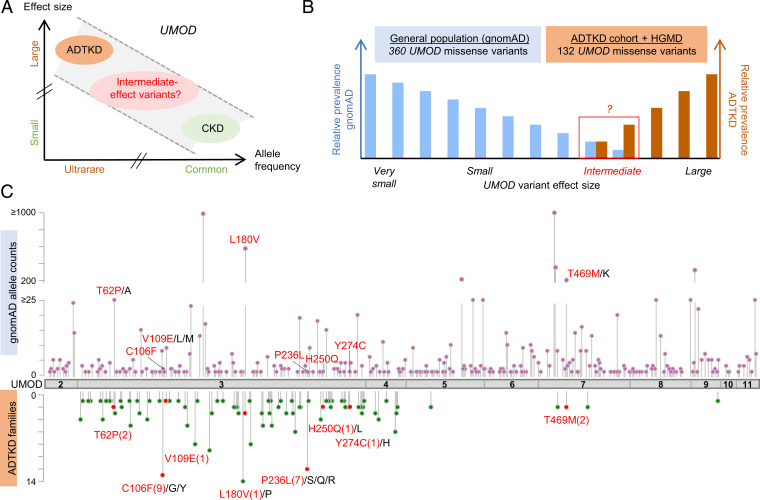
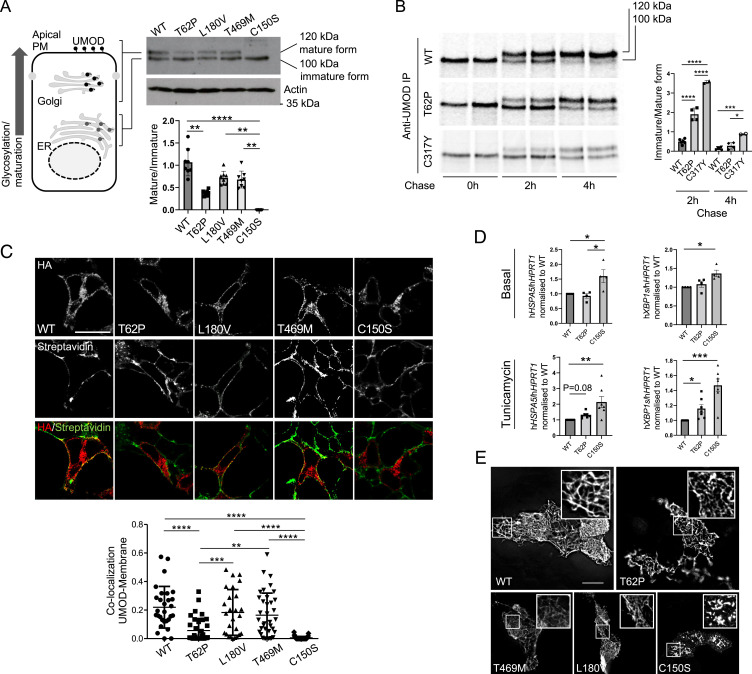
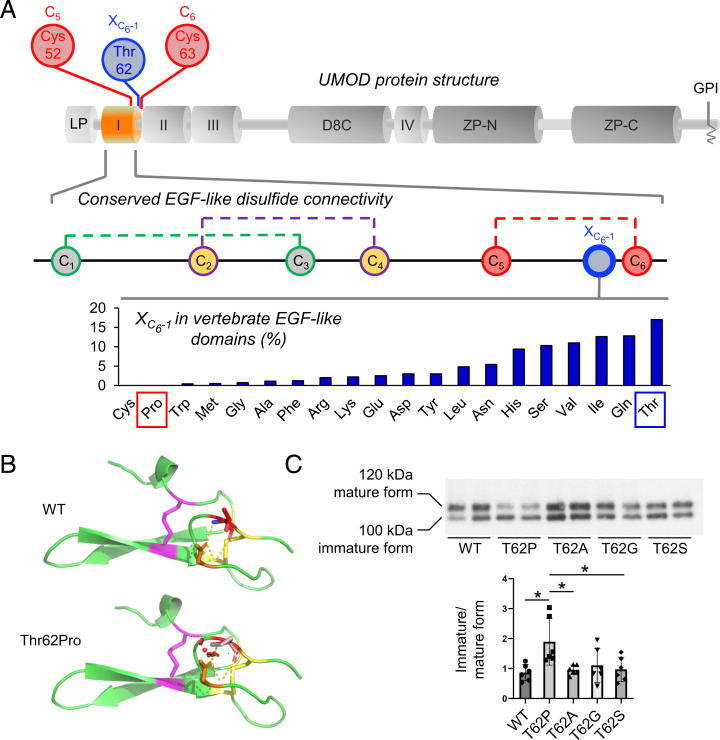
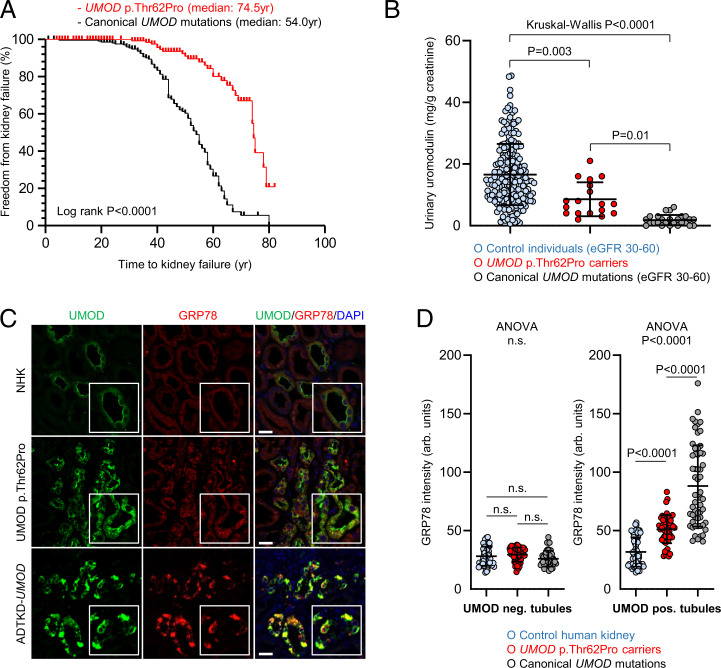
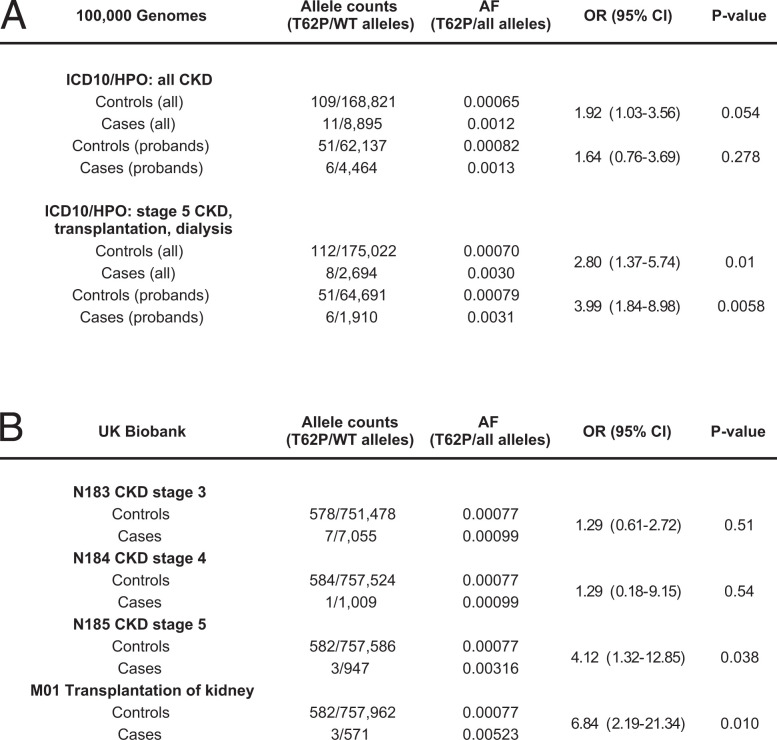
The kidney-specific gene UMOD encodes for uromodulin, the most abundant protein excreted in normal urine. Rare large-effect variants in UMOD cause autosomal dominant tubulointerstitial kidney disease (ADTKD), while common low-impact variants strongly associate with kidney function and the risk of chronic kidney disease (CKD) in the general population. It is unknown whether intermediate-effect variants in UMOD contribute to CKD. Here, candidate intermediate-effect UMOD variants were identified using large-population and ADTKD cohorts. Biological and phenotypical effects were investigated using cell models, in silico simulations, patient samples, and international databases and biobanks. Eight UMOD missense variants reported in ADTKD are present in the Genome Aggregation Database (gnomAD), with minor allele frequency (MAF) ranging from 10-5 to 10-3. Among them, the missense variant p.Thr62Pro is detected in ∼1/1,000 individuals of European ancestry, shows incomplete penetrance but a high genetic load in familial clusters of CKD, and is associated with kidney failure in the 100,000 Genomes Project (odds ratio [OR] = 3.99 [1.84 to 8.98]) and the UK Biobank (OR = 4.12 [1.32 to 12.85). Compared with canonical ADTKD mutations, the p.Thr62Pro carriers displayed reduced disease severity, with slower progression of CKD and an intermediate reduction of urinary uromodulin levels, in line with an intermediate trafficking defect in vitro and modest induction of endoplasmic reticulum (ER) stress. Identification of an intermediate-effect UMOD variant completes the spectrum of UMOD-associated kidney diseases and provides insights into the mechanisms of ADTKD and the genetic architecture of CKD.

Keywords: Autosomal Dominant Tubulointerstitial Kidney Disease; ER stress; genetic architecture; rare disease; uromodulin.


Conflict of interest statement

The authors declare no competing interest.

Figures

Fig. 1.
Fig. 1.
Identification of intermediate-effect UMOD variants. (A) Genetic architecture of UMOD-associated diseases showing the continuum of CKD risk associated with ultrarare (AF < 10−4) high-effect to common (AF > 0.05) low-effect UMOD variants. Adapted from ref. . (B) Schematic representation of the study design; 360 distinct missense UMOD variants are reported in the gnomAD with an individual AF of 2.0 × 10⁻² to 3.6 × 10⁻⁶, and 132 distinct missense UMOD variants reported in ADTKD-UMOD have been extracted from the International ADTKD Cohort (726 patients from 585 families) and from the HGMD. The theoretical maximum credible AF of high-effect UMOD variants (pathogenic) in the overall population considering the disease prevalence, allelic and genetic heterogeneity, and a penetrance of 100% is estimated to be 1 × 10⁻⁷ (46) (SI Appendix), excluding those (in theory) from gnomAD. Plotted here are the expected relative prevalences of very small– to large–effect size UMOD variants in gnomAD and reported in ADTKD-UMOD patients. Conferring nonfully penetrant ADTKD or reduced disease expressivity, intermediate-effect UMOD variants might be found overlapping at the lower prevalence spectrum in both gnomAD and reported variants in ADTKD-UMOD. (C) The UMOD protein (NM_003361) is in gray with exon boundaries marked by dotted lines. UMOD missense variants reported in the gnomAD consortium are plotted on top of the protein with respect to the amino acid position. The y axis represents gnomAD allele counts. UMOD missense variants reported in the International ADTKD Cohort and in HGMD are plotted below the protein. The y axis represents the number of reported families. Variants that are reported both in gnomAD and in at least one ADTKD family are marked in red (with family numbers in parentheses). Protein and variant visualization used ProteinPaint (47) and cBioPortal MutationMapper (48, 49).
Fig. 2.
Fig. 2.
p.Thr62Pro substitution induces intermediate UMOD trafficking and maturation defect. (A) Western blot analysis of UMOD expression in HEK293 cells 6 h after transfection of the indicated UMOD isoforms. Actin is shown as a loading control. The graph represents the ratio of Golgi glycosylated form (mature) to ER glycosylated form (immature). Bars indicate mean ± SD. n = 8 independent experiments. **P < 0.01 using the Kruskal–Wallis test (P < 0.0001) followed by Dunn’s multiple comparison test; ****P < 0.0001 using the Kruskal–Wallis test (P < 0.0001) followed by Dunn’s multiple comparison test. (B) Pulse chase experiments performed in HEK293 cells stably expressing the indicated UMOD isoform. The maturation to fully glycosylated protein is delayed for the p.Thr62Pro isoform compared with the wild-type (WT) one, but it is more efficient than the one observed for the p.Cys317Tyr mutant. Bars indicate the mean ± SD of the ratio of immature to mature form. n = 6, 4, and 2 for WT, p.Thr62Pro, and p.Cys317Tyr, respectively. *P < 0.05 using one-way ANOVA (P < 0.0001) followed by Bonferroni’s multiple comparison test; ***P < 0.001 using one-way ANOVA (P < 0.0001) followed by Bonferroni’s multiple comparison test; ****P < 0.0001 using one-way ANOVA (P < 0.0001) followed by Bonferroni’s multiple comparison test. IP, immunoprecipitation (C) Immunofluorescence analysis of HEK293 cells 10 h after transfection with the indicated UMOD isoform. UMOD is seen in red (stained with HA), and the plasma membrane (PM) is in green (stained with streptavidin-FITC after biotinylation) in the merged picture. The graph reports the Mander’s 2 coefficient as a readout for UMOD at the PM. The mean ± SD is indicated. (Scale bar, 10 µm.) **P < 0.01 using one-way ANOVA (P < 0.0001) followed by Bonferroni’s multiple comparison test; ***P < 0.001 using one-way ANOVA (P < 0.0001) followed by Bonferroni’s multiple comparison test; ****P < 0.0001 using one-way ANOVA (P < 0.0001) followed by Bonferroni’s multiple comparison test. HA, hemagglutinin; FITC, fluorescein isothiocyanate. (D) GRP78 (HSPA5) and spliced XBP1 (XBP1s) expression assessed by real-time qPCR in HEK293 cells expressing the indicated UMOD isoform in the basal condition (Upper) or after 12 h of treatment with a low dose of tunicamycin (Lower). Expression is normalized to HPRT1, and bars indicate mean ± SEM. *P < 0.05 using the Kruskal–Wallis test (baseline: P = 0.009 HSPA5, P = 0.003 XBP1s; tunicamycin: P = 0.0009 HSPA5, P < 0.0001 XBP1s) followed by Dunn’s multiple comparison test (n = 4 to 7 independent experiments); **P < 0.01 using the Kruskal–Wallis test (baseline: P = 0.009 HSPA5, P = 0.003 XBP1s; tunicamycin: P = 0.0009 HSPA5, P < 0.0001 XBP1s) followed by Dunn’s multiple comparison test (n = 4 to 7 independent experiments); ***P < 0.001 using the Kruskal–Wallis test (baseline: P = 0.009 HSPA5, P = 0.003 XBP1s; tunicamycin: P = 0.0009 HSPA5, P < 0.0001 XBP1s) followed by Dunn’s multiple comparison test (n = 4 to 7 independent experiments). (E) Immunofluorescence analysis of unpermeabilized MDCK cells stably showing the indicated UMOD isoform at the PM. Insets show UMOD polymers at higher magnification. All the analyzed variants form polymers on the PM, while the pathogenic ADTKD mutant p.Cys150Ser forms aggregates. (Scale bar, 10 µm.)
Fig. 3.
Fig. 3.
Modeling of the p.Thr62Pro impact on protein structure. (A, Top) Schematic representation of the UMOD domain structure. The EGF-like domain 1 is shown in orange; the positions of Cys52 and Cys63, predicted to form a disulphide bond, and of neighboring Thr62 are shown. D8C, domain with eight cysteines; GPI, glycosylphosphatidylinositol anchoring site; I to IV, EGF-like domains; LP, leader peptide; ZP, bipartite zona pellucida domain. (A, Middle) Schematic representation of the EGF-like domain showing the conserved disulphide bond connectivity (C1 to C3, C2 to C4, C5 to C6; data from PROSITE documentation PDOC00021). The position corresponding to Thr62 in UMOD is indicated in blue (one amino acid before the sixth cysteine, XC6-1). (A, Bottom) Vertebrate EGF-like domain sequences from protein families database (Pfam) family PF12947 (8,511 sequences) were aligned, and the frequency of residues at the position preceding C6 (XC6-1) was calculated. Pro and Cys are the only amino acids that are never found, strongly suggesting a damaging effect of Pro at this position. Note that Thr is the most frequently encountered amino acid at position XC6-1. (B) Modeling of the UMOD p.Thr62Pro isoform. Polar contacts are indicated by yellow dashed lines. Clashes in the structure are represented by red dots and are visible only in the p.Thr62Pro isoform. The figure was made with PyMOL (Schrödinger LLC). (C) Western blot analysis for UMOD in cell lysates from HEK293 cells transiently transfected with the indicated UMOD isoforms. The immature and mature forms of UMOD proteins are indicated on the left. The ratios of the intensities of immature to mature forms are indicated below. Bars indicate mean ± SD. Note that only the proline substitution increases the ratio of immature to mature forms, indicating defective trafficking. n = 6 independent experiments. WT, wild type. *P < 0.05 using one-way ANOVA (P = 0.0077) followed by Bonferroni’s multiple comparison test.
Fig. 4.
Fig. 4.
Mild kidney disease phenotype and intermediate UMOD trafficking defect and ER stress in p.Thr62Pro carriers. (A) Kaplan–Meier curves of renal survival in all p.Thr62Pro carriers identified in Genomics England 100,000 Genomes Project data and in p.Thr62Pro-positive families/cases with CKD (n = 157) compared with ADTKD-UMOD patients from the International ADTKD Cohort (n = 225). Only patients with confirmed p.Thr62Pro status have been included in the analysis. Median age at kidney failure was 74.5 y in UMOD p.Thr62Pro carriers and 54.0 y in ADTKD-UMOD patients with canonical UMOD mutations. (B) Urinary UMOD levels normalized to urinary creatinine are depicted for control individuals matched for eGFR (30 to 60 mL/min per 1.73 m2), UMOD p.Thr62Pro carriers, and ADTKD-UMOD patients with canonical UMOD mutations matched for eGFR (30 to 60 mL/min per 1.73 m2). Outlier removal was performed using Robust regression and Outlier removal (ROUT) method (Q = 1%). The graph depicts individual values, and bars indicate mean ± SD. The Kruskal–Wallis test was used with Dunn's multiple comparisons test. (C) Immunofluorescence staining for UMOD (green) and GRP78 (red) in normal human kidney (NHK; from a tumor nephrectomy), a UMOD p.Thr62Pro human kidney biopsy, and kidney tissue from an ADTKD-UMOD patient with a canonical UMOD mutation (p.Arg185Ser). Insets show UMOD-expressing tubules at higher magnification. DAPI, 4′,6-diamidino-2-phenylindole. (Scale bars, 25 μm). (D) Quantification of the fluorescent signal intensity for ER stress–associated GRP78 in UMOD-negative and UMOD-positive tubules from three NHK samples (tumor nephrectomy), three p.Thr62Pro kidney biopsies, and three ADTKD-UMOD kidney samples. Further details can be found in SI Appendix, Table S9. The graph depicts tubule values in arbitrary units, and bars indicate mean ± SD. One-way ANOVA was followed by Tukey’s multiple comparison test. ns, not significant.
Fig. 5.
Fig. 5.
UMOD p.Thr62Pro confers risk for kidney disease in UK cohorts. (A) Prevalence of p.Thr62Pro alleles in all individuals and in probands from the Genomics England 100,000 Genomes Project with diagnoses of CKD (ICD10: N18 and/or HPO HP0012622 diagnoses, including mapped and descendant concepts) or kidney failure (ICD10: N185, Z940, Z491, and Y841 and/or HPO HP0003774 diagnoses, including mapped and descendant concepts) and in all control individuals or family probands in which these diagnoses are absent. P values were computed using Fisher’s exact test. (B) Prevalence of p.Thr62Pro alleles in unrelated White British controls and individuals with indicated kidney phenotypes in the UK Biobank SNP array data. P values were computed using Fisher’s exact test. WT, wild type. ICD10, International Classification of Diseases, Tenth Revision.

Comment in

Similar articles

Cited by

References

    1. Eckardt K.-U., et al. , Evolving importance of kidney disease: From subspecialty to global health burden. Lancet 382, 158–169 (2013). - PubMed
    1. Devuyst O., Pattaro C., The UMOD locus: Insights into the pathogenesis and prognosis of kidney disease. J. Am. Soc. Nephrol. 29, 713–726 (2018). - PMC - PubMed
    1. Tin A., Köttgen A., Genome-wide association studies of CKD and related traits. Clin. J. Am. Soc. Nephrol. 15, 1643–1656 (2020). - PMC - PubMed
    1. Wuttke M., et al. ; Lifelines Cohort Study; V. A. Million Veteran Program, A catalog of genetic loci associated with kidney function from analyses of a million individuals. Nat. Genet. 51, 957–972 (2019). - PMC - PubMed
    1. Trudu M., et al. ; SKIPOGH team, Common noncoding UMOD gene variants induce salt-sensitive hypertension and kidney damage by increasing uromodulin expression. Nat. Med. 19, 1655–1660 (2013). - PMC - PubMed

Publication types