. 2022 Aug 16;119(33):e2123146119.
doi: 10.1073/pnas.2123146119. Epub 2022 Aug 10.

The neuropeptide landscape of human prefrontal cortex

Affiliations

The neuropeptide landscape of human prefrontal cortex

Wen Zhong et al. Proc Natl Acad Sci U S A. .

Abstract

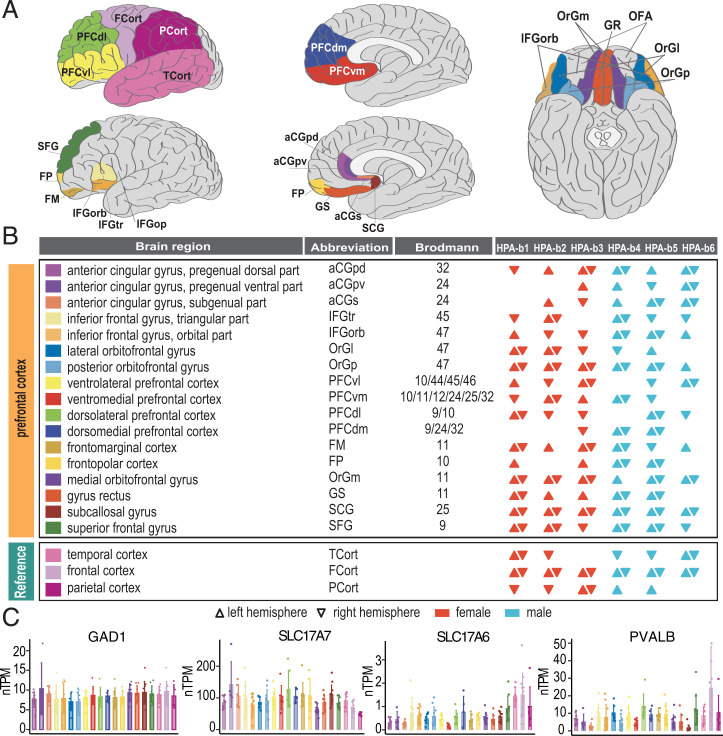
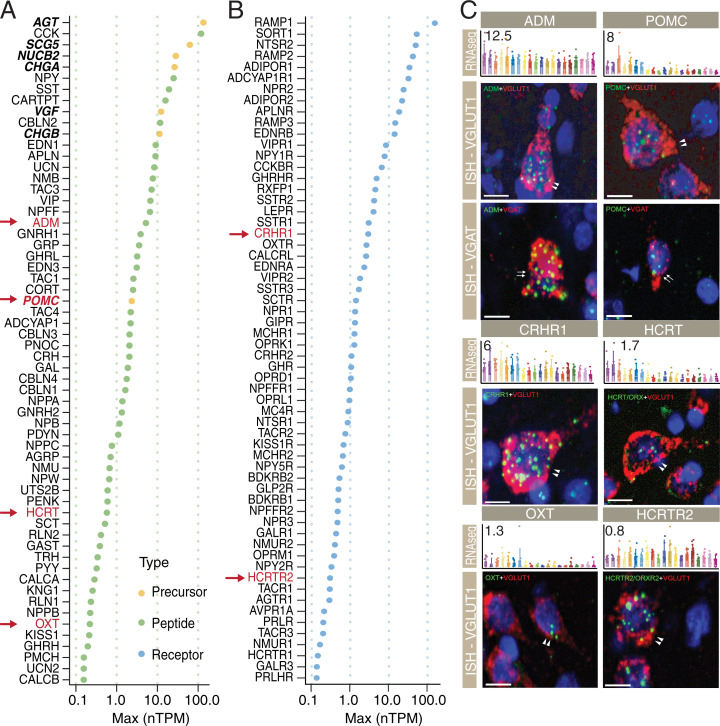
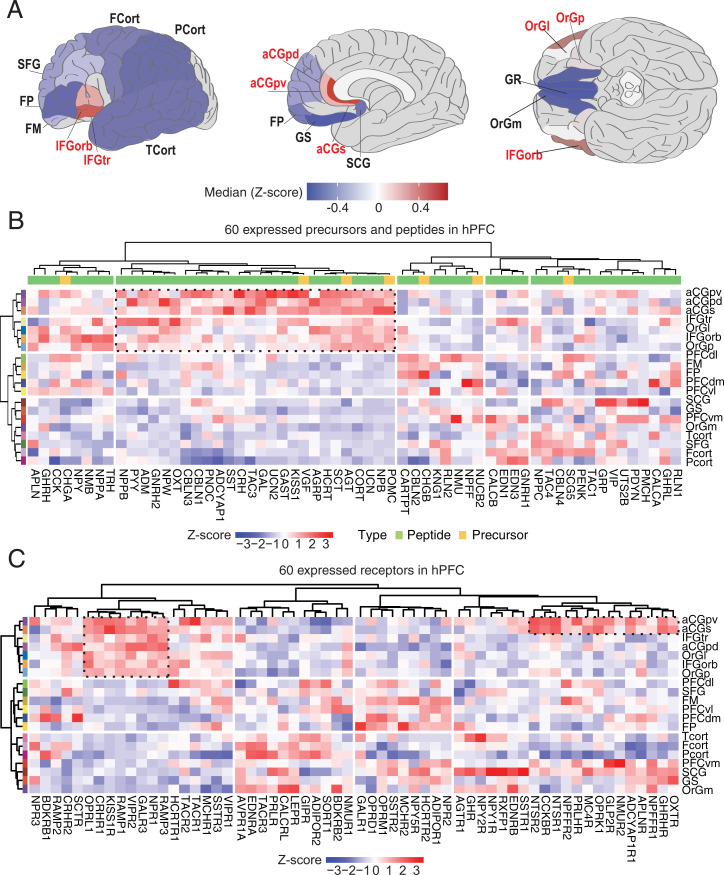
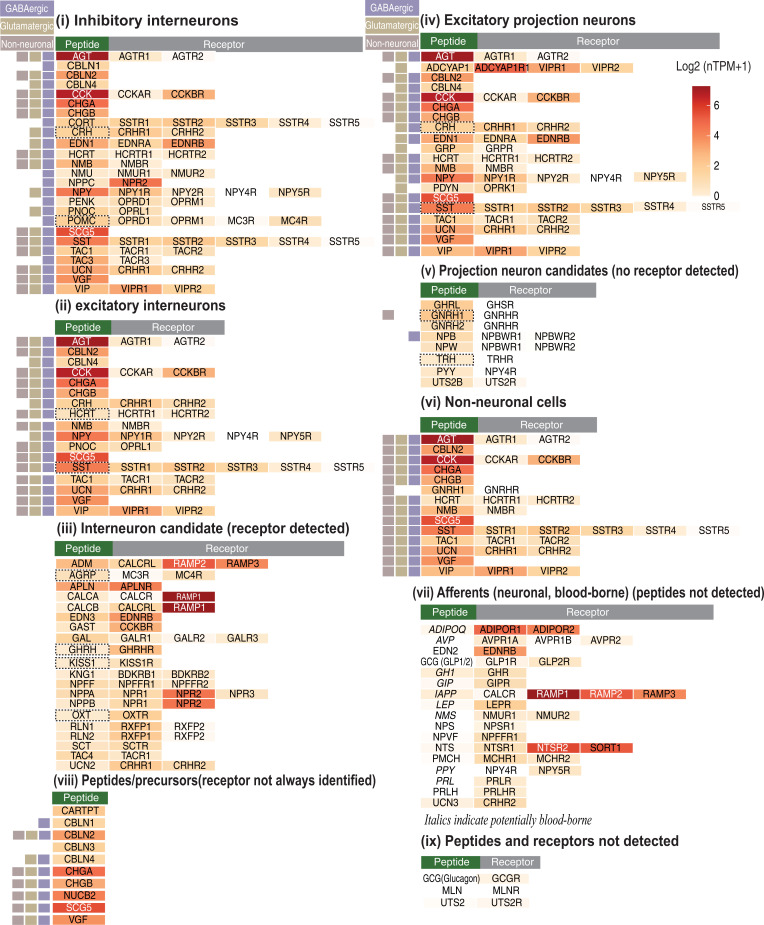
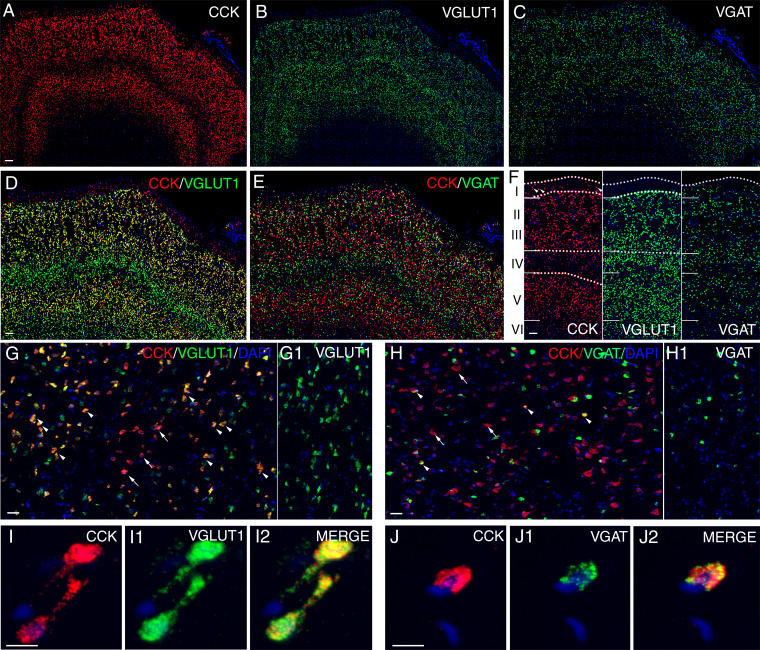
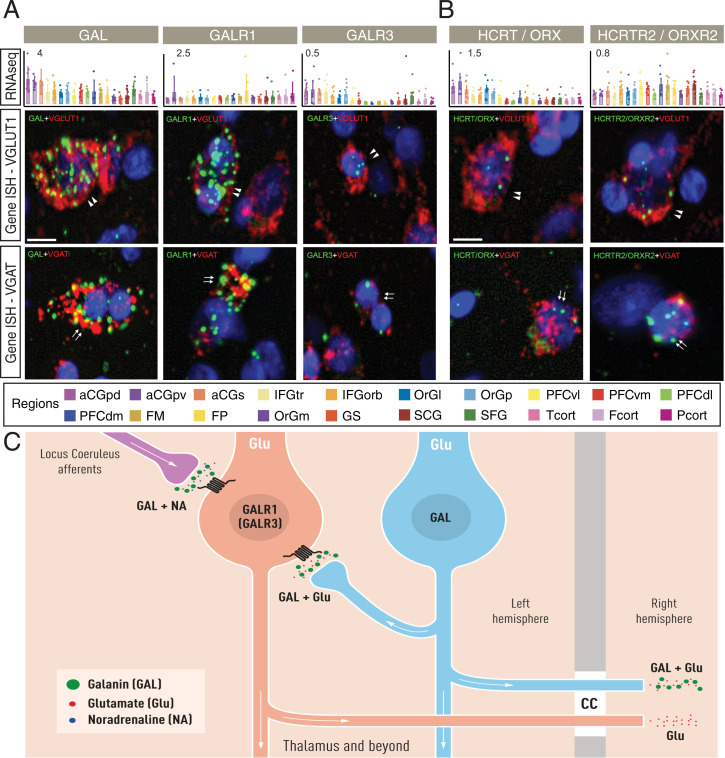
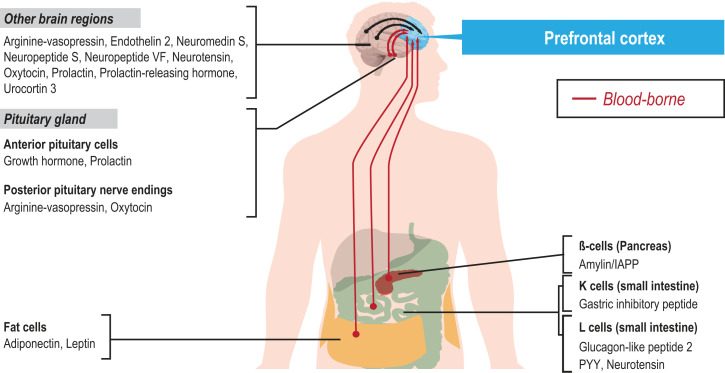
Human prefrontal cortex (hPFC) is a complex brain region involved in cognitive and emotional processes and several psychiatric disorders. Here, we present an overview of the distribution of the peptidergic systems in 17 subregions of hPFC and three reference cortices obtained by microdissection and based on RNA sequencing and RNAscope methods integrated with published single-cell transcriptomics data. We detected expression of 60 neuropeptides and 60 neuropeptide receptors in at least one of the hPFC subregions. The results reveal that the peptidergic landscape in PFC consists of closely located and functionally different subregions with unique peptide/transmitter-related profiles. Neuropeptide-rich PFC subregions were identified, encompassing regions from anterior cingulate cortex/orbitofrontal gyrus. Furthermore, marked differences in gene expression exist between different PFC regions (>5-fold; cocaine and amphetamine-regulated transcript peptide) as well as between PFC regions and reference regions, for example, for somatostatin and several receptors. We suggest that the present approach allows definition of, still hypothetical, microcircuits exemplified by glutamatergic neurons expressing a peptide cotransmitter either as an agonist (hypocretin/orexin) or antagonist (galanin). Specific neuropeptide receptors have been identified as possible targets for neuronal afferents and, interestingly, peripheral blood-borne peptide hormones (leptin, adiponectin, gastric inhibitory peptide, glucagon-like peptides, and peptide YY). Together with other recent publications, our results support the view that neuropeptide systems may play an important role in hPFC and underpin the concept that neuropeptide signaling helps stabilize circuit connectivity and fine-tune/modulate PFC functions executed during health and disease.

Keywords: RNA-seq; anterior cingulate cortex; classic neurotransmitter coexistence; in situ hybridization.


Conflict of interest statement

The authors declare no competing interest.

Figures

Fig. 1.
Fig. 1.
Transcriptomic analysis of the 17 microdissected PFC regions and 3 cortical reference regions. (A) Schematic overview of the 20 cortical subregions and the associated Broca areas. (B) A summary of the 165 included human brain samples (for technical details, see SI Appendix, Fig. S1). (C) Examples of expression profiles for three genes in 20 cortical subregions. Shown are bar plots for transcripts for GAD1, the GABA-synthesizing enzyme, the vesicular glutamate transporter VGLUT1 (SLC17A7) and VGLUT2 (SLC17A6), as well as the calcium-binding protein parvalbumin (PVALB) (note difference in levels, see http://v20.proteinatlas.org/humanproteome/brain for details regarding all 19,670 human protein-coding genes and their expression profiles in these subregions of PFC). Error bars represent mean ± SD.
Fig. 2.
Fig. 2.
Expression levels of NPs and NPRs in hPFC. (A) Maximum expression levels of detected NPs (n = 60). (B) Maximum expression levels of detected NPRs (n = 60). Genes with nTPM >0.1 were defined as detected genes. The color code indicates the type of genes (orange, precursor; green, NP; blue, NPR). Red arrows in A and B point to the transcripts studied with ISH in C. (C) Examples of expression profiles and in situ RNA hybridization data for adrenomedullin (ADM), proopiomelanocortin (POMC), corticotropin-releasing hormone receptor 1 (CRHR1), hypocretin NP/orexin precursor (HCRT), oxytocin (OXT), and HCRT/ORX receptor 2 (HCRTR2). The y axis represents the average nTPM values for each gene. The x axis represents the 20 human cortical subregions. Error bars represent mean ± SD. The color codes are the same as in Fig. 1B. Bar plots are examples of ISH results for each gene in the corresponding cell types. Color code: cell type analyzed, red; gene of interest, green. Arrowheads depict positive cells for VGLUT1 and arrows indicate VGAT-positive cells. (Scale bars, 5 μm.) The expression levels of exemplified NPs and NPRs with in situ RNA hybridization data are outlined in A and B with red arrows.
Fig. 3.
Fig. 3.
Regional variation of NPs and NPRs in hPFC. (A) Levels of NP transcripts in different cortical subregions as well as the localization of NP-rich regions (labeled in red). The color code indicates the median z score of all detected NPs (SI Appendix, Fig. S2B shows the distribution of z scores of NPs). (B) A heatmap presenting the expression patterns of 60 detected NP transcripts across the 20 cortical subregions. (C) A heatmap presenting the expression patterns of 60 detected NPR transcripts across the 20 cortical subregions.
Fig. 4.
Fig. 4.
Categorization of peptidergic cell types in ACC based on expression profiles of NPs and their NPRs. Overview of the gene expression of 78 NPs and their corresponding NPRs in ACC. The three boxes (Left) indicate the existence of the NPs in GABAergic, glutamatergic, and nonneuronal cells which were inferred from a published snRNA dataset of the hACC region from Khrameeva et al. (63). The color code of the heatmap indicates the expression levels of the NPs/NPRs in ACC. The hypothalamic NPs are outlined with dashed boxes.
Fig. 5.
Fig. 5.
Distribution of CCK, VGLUT1, and VGAT mRNA-positive cells in ACC. ISH was performed with RNAscope probes targeting CCK (red), VGLUT1 (green), and VGAT (green). Nuclei were counterstained with DAPI (blue) (AC). CCK mRNA was coexpressed in glutamatergic (D) as well as GABAergic (E) cells. Layer-specific expression of CCK, VGLUT1, and VGAT mRNA (F). Note the lack of CCK transcripts in lamina IV. Examples of coexpression of CCK with VGLUT1 (G) and VGAT (H) are indicated by arrowheads, and arrows represent CCK-only cells. CCK coexists much more frequently with VGLUT1 than with VGAT, and VGLUT1-positive cells (G1) are much more abundant than VGAT-positive cells (H1). High-magnification images at the single-cell level for CCK, VGLUT1, and VGAT (IJ2). (Scale bars, 100 μm [AF], 50 μm [G and H], and 5 μm [IJ2].) See Figshare for a higher-quality version of Fig. 5 (116).
Fig. 6.
Fig. 6.
Expression of the GAL system in ACC. (A) Bar plots showing the expression profiles of GAL and two of its receptors, GAL1R and GAL3R (the latter just above detectable threshold, nTPM >0.1, and only in ACC), in hPFC and reference cortical subregions. The y axis represents the consensus nTPM values for each gene. The x axis represents the 20 human cortical subregions (color code; Bottom). Error bars represent mean ± SD. Bar plots are ISH results for each gene in glutamatergic (VGLUT1) and GABAergic (VGAT) cells. Color code: cell type analyzed, red; gene of interest, green. (Scale bar, 5 μm.) (B) Bar plots showing the expression profiles of transcripts for HCRT/ORX and HCRTR2/ORXR2 in hPFC and reference cortical subregions. Color code: cell type analyzed, red; gene of interest, green. Arrowheads depict positive cells for VGLUT1 and arrows for VGAT-positive cells. (Scale bar, 5 μm.) (C) Schematic illustration of the GAL system (hypothesis). We speculate that GAL, released together with noradrenaline (NA) from afferents originating in locus coeruleus [established in rat experiments (97)], could act on glutamatergic, pyramidal neurons expressing GALR1 (or GALR3, expressed at very low levels). These receptors can also be targeted by GAL released from glutamatergic, pyramidal neurons. The potential projections of the pyramidal neurons described in this figure have been defined in some detail in SI Appendix, Fig. S6. The present cartoon is principally also valid for the HCRT/ORX system. However, its afferents originate in lateral hypothalamus and are glutamatergic [established in rat experiments (115)]. Both HCRT/ORX as well as the receptors are also expressed in glutamatergic, pyramidal cells (a detailed hypothesis is in SI Appendix, Fig. S7). Both GAL and HCRT/ORX peptides and receptors are in addition expressed in GABAergic interneurons, but are not included in this cartoon.
Fig. 7.
Fig. 7.
Peptides from diverse afferent sources. Schematic overview of the possible origins of afferent peptidergic inputs to hPFC. There are 16 NPs that cannot be detected in hPFC, contrasting with the presence of, often robust, receptor expression levels. These receptors are likely activated by peptides released from neurons outside hPFC (released from neuronal afferents or via volume transmission), or alternatively by blood-borne hormones from endocrine glands or fat cells.

References

    1. Fuster J., The Prefrontal Cortex (Academic Press, 2015).
    1. Dixon M. L., Thiruchselvam R., Todd R., Christoff K., Emotion and the prefrontal cortex: An integrative review. Psychol. Bull. 143, 1033–1081 (2017). - PubMed
    1. Price J. L., Drevets W. C., Neurocircuitry of mood disorders. Neuropsychopharmacology 35, 192–216 (2010). - PMC - PubMed
    1. Ingvar D. H., Franzén G., Abnormalities of cerebral blood flow distribution in patients with chronic schizophrenia. Acta Psychiatr. Scand. 50, 425–462 (1974). - PubMed
    1. Berman K. F., Weinberger D. R., The prefrontal cortex in schizophrenia and other neuropsychiatric diseases: In vivo physiological correlates of cognitive deficits. Prog. Brain Res. 85, 521–536, discussion 536–537 (1990). - PubMed

Publication types