. 2022 Aug 26;50(15):8441-8458.
doi: 10.1093/nar/gkac658.

Single base-pair resolution analysis of DNA binding motif with MoMotif reveals an oncogenic function of CTCF zinc-finger 1 mutation

Affiliations

Single base-pair resolution analysis of DNA binding motif with MoMotif reveals an oncogenic function of CTCF zinc-finger 1 mutation

Benjamin Lebeau et al. Nucleic Acids Res. .

Abstract

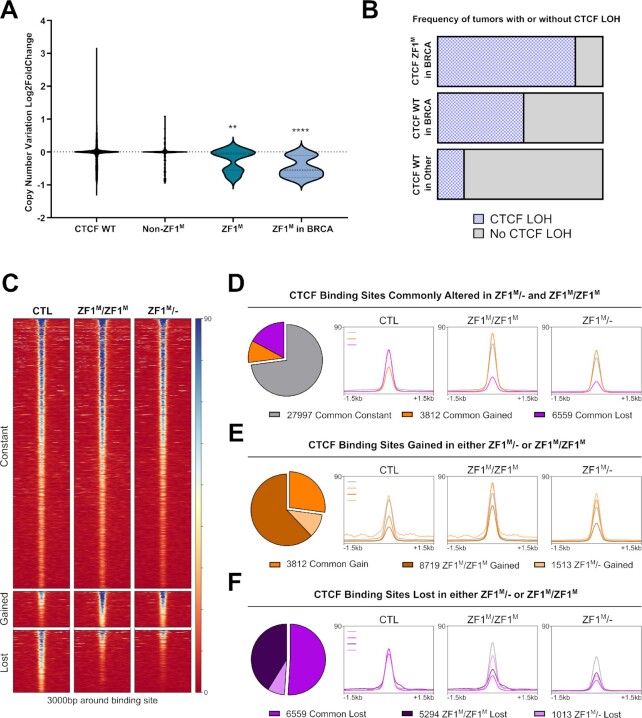
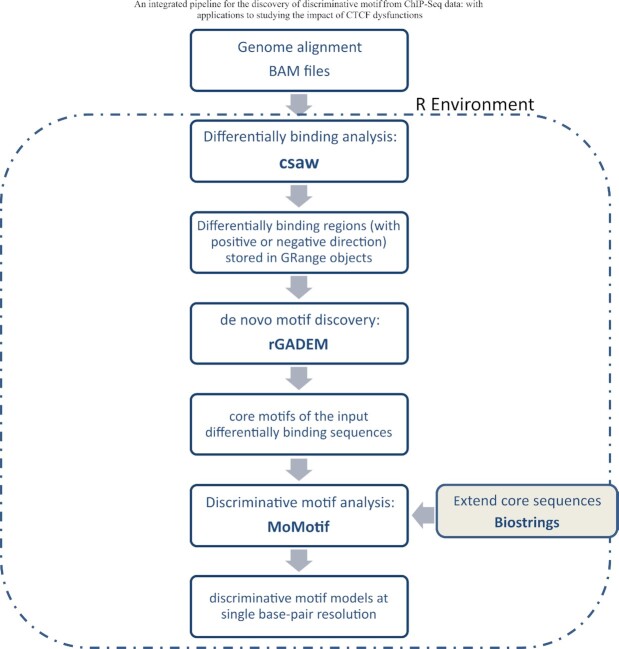
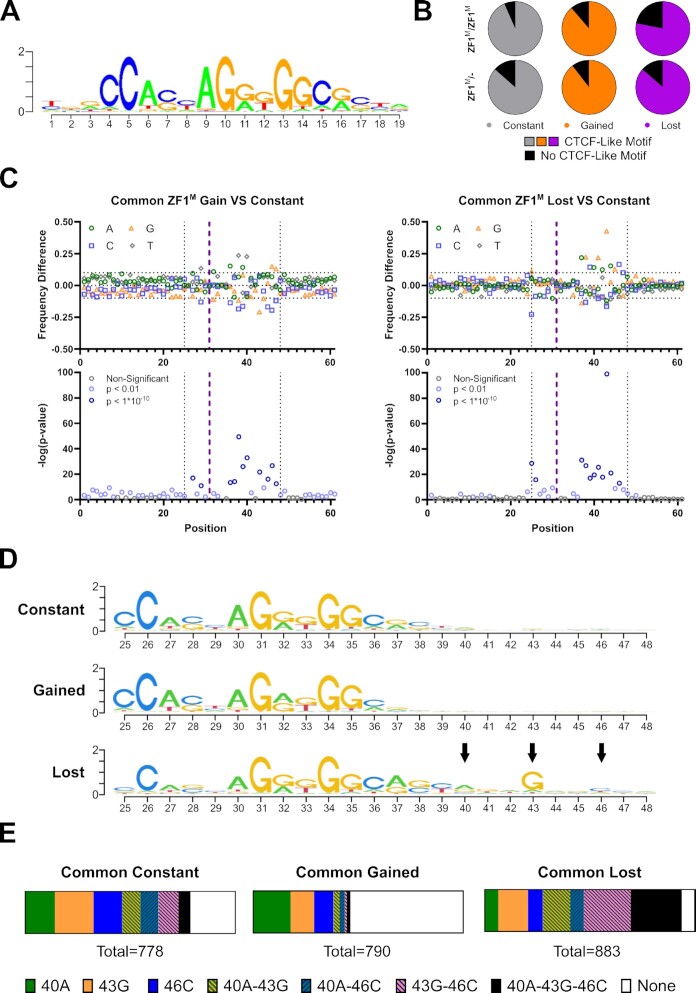
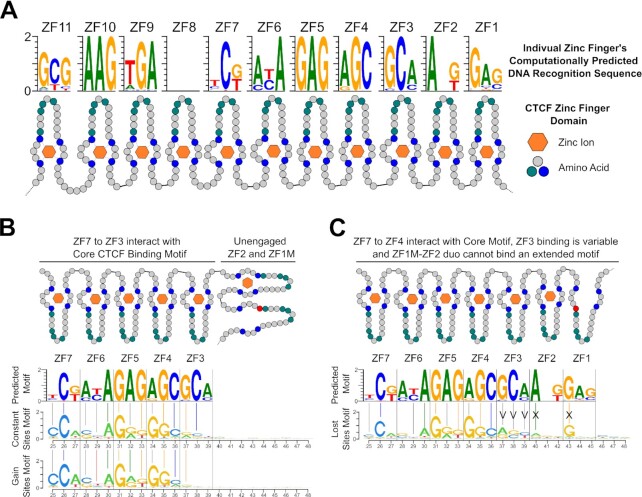
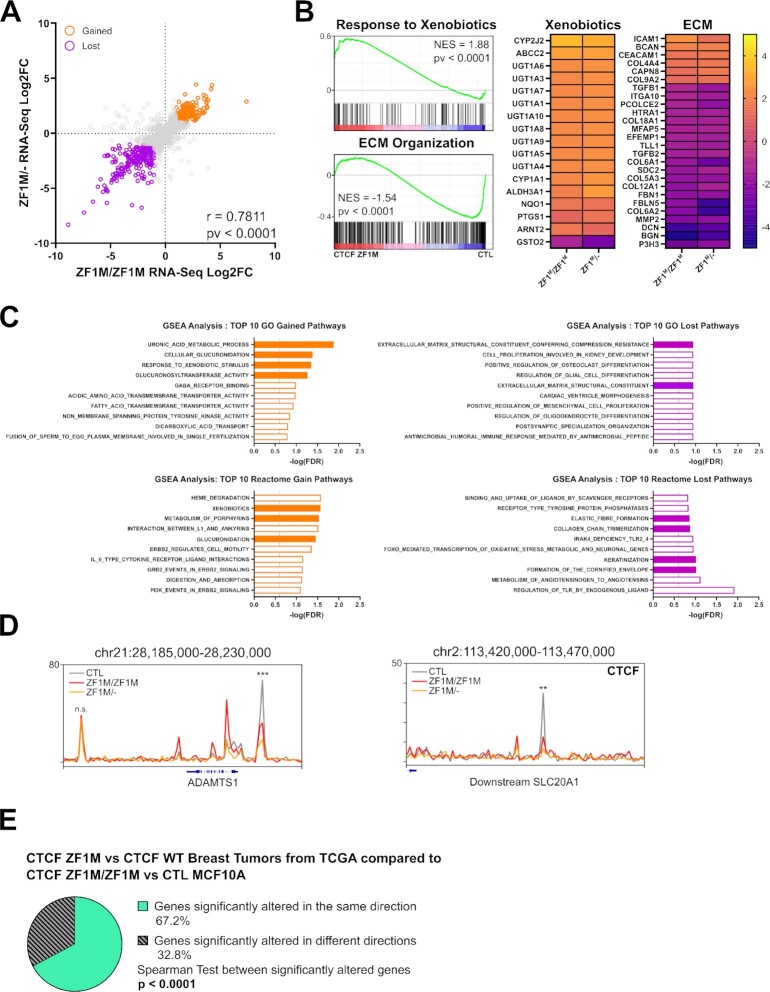
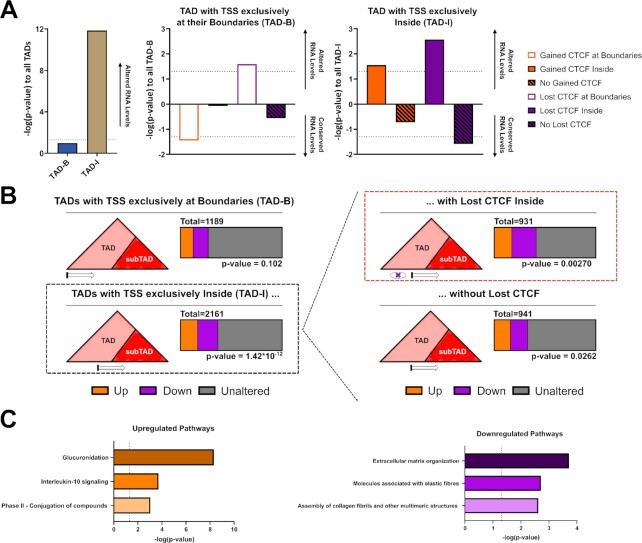
Defining the impact of missense mutations on the recognition of DNA motifs is highly dependent on bioinformatic tools that define DNA binding elements. However, classical motif analysis tools remain limited in their capacity to identify subtle changes in complex binding motifs between distinct conditions. To overcome this limitation, we developed a new tool, MoMotif, that facilitates a sensitive identification, at the single base-pair resolution, of complex, or subtle, alterations to core binding motifs, discerned from ChIP-seq data. We employed MoMotif to define the previously uncharacterized recognition motif of CTCF zinc-finger 1 (ZF1), and to further define the impact of CTCF ZF1 mutation on its association with chromatin. Mutations of CTCF ZF1 are exclusive to breast cancer and are associated with metastasis and therapeutic resistance, but the underlying mechanisms are unclear. Using MoMotif, we identified an extension of the CTCF core binding motif, necessitating a functional ZF1 to bind appropriately. Using a combination of ChIP-Seq and RNA-Seq, we discover that the inability to bind this extended motif drives an altered transcriptional program associated with the oncogenic phenotypes observed clinically. Our study demonstrates that MoMotif is a powerful new tool for comparative ChIP-seq analysis and characterising DNA-protein contacts.


Figures

Figure 1.
Figure 1.
H284N mutation of CTCF ZF1 alters a subset of DNA binding sites. (A) Enrichment of copy number loss of CTCF in ZF1M in tumors of all origin (N = 13, P = 0.0018) and ZF1M in breast tumors (N = 6, P < 0.0001) compared to Non-WT Non-ZF1M CTCF tumors (N = 258). (B) Bar chart representation of the increased frequency of CTCF LOH in CTCF ZF1M in BRCA (N = 5) compared to CTCF WT BRCA (N = 1045) and CTCF WT tumors of all cancer (N = 10 607). (C) CTCF ChIP-Seq heatmaps of commonly constant, gained and lost CBS (csaw, FDR < 0.05). (D–F) Pie Charts of the number of CBS commonly altered or uniquely altered CBS in each clone, coupled with profile plot representation of read density at these specific sites. Beside the 1013 uniquely lost in ZF1M/-, all groups of altered CBS display nearly identical changes in read density in both mutant cell lines.
Figure 2.
Figure 2.
Flowchart representation of an R pipeline utilizing newly developed software MoMotif to identify complex DNA binding motifs based on ChIP-seq profiling.
Figure 3.
Figure 3.
MoMotif identifies a unique motif enriched for CBS compromised upon mutation of ZF1 (A) Classical CTCF motif outputted by rGADEM. (B) Frequency of overlap with CTCF-Like motif in each 1000 sites subset. (C) MoMotif analysis of base frequency difference and p-value of bases distribution difference around CTCF-Like motif in common lost and gain CBS subsets compared to common constant subset. The purple line represents the middle of the CTCF Motif. The dotted line represented the selected region shown in (D) (D) MoMotif results depiction as the height of each nucleotide representing the Shannon Entropy of its occurrence frequency at each position in each subset. Highlighting the extended motif (40A, 43G, 46C) in the lost subset. (E) Bar chart representing the relative presence of each individual and combined element of the extended motif in each subset. Showing an enrichment of the partial or complete extended motif in the lost subset, while the complete or partial extended motif is absent from the gain sites. Highlighting a role for CTCF ZF1 in the recognition of this sequence.
Figure 4.
Figure 4.
Extended Motif of CTCF is associated to an altered binding conformation. (A) Predicted 3bp sequences recognized by each ZF of CTCF by Persikov et al. (57,58). (B) Alignment of the predicted motif to the motif identified by MoMotif for Constant and Gain CTCF binding sites. (C) Alignment of the predicted motif to the extended motif identified by MoMotif for Lost CTCF binding sites. For (B) and (C), colored vertical bars represent a match between the primary called base at each position and grey vertical bars represent a match between a secondary called base and a primary base.
Figure 5.
Figure 5.
CTCF ZF1M drives oncogenic transcription profiles. (A) Dot plot representation of the RNA-Seq Log2FC of the individual mutant to control MCF10A on each axis. Showing a strong correlation and reproducibility between the samples (with Pearson correlation and test P-value displayed). (B) GSEA enrichment representation of significantly upregulated and downregulated pathways. Heatmap of the Log2FC with control MCF10A of significantly altered genes in these pathways. Showing an upregulation of genes related to drug metabolism and downregulation of genes related to ECM. (C) Top 10 up and downregulated pathways (sorted by GSEA FDR) in Gene Ontology and Reactome Databases. Filled orange bars are linked to drug metabolism and filled purple bars are linked to ECM organization. Showing an over-representation of these pathways among the top altered pathways in diverse databases. (D) CTCF ChIP-Seq track around altered genes from the RNA-Seq in MCF10A CTCF ZF1M versus CTL and in TCGA Breast Tumor CTCF ZF1M versus CTCF WT related to Xenobiotic metabolism and extracellular matrix organization. Showing a significant loss of CTCF binding in proximity to ADAMTS1 promoter (P = 8.91 × 10–5 and 0.003054 for ZF1M/ZF1M and ZF1M/- respectively) and within SLC20A1 (P = 7.28 × 10–5 and 0.001778 for ZF1M/ZF1M and ZF1M/- respectively). (E) Pie chart showing a majority of genes significantly altered in the MCF10A models are also significantly altered in the same direction in breast tumors data from TCGA database when comparing changes in gene expression associated to CTCF ZF1M. Significance of the correlation between the alteration of gene expression of the two datasets is also shown.
Figure 6.
Figure 6.
Loss of CTCF binding within TADs drives oncogenic transcription. (A, B) Impact on the distribution of altered genes TSS (DESEQ2, FDR < 0.05) and altered CBS (csaw, FDR < 0.05) in the context of TAD on the enrichment of strongly altered genes (ZF1M/ZF1M to CTL abs(log2FC) ≥ 1). Showing the most significant impact of the lost of CTCF at TADs encompassing genes within them (TAD-I), compared to gain of CTCF or at TAD encompassing genes at their boundaries only (TAD-B) (P-value were generated from chi-square test on distribution of altered genes, −log(P-values) depicting significantly less strongly altered genes were turned negative in (A) to ease comprehensiveness of the graph). (C) Top 3 pathway, sorted by P-value, of Reactome Pathway Enrichment Analysis of strongly upregulated and downregulated genes from the distribution highlighted in red in (B). Showing that lost of CTCF within TAD is driving the major changes in gene expression observed in global GSEA analysis of the RNA-Seq.

Similar articles

Cited by

References

    1. Bushweller J.H. Targeting transcription factors in cancer - from undruggable to reality. Nat. Rev. Cancer. 2019; 19:611–624. - PMC - PubMed
    1. Akdemir K.C., Le V.T., Chandran S., Li Y., Verhaak R.G., Beroukhim R., Campbell P.J., Chin L., Dixon J.R., Futreal P.A.et al. .. Disruption of chromatin folding domains by somatic genomic rearrangements in human cancer. Nat. Genet. 2020; 52:294–305. - PMC - PubMed
    1. Rheinbay E., Nielsen M.M., Abascal F., Wala J.A., Shapira O., Tiao G., Hornshoj H., Hess J.M., Juul R.I., Lin Z.et al. .. Analyses of non-coding somatic drivers in 2,658 cancer whole genomes. Nature. 2020; 578:102–111. - PMC - PubMed
    1. Lee T.I., Young R.A.. Transcriptional regulation and its misregulation in disease. Cell. 2013; 152:1237–1251. - PMC - PubMed
    1. Robertson G., Hirst M., Bainbridge M., Bilenky M., Zhao Y., Zeng T., Euskirchen G., Bernier B., Varhol R., Delaney A.et al. .. Genome-wide profiles of STAT1 DNA association using chromatin immunoprecipitation and massively parallel sequencing. Nat. Methods. 2007; 4:651–657. - PubMed

Publication types