. 2022 Aug 12;8(32):eabo7044.
doi: 10.1126/sciadv.abo7044. Epub 2022 Aug 10.

Plasticity in astrocyte subpopulations regulates heroin relapse

Affiliations

Plasticity in astrocyte subpopulations regulates heroin relapse

Anna Kruyer et al. Sci Adv. .

Abstract

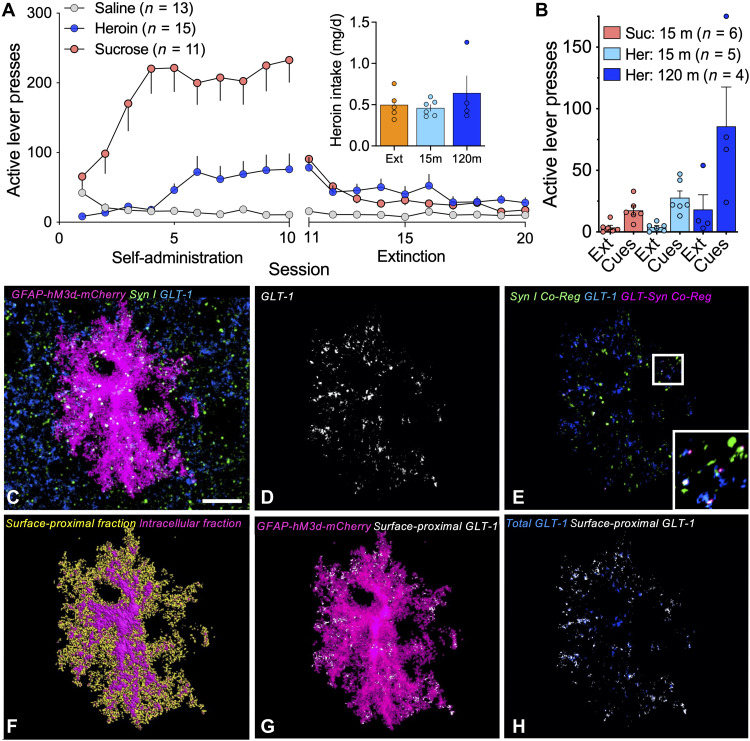
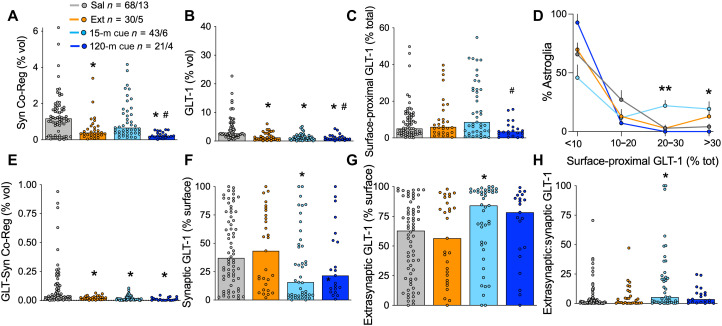
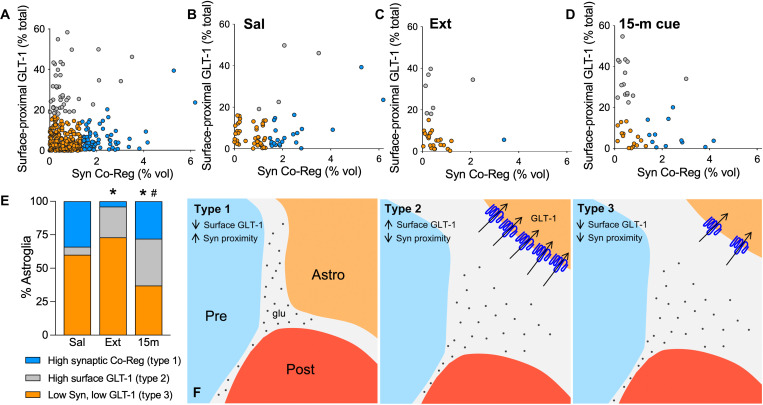
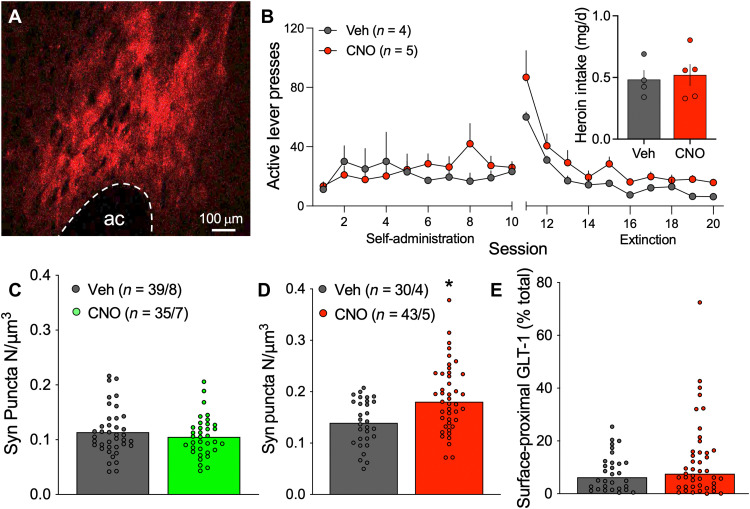
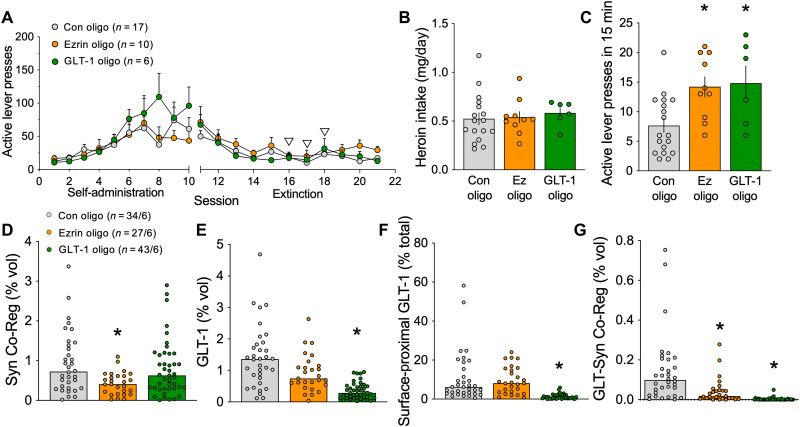
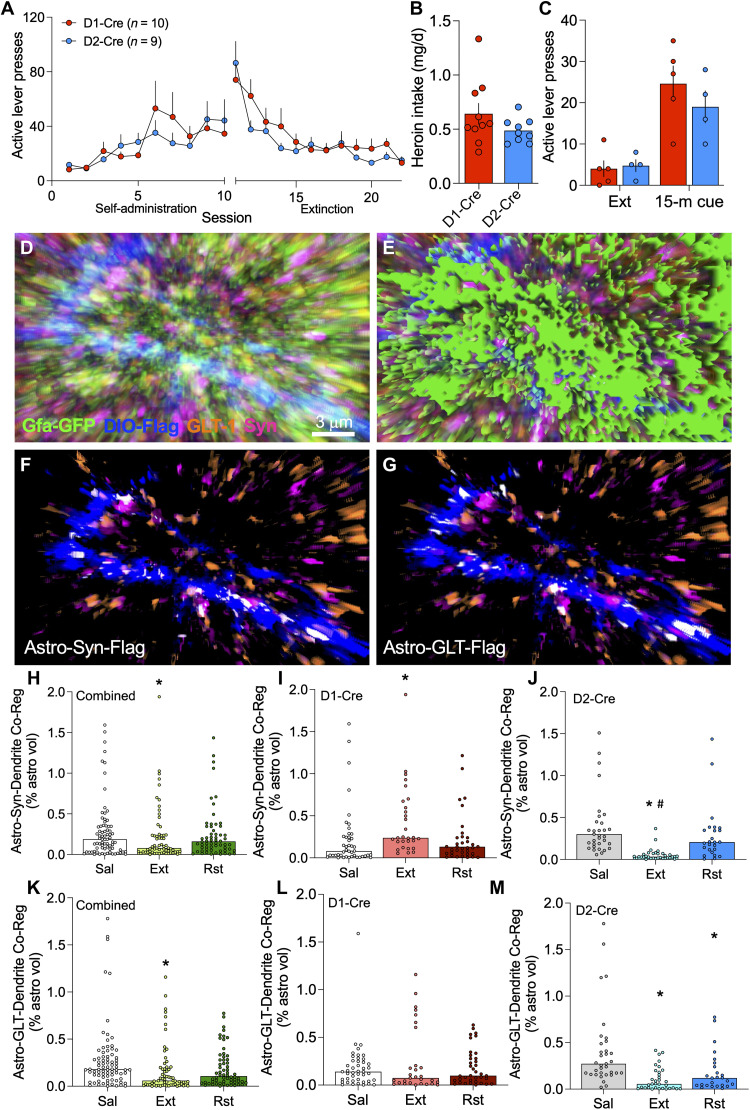
Opioid use disorder (OUD) produces detrimental personal and societal consequences. Astrocytes are a major cell group in the brain that receives little attention in mediating OUD. We determined how astrocytes and the astroglial glutamate transporter, GLT-1, in the nucleus accumbens core adapt and contribute to heroin seeking in rats. Seeking heroin, but not sucrose, produced two transient forms of plasticity in different astroglial subpopulations. Increased morphological proximity to synapses occurred in one subpopulation and increased extrasynaptic GLT-1 expression in another. Augmented synapse proximity by astroglia occurred selectively at D2-dopamine receptor-expressing dendrites, while changes in GLT-1 were not neuron subtype specific. mRNA-targeted antisense inhibition of either morphological or GLT-1 plasticity promoted cue-induced heroin seeking. Thus, we show that heroin cues induce two distinct forms of transient plasticity in separate astroglial subpopulations that dampen heroin relapse.


Figures

Fig. 1.
Fig. 1.. Workflow used for confocal analysis of astroglial morphology and surface-proximal GLT-1.
(A) Rats were trained to self-administer heroin or sucrose over 10 consecutive days of operant training, and reward delivery was paired with light and tone cues. During extinction training, heroin or sucrose and cues were not delivered in response to active lever pressing, and operant responding gradually decreased. Heroin- and sucrose-trained rats differed in active lever pressing during self-administration (two-way ANOVA, F1,124 = 33.44, P < 0.0001). Inset shows that groups of heroin-trained animals took similar amounts of heroin (one-way ANOVA, F2,12 = 0.9187, P = 0.4984). (B) Twenty-four hours after the last extinction session, animals undergoing cue-induced reinstatement of reward seeking were placed in the operant chamber, and cues were restored to the active lever for 15 or 120 min to reinstate seeking (two-way ANOVA session, F1,26 = 16.07, P = 0.0005). (C) Z-series depicting a NAcore astrocyte transfected with AAV5/GFAP-hM3d-mCherry (magenta) and immuno-labeled for Synapsin I (green) and GLT-1 (blue). (D) GLT-1 immunoreactivity coregistered with the mCherry-labeled astrocyte in (C) is shown in white. (E) Coregistration of GLT-1 (blue) with Synapsin I (green) from the region occupied by the astrocyte in (C) is shown in pink. (F) Digital rendering of the astroglial surface (yellow) was used to identify GLT-1 signal within 250 nm of the cell membrane (G and H, white) relative to total GLT-1 from the same astrocyte (H, blue). Bar in (C) = 10 μm. In (A) (inset), Ext, extinguished; 15 m, 15-min cued reinstatement; 120 m, 120-min cued reinstatement. In (B), Suc, sucrose; Her, heroin; Ext, extinction.
Fig. 2.
Fig. 2.. Extrasynaptic GLT-1 was transiently elevated during heroin seeking.
We previously found that coregistration of labeled NAcore astroglia with Synapsin I is reduced during extinction from heroin [(A) Kruskal-Wallis = 30.17, P < 0.0001) and that 15 min of cued heroin seeking restores synaptic insulation by astrocytes. (B) Withdrawal from heroin self-administration produced a down-regulation of GLT-1 on NAcore astroglia, whether or not rats underwent cued reinstatement (Kruskal-Wallis = 51.77, P < 0.0001). (C) Surface-proximal GLT-1, shown here as percent of total GLT-1 from each astrocyte, was increased during active seeking (15-m cue) when compared to a time point at which cues no longer evoke seeking (i.e., cue extinction; 120-m cue, Kruskal-Wallis = 9.848, P < 0.05). A greater proportion of astrocytes exhibited high levels of surface-proximal GLT-1 after 15 min of heroin cues compared to yoked saline controls [(D) <10%: Kruskal-Wallis = 6.114, P = 0.1062; 10 to 20%: Kruskal-Wallis = 3.362, P = 0.3391; 20 to 30%: Kruskal-Wallis = 13.42, **P < 0.01 and P < 0.01, 15-min reinstatement versus yoked saline; >30%: Kruskal-Wallis = 9.831, *P < 0.05]. Coregistration of GLT-1 with the presynaptic marker Synapsin I was found to be reduced in heroin-trained rats and was not restored during cued reinstatement [(E) Kruskal-Wallis = 35.48, P < 0.0001]. When synaptic and extrasynaptic fractions of surface GLT-1 were analyzed separately, we found that 15 min of cued heroin seeking decreased synaptic GLT-1 [(F) Kruskal-Wallis = 9.493, P < 0.05] and increased extrasynaptic GLT-1 [(G) Kruskal-Wallis = 9.493, P < 0.05]. The ratio of extrasynaptic and synaptic GLT-1 illustrates the robust increase in extrasynaptic GLT-1 during cued heroin seeking [(H) Kruskal-Wallis = 9.476]. N shown in (A) as cells/animals. In (A) to (C) and (E) to (H), *P < 0.05 compared to yoked control, #P < 0.05 compared to 15 min reinstated using Dunn’s test. Sal, yoked saline; Ext, extinguished; 15-m cue, 15-min cued reinstatement; 120-m cue, 120-min cued reinstatement.
Fig. 3.
Fig. 3.. Cue-induced increases in astrocyte motility and GLT-1 surface expression occurred in different astroglial subpopulations.
(A) PCA was used to identify subpopulations of NAcore astroglia according to their synaptic adjacency and levels of surface-proximal GLT-1. Astrocytes with high synaptic adjacency (blue) or high levels of surface-proximal GLT-1 (gray) were identified as separate cell clusters. Distribution of clusters in tissue from yoked saline and extinguished or cue-reinstated rats is shown in (B) to (D). Astrocytes with high surface-proximal GLT-1 but low synaptic coregistration were largely absent from yoked control rats but emerged after extinction of operant heroin training [(E) χ2 = 14.10, *P = 0.0018 Ext. versus Sal). Half of astroglia in cue-reinstated rats exhibited one or the other type of transient plasticity [(E) χ2 = 15.97, *P = 0.0006 versus Sal; χ2 = 11.20, #P = 0.0074 versus Ext). (F) Schematic illustrating three astroglial subtypes identified by PCA and hierarchical clustering. Type 1 astroglia expressed low levels of GLT-1 but exhibited high measures of synaptic adjacency (F, left). Type 2 astroglia expressed high levels of extrasynaptic GLT-1 (blue) and were observed after heroin training but were not abundant in control animals (F, middle). Type 3 astroglia were predominant in control animals and had low-to-moderate GLT-1 expression and synaptic adjacency (F, right).
Fig. 4.
Fig. 4.. Gq signaling increased synaptic adjacency in NAcore astroglia from heroin-trained rats.
After viral delivery of Gq-DREADD in NAcore astroglia (A, red), rats were trained to self-administer heroin before undergoing extinction training (B). The following day, rats received intraperitoneal injections of vehicle or CNO but did not undergo cued reinstatement. Heroin intake did not differ between vehicle- or CNO-treated rats [(B) inset, t7 = 0.173, P = 0.7602]. (C) CNO delivery did not affect synaptic adjacency of astrocytes labeled with Lck-GFP (Mann-Whitney U = 633, P = 0.5978). (D) Gq signaling increased coregistration of NAcore astroglia with near-adjacent immunolabeled Synapsin I puncta (Mann-Whitney U = 363, P = 0.0013) but did not affect levels of surface-proximal GLT-1 [(E) Mann-Whitney U = 568, P = 0.3934]. In (A), ac, anterior commissure. In (B) to (D), Veh, vehicle. In (C) and (D), N shown as cells/animals.
Fig. 5.
Fig. 5.. Impairing cue-induced astrocyte motility or surface GLT-1 elevated heroin seeking.
(A) Rats were trained to self-administer heroin over 10 consecutive days. Starting on day 6 of extinction training for three consecutive days (white arrowheads), animals received NAcore infusions of an ezrin antisense oligomer, a GLT-1 antisense oligomer, or a control oligomer. Animals in each treatment group did not differ in total heroin intake during self-administration. (B) Rats receiving different oligo treatments did not differ in heroin intake (one-way ANOVA, F2,30 = 0.1739, P = 0.8412). Twenty-four hours after the final extinction session, animals were reinstated for 15 min by exposure to light and tone cues previously paired with heroin delivery. (C) Rats that underwent ezrin or GLT-1 knockdown pressed higher on the active lever during the 15-min reinstatement session (one-way ANOVA, F2,30 = 6.230, P = 0.0055, *P = 0.0058 Con versus Ezrin Oligo, *P = 0.0104 Con versus GLT-1 Oligo using Fisher’s test). (D) Astrocytes from rats treated with the ezrin oligo exhibited a significant reduction in synaptic coregistration, consistent with knockdown of astrocyte peripheral process motility (Kruskal-Wallis = 15.85, P = 0.0004, *P = 0.0002 versus Con). The GLT-1 oligo did not affect synaptic coregistration by NAcore astroglia (P = 0.4676 versus Con). (E) GLT-1 levels were unchanged by ezrin antisense oligo delivery (P = 0.3888) but were reduced by treatment with the GLT-1 oligo (Kruskal-Wallis = 54.85, P < 0.0001, *P < 0.0001). (F) Likewise, surface-proximal GLT-1 was reduced after application of the GLT-1 oligo (Kruskal-Wallis = 80.22, P < 0.0001, *P < 0.0001 versus Con), but not the ezrin oligo (P > 0.9999 versus Con). (G) The coregistration between GLT-1 and Synapsin I on astroglia was significantly reduced after ezrin (Kruskal-Wallis = 87.13, P < 0.0001, *P = 0.0147) or GLT-1 knockdown (*P < 0.0001). In (A) to (D), Con, control oligo; Ez, ezrin oligo; GLT-1, GLT-1 oligo. In (D), N shown as cells/animals.
Fig. 6.
Fig. 6.. Astrocytes increased their adjacency to D1-MSN synapses but retracted from D2-MSN synapses after extinction training.
(A) Male and female D1- and D2-Cre rats were trained to self-administer heroin over 10 days before undergoing extinction training. (B) Heroin intake did not differ between the strains (t17 = 1.449, P = 0.1656). (C) Twenty-four hours after the last extinction session, lever pressing was reinstated by exposure to heroin-conditioned cues for 15 min (two-way ANOVA, time F1,7 = 20.36, P = 0.0028, genotype F1,7 = 0.9944, P = 0.3519). (D) NAcore tissue from these animals was immunolabeled to identify D1- or D2-MSN dendrites (blue), GLT-1 (orange), and Synapsin I (pink). Signal associated with NAcore astroglia (green, D and E) was isolated to quantify the degree of triple coregistration between astroglia and D1- or D2-MSN synapses (F, white) or astroglial GLT-1 and D1- or D2-MSN dendrites (G, white). Synaptic association by astroglia was reduced by extinction training after heroin self-administration when quantified in a cell-nonspecific manner [(H) Kruskal-Wallis = 4.617, P = 0.0994, *P = 0.0380 versus Sal]. When analyzed separately, astrocyte association with D1-MSN synapses was low at baseline and was increased by extinction training [(I) Kruskal-Wallis = 12.35, P = 0.0021, *P = 0.0014 versus Sal). Instead, D2-MSN synapses had high astrocyte insulation at baseline (P < 0.0001 versus D1-Cre, Sal using Dunn’s test) that was reduced by extinction training and recovered during cued reinstatement [(J) Kruskal-Wallis = 45.84, P < 0.0001, *P < 0.0001 versus Sal, and #P < 0.0001 versus Rst). Surface-proximal, dendrite-associated GLT-1 was decreased overall after extinction training in NAcore astrocytes and was restored during 15-min cued reinstatement [(K) Kruskal-Wallis = 15.23, P = 0.0005, *P < 0.05 versus Sal). However, the increase in surface-proximal GLT-1 during cued reinstatement was not associated with dendrites from D1- [(L) Kruskal-Wallis = 0.7498 P = 0.6874) or D2-MSNs [(M) Kruskal-Wallis = 25.49, P < 0.0001, *P < 0.05 versus Sal). Similar to astrocyte-synaptic adjacency, GLT-1 coregistration with D2-dendrites was higher at baseline compared with D1-dendrites (P = 0.0043 using Dunn’s test). In (I), (J), (L), and (M), N = 25–44/4–5 cells/animals per group, and full data spread is reported in table S1. Sal, yoked saline; Ext, extinguished; Rst, 15-min cued reinstatement.

Similar articles

Cited by

References

    1. Kalivas P. W., The glutamate homeostasis hypothesis of addiction. Nat. Rev. Neurosci. 10, 561–572 (2009). - PubMed
    1. Lehre K. P., Danbolt N. C., The number of glutamate transporter subtype molecules at glutamatergic synapses: Chemical and stereological quantification in young adult rat brain. J. Neurosci. 18, 8751–8757 (1998). - PMC - PubMed
    1. Danbolt N. C., Glutamate uptake. Prog. Neurobiol. 65, 1–105 (2001). - PubMed
    1. Roberts-Wolfe D. J., Kalivas P. W., Glutamate transporter GLT-1 as a therapeutic target for substance use disorders. CNS Neurol. Disord. Drug Targets 14, 745–756 (2015). - PMC - PubMed
    1. Scofield M. D., Li H., Siemsen B. M., Healey K. L., Tran P. K., Woronoff N., Boger H. A., Kalivas P. W., Reissner K. J., Cocaine self-administration and extinction leads to reduced glial fibrillary acidic protein expression and morphometric features of astrocytes in the nucleus accumbens core. Biol. Psychiatry 80, 207–215 (2016). - PMC - PubMed