. 2022 Aug 12;8(32):eabm3976.
doi: 10.1126/sciadv.abm3976. Epub 2022 Aug 10.

Single-cell multiomics sequencing reveals the reprogramming defects in embryos generated by round spermatid injection

Affiliations

Single-cell multiomics sequencing reveals the reprogramming defects in embryos generated by round spermatid injection

Jing Wang et al. Sci Adv. .

Abstract

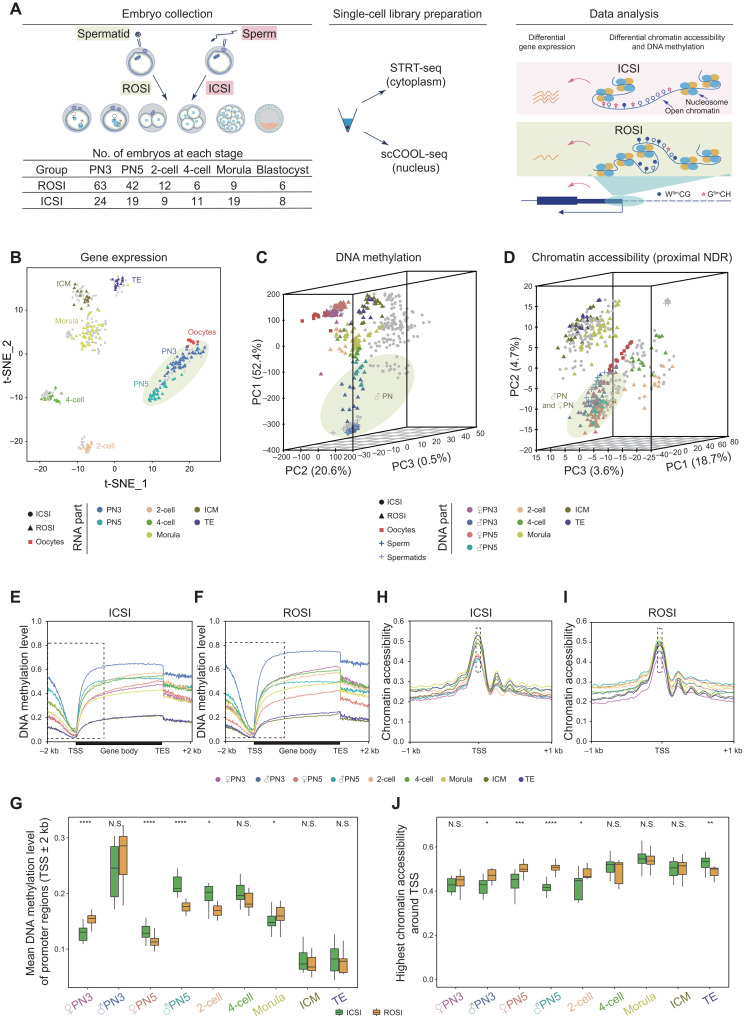
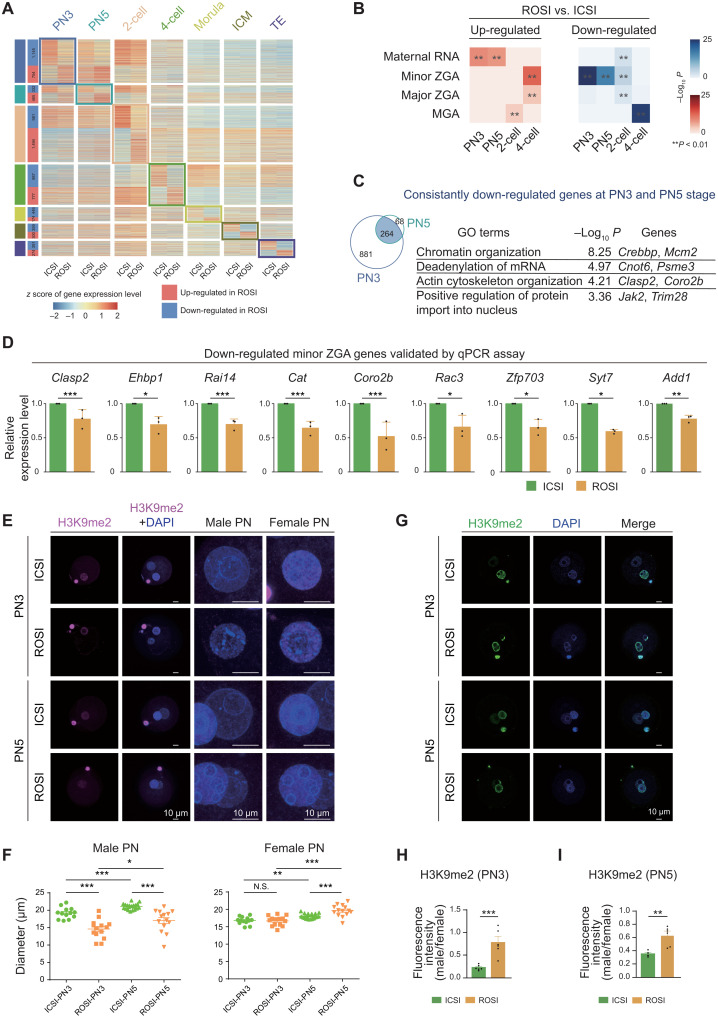
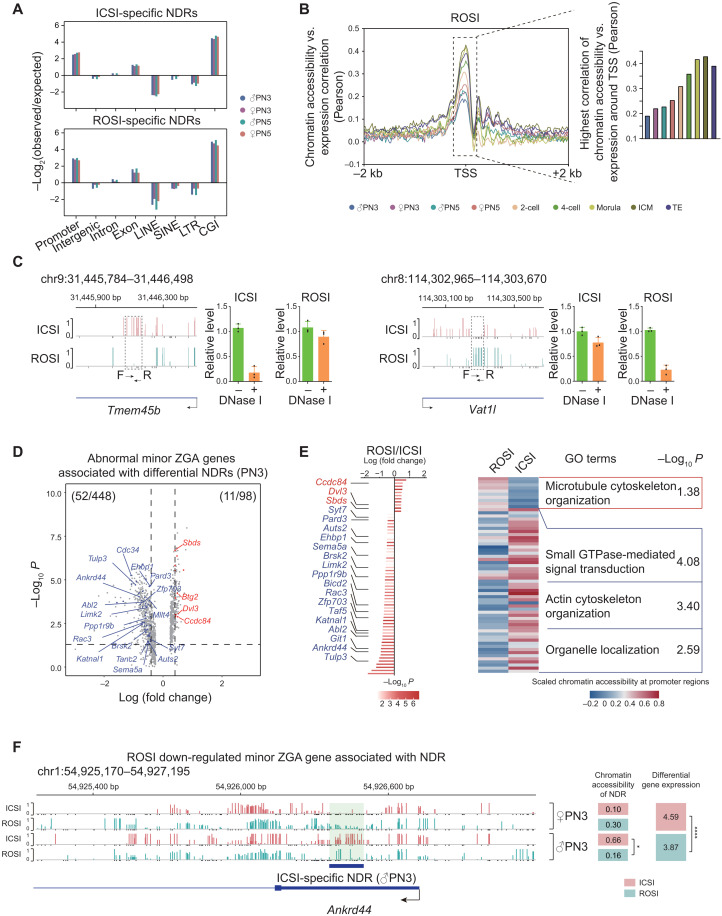
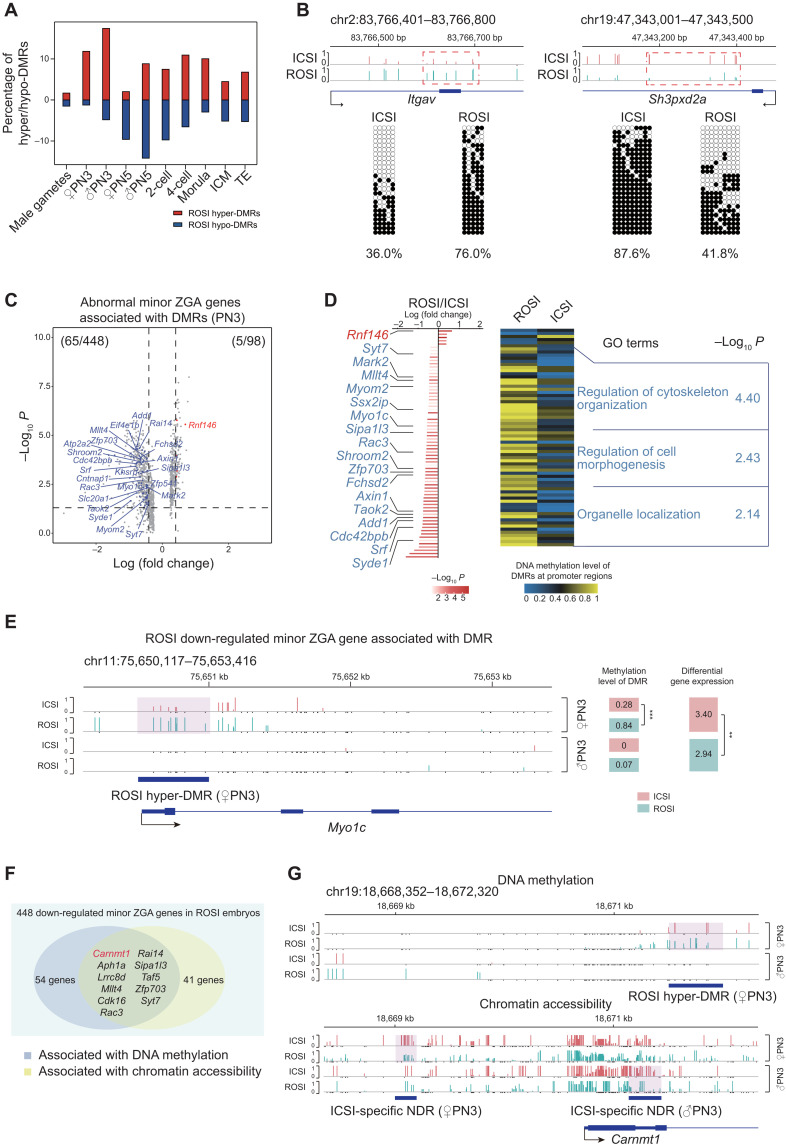
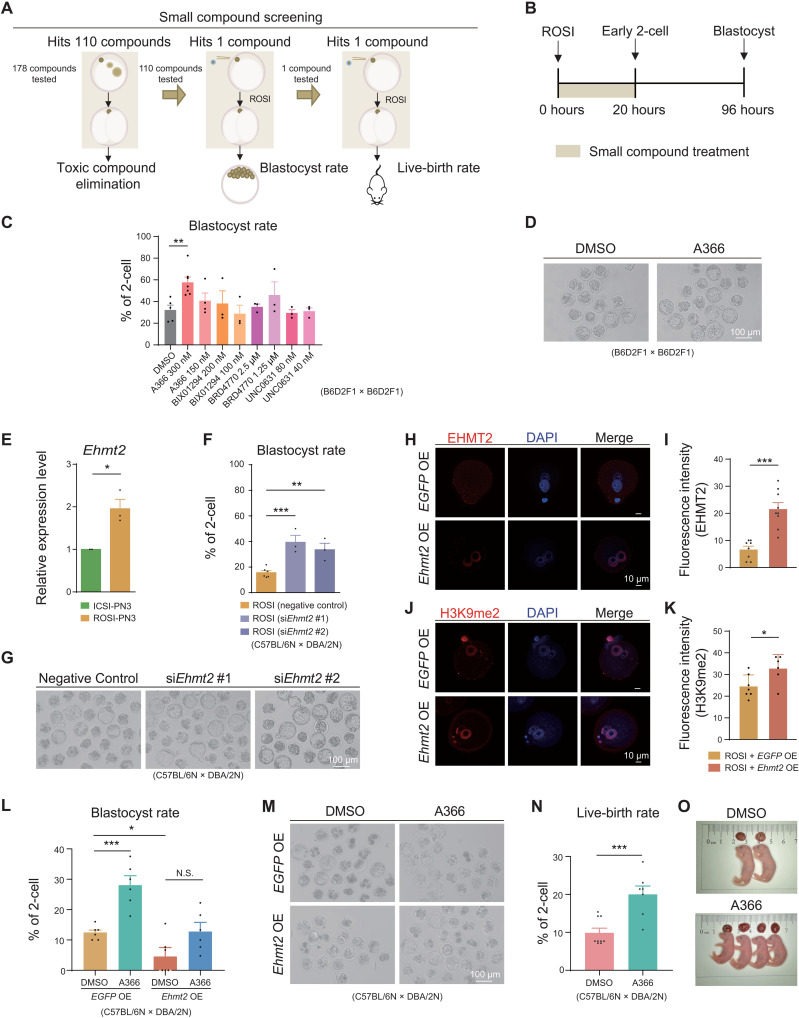
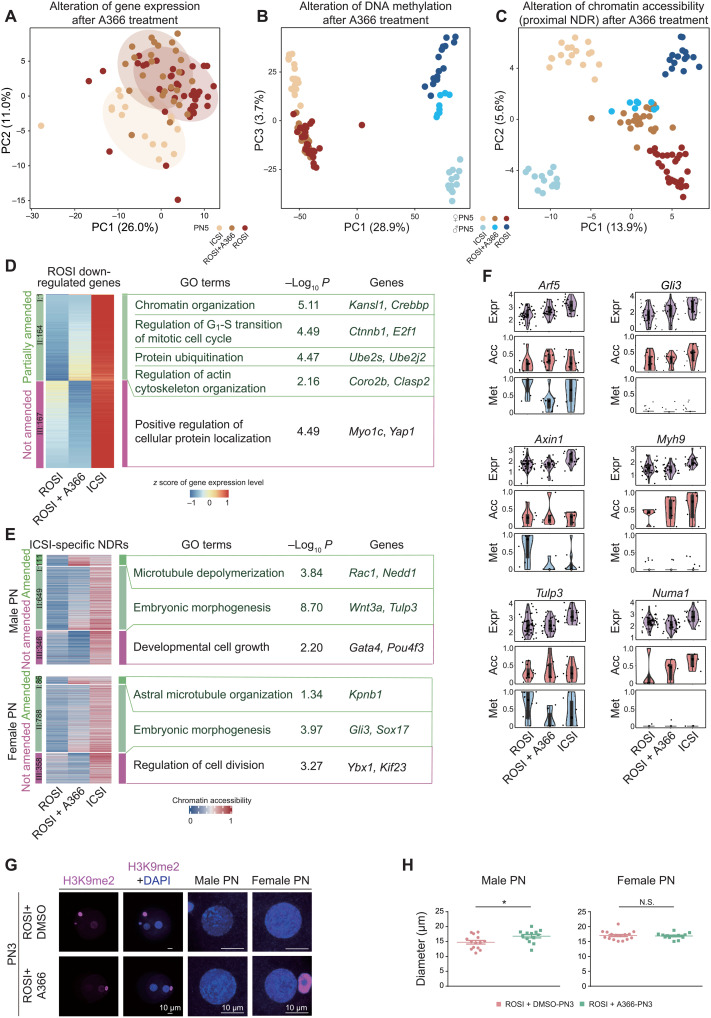
Round spermatid injection (ROSI) technique holds great promise for clinical treatment of a proportion of infertile men. However, the compromised developmental potential of ROSI embryos largely limits the clinical application, and the mechanisms are not fully understood. Here, we describe the transcriptome, chromatin accessibility, and DNA methylation landscapes of mouse ROSI embryos derived from early-stage round spermatids using a single-cell multiomics sequencing approach. By interrogating these data, we identify the reprogramming defects in ROSI embryos at the pronuclear stages, which are mainly associated with the misexpression of a cohort of minor zygotic genome activation genes. We screen a small compound, A366, that can significantly increase the developmental potential of ROSI embryos, in which A366 can partially overcome the reprogramming defects by amending the epigenetic and transcriptomic states. Collectively, our study uncovers the reprogramming defects in ROSI embryos for understanding the mechanisms underlying compromised developmental potential and offers an avenue for ROSI technique optimization.


Figures

Fig. 1.
Fig. 1.. The overview of transcriptome, chromatin accessibility, and DNA methylation in the preimplantation mouse ROSI embryos.
(A) Schematic illustration of the number of embryos and single-cell multiomics sequencing analyses used in this study. STRT-seq, single cell–tagged reverse transcription sequencing; scCOOL-seq, single-cell chromatin overall omics-scale landscape sequencing. (B) Dimensionality reduction analysis of gene expression data from single-cell multiomics sequencing using t-SNE. Each dot represents a single cell. ROSI samples are triangles and colored by developmental stages, while ICSI samples are in gray. Yellow-green circle indicates pronucleus. (C and D) Dimensionality reduction analysis of DNA methylation (C) and chromatin accessibility data (D) from single-cell multiomics sequencing using PCA. Each dot represents a single cell. ROSI samples are triangles and colored by developmental stages, while ICSI samples are in gray. Yellow-green circle indicates male pronucleus (C) and male and female pronuclei (D), respectively. (E and F) DNA methylation level along gene bodies, 2-kb upstream of TSSs and 2-kb downstream of transcription end sites (TESs) of all RefSeq genes in ICSI (E) and ROSI (F) embryos. (G) Boxplot showing DNA methylation level of promoter regions (TSSs ± 2 kb) at each stage. (H and I) Chromatin accessibility around TSSs (±1 kb) in ICSI (H) and ROSI (I) embryos. (J) Boxplot showing chromatin accessibility of TSSs at each stage. Unpaired two-tailed Student’s t test (G and J) is used for statistical analysis. *P < 0.05, **P < 0.01, ***P < 0.001, and ****P < 0.0001. N.S., not significant.
Fig. 2.
Fig. 2.. The misexpression of maternal to zygotic transition–associated genes in ROSI embryos.
(A) Heatmap showing the DEGs at each stage. (B) Hypergeometric test analysis of DEGs between ROSI and ICSI embryos in “maternal RNA,” “minor ZGA,” “major ZGA,” and “MGA” (28) gene clusters. (C) Venn plot showing that 264 genes are consistently down-regulated at the PN3 and PN5 stages in ROSI embryos. Enriched GO terms and representative genes are listed. (D) qPCR results showing the mRNA levels of nine representative down-regulated minor ZGA genes (PN3) in three biological repeats. (E) Immunofluorescence of H3K9me2 in ROSI and ICSI embryos at the PN3 (top) and PN5 (bottom) stages. The magnified images are shown on the right. Scale bars, 10 μm. (F) Dot plots showing the diameter of ROSI and ICSI pronuclei in three biological repeats. Each dot corresponds to the diameter of each pronucleus. (G) Immunofluorescence of H3K9me2 in ROSI and ICSI embryos at the PN3 (top) and PN5 (bottom) stages. Scale bars, 10 μm. (H and I) Bar graph showing the fluorescence intensity of H3K9me2 in male pronucleus relative to female pronucleus at the PN3 (H) and the PN5 stages (I) in three biological repeats. Each dot corresponds to level in each individual embryo. Unpaired two-tailed Student’s t test (D, F, H, and I) is used for statistical analysis. *P < 0.05, **P < 0.01, and ***P < 0.001.
Fig. 3.
Fig. 3.. Chromatin accessibility dynamics in ROSI embryos and the association with misexpression of minor ZGA genes.
(A) Relative enrichment analysis of ICSI-specific (top) and ROSI-specific NDRs (bottom) in different genomic regions at the pronuclear stages (PN3 and PN5). (B) Pearson correlation of chromatin accessibility and gene expression level around promoter regions (TSSs ± 2 kb) of all RefSeq genes in ROSI embryos at each stage. Bar plot on the right showing the highest correlation around TSSs. (C) Two representative loci detected as ICSI-specific NDR (Tmem45b) (left) and as ROSI-specific NDR (Vat1l) (right) at 4-cell stage validated by liDNaseI-qPCR assay in three biological repeats. (D) Volcano plot showing the relationship between differential gene expression of minor ZGA genes and chromatin accessibility of proximal NDRs (PN3). Blue dots represent genes that are down-regulated in ROSI embryos and occupied with the ICSI specific-proximal NDRs, while red dots are vice versa. (E) Bar plot showing the differentially expressed minor ZGA genes [from (D)], while heatmap showing the chromatin accessibility of associated NDRs at the promoter regions in ROSI and ICSI embryos. Representative GO terms are shown on the right. GTPase, guanosine triphosphatase. (F) Genome browser view of the chromatin accessibility of ICSI-specific NDR around Ankrd44. The GCH sites with chromatin accessibility lower than 0.1 (but are detected) are shown as black bars. The chromatin accessibility of NDRs and the gene expression level in ROSI and ICSI embryos are listed on the right. *P < 0.05 and ****P < 0.0001.
Fig. 4.
Fig. 4.. DNA methylation reprogramming alterations in ROSI embryos.
(A) Bar plot showing the fractions of hyper-DMRs (red) and hypo-DMRs (blue) in total genomic titles with three WCG sites covered in ROSI embryos compared to ICSI embryos. (B) Two representative loci detected as ROSI hyper-DMR (left) and as ROSI hypo-DMR (right) at morula stage validated by bisulfite genomic PCR-based Sanger sequencing. (C) Volcano plot showing the relationship between differential expression of minor ZGA genes and DNA methylation level of DMRs at the promoter regions (PN3). Blue dots represent genes that are down-regulated in ROSI embryos and the associated DMRs are also hypermethylated, while red dots are vice versa. (D) Bar plot showing the differentially expressed minor ZGA genes associated with DMRs [from (C)], while heatmap showing the DNA methylation level of associated DMRs at the promoter regions in ROSI and ICSI embryos (PN3). Representative GO terms are shown on the right. (E) Genome browser view of DNA methylation level around the promoter region of Myo1c. WCG sites with DNA methylation level lower than 0.1 (but are detected) are shown as black bars. The DNA methylation level and gene expression level are shown on the right. **P < 0.01 and ***P < 0.001. (F) Venn plot showing 11 down-regulated minor ZGA genes associated with both chromatin accessibility and DNA methylation in ROSI embryos (PN3). (G) Genome browser views of DNA methylation level (top) and chromatin accessibility (bottom) of ROSI hyper-DMR or ICSI-specific NDR around the promoter region of Carnmt1.
Fig. 5.
Fig. 5.. A366 treatment improves the developmental capacity of ROSI embryos.
(A) Flowchart for small compound screening using ROSI embryos. (B) Schematic diagram showing the time frame for small compound treatment. (C and D) Blastocyst rate (C) of ROSI embryos treated by G9A inhibitors and representative ROSI embryos (D) treated by A366 at 94 hours after injection. Scale bar, 100 μm. DMSO, dimethyl sulfoxide. (E) Relative expression of Ehmt2 in ICSI and ROSI embryos (PN3) in three biological repeats. (F and G) Blastocyst rate (F) and representative ROSI embryos (G) after siEhmt2 injection at 94 hours after injection in three biological repeats. Scale bar, 100 μm. (H and I) Immunofluorescence (H) and statistical analysis (I) of EHMT2 in ROSI embryos that overexpressed Ehmt2 (Ehmt2 OE) and control group (EGFP OE) (PN5) in three biological repeats. Each dot corresponds to level in each individual embryo. Scale bars, 10 μm. (J and K) Immunofluorescence (J) and statistical analysis (K) of H3K9me2 in Ehmt2 OE-ROSI embryos and control group (PN5) in three biological repeats. Each dot corresponds to level in each individual embryo. Scale bars, 10 μm. (L and M) Blastocyst rate (L) and representative EGFP OE and Ehmt2 OE ROSI embryos (M) treated by A366 at 94 hours after injection in six biological repeats. Scale bar, 100 μm. (N and O) Live-birth rate (N) and representative alive fetuses of ROSI embryos (O) treated by A366 and control group. Unpaired two-tailed Student’s t test (C, E, F, I, K, L, and N) is used for statistical analysis. *P < 0.05, **P < 0.01, and ***P < 0.001.
Fig. 6.
Fig. 6.. A366 treatment can partially overcome the reprogramming defects of ROSI embryos derived from early-stage round spermatids.
(A to C) Dimensionality reduction analysis of gene expression (A), DNA methylation (B), and chromatin accessibility (C) of ICSI, ROSI, and A366-treated ROSI embryos based on DEGs, DMRs, and differential NDRs between ROSI and ICSI embryos (PN5) using PCA, respectively. Cells are colored by experimental group. (D and E) Heatmap showing the gene expression alterations of ROSI down-regulated genes (D) and the chromatin accessibility alterations of ICSI-specific NDRs (E) in A366-treated ROSI embryos (PN5). Representative GO terms and genes are shown on the right. (F) Violin plots showing the gene expression [log2(TPM/10 + 1), where TPM is transcripts per million, purple], chromatin accessibility (GCH methylation level, red) of associated proximal NDRs, and DNA methylation level (WCG methylation level, blue) of associated DMRs of representative minor ZGA genes (PN5). Regions with more than one WCG or GCH site covered in a single cell are used to calculate the methylation level. (G) Immunofluorescence of H3K9me2 in A366-treated ROSI embryos and control group (PN3). The magnified images are shown on the right. Scale bars, 10 μm. (H) Dot plots showing the diameter of male (left) and female (right) pronuclei in A366-treated ROSI embryos and control group (PN3) in three biological repeats. *P < 0.05, unpaired two-tailed Student’s t test. Each dot corresponds to the diameter of each pronucleus.

Similar articles

Cited by

References

    1. Willott G. M., Frequency of azoospermia. Forensic Sci. Int. 20, 9–10 (1982). - PubMed
    1. Gianaroli L., Selman H. A., Magli M. C., Colpi G., Fortini D., Ferraretti A. P., Birth of a healthy infant after conception with round spermatids isolated from cryopreserved testicular tissue. Fertil. Steril. 72, 539–541 (1999). - PubMed
    1. Tanaka A., Nagayoshi M., Takemoto Y., Tanaka I., Kusunoki H., Watanabe S., Kuroda K., Takeda S., Ito M., Yanagimachi R., Fourteen babies born after round spermatid injection into human oocytes. Proc. Natl. Acad. Sci. U.S.A. 112, 14629–14634 (2015). - PMC - PubMed
    1. Mayer W., Niveleau A., Walter J., Fundele R., Haaf T., Demethylation of the zygotic paternal genome. Nature 403, 501–502 (2000). - PubMed
    1. Oswald J., Engemann S., Lane N., Mayer W., Olek A., Fundele R., Dean W., Reik W., Walter J., Active demethylation of the paternal genome in the mouse zygote. Curr. Biol. 10, 475–478 (2000). - PubMed