. 2022 Aug 12;8(32):eabn1441.
doi: 10.1126/sciadv.abn1441. Epub 2022 Aug 10.

Co-option of the piRNA pathway to regulate neural crest specification

Affiliations

Co-option of the piRNA pathway to regulate neural crest specification

Riley Galton et al. Sci Adv. .

Abstract

Across Metazoa, Piwi proteins play a critical role in protecting the germline genome through piRNA-mediated repression of transposable elements. In vertebrates, activity of Piwi proteins and the piRNA pathway was thought to be gonad specific. Our results reveal the expression of Piwil1 in a vertebrate somatic cell type, the neural crest. Piwil1 is expressed at low levels throughout the chicken neural tube, peaking in neural crest cells just before the specification event that enables epithelial-to-mesenchymal transition (EMT) and migration into the periphery. Loss of Piwil1 impedes neural crest specification and emigration. Small RNA sequencing reveals somatic piRNAs with sequence signatures of an active ping-pong loop. RNA-seq and functional experiments identify the transposon-derived gene ERNI as Piwil1's target in the neural crest. ERNI, in turn, suppresses Sox2 to precisely control the timing of neural crest specification and EMT. Our data provide mechanistic insight into a novel function of the piRNA pathway as a regulator of somatic development in a vertebrate species.


Figures
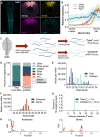
Fig. 1.
Fig. 1.. Piwi protein and piRNA expression in the cranial region.
(A) HCR reveals the expression of Chiwi and the neural crest markers, Pax7 and Snai2; scale bars, 50 μm. (B) Quantification of the intensity of HCR signal of Chiwi, Pax7, and Snai2 from the ventral midline to the dorsal neural folds of the neural tube (n = 4 to 5 sections each from two HH9 embryos). (C) Schematic diagram of the small RNA cloning strategy from the midbrain region of HH9 embryos (n = 2 biological replicates). (D) Annotation of small RNAs mapping to the genome. Orientation is relative to the annotated feature. “Other” category includes reads that could not be assigned to a feature, as well as reads mapping to simple repeats, satellite repeats, small cytoplasmic RNA, and small nuclear RNA, which together account for <1% of mapped reads in all samples. (E) Length distribution of all reads mapping to the genome in total and oxidized libraries. (F) Length distribution of reads from oxidized libraries mapping to TEs in sense and antisense orientation. (G) Analysis of 5′ to 5′ distance of complementary small RNA reads mapping to TEs in total and oxidized libraries. (H) Sequence logos of oxidized, collapsed sequences mapping to TEs in antisense (left) and sense (right) orientation.
Fig. 2.
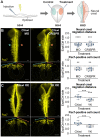
Fig. 2.. Perturbation of Chiwi disrupts neural crest development.
(A) Schematic diagram of the chick embryo electroporation strategy. (B) Loss of Chiwi impedes neural crest migration and reduces neural crest cell count, as measured by Pax7-expressing cells. Left: Examples of whole mount and cross sections upon MO and CRISPR knockout of Chiwi. Right: Quantification of image analysis. Each data point represents measurements from a single embryo, with the right (experimental) divided by the left (control) side. (C) Overexpression (OE) of Chiwi increases the number of Pax7-positive cells, though migration distance is not significantly altered, while overexpression of the YK mutant, which is unable to bind piRNAs, impedes neural crest migration and reduces cell number. The blue stars and brackets denote the control side, while the red stars and brackets denote the experimental side. Scale bars, 50 μm. Box plots indicate the interquartile range, while whiskers extend to minimum and maximum values. *P ≤ 0.05, **P ≤ 0.01, ***P ≤ 0.001, and ****P ≤ 0.0001. Asterisks (*) represent the difference between control and experimental measurements for each treatment.
Fig. 3.
Fig. 3.. Chiwi regulates a single, transposon-derived gene, ERNI, in the neural crest.
(A) Differential expression analysis of RNA-seq from HH9 Chiwi CRISPR knockout versus control cranial neural folds. Dots represent genes (blue) and transposon families (orange). FC, fold change. (B) HCR depicting ERNI, Chiwi, and Snai2 expression in wild-type HH9 cranial midbrain region; scale bar, 50 μm. (C) HCR reveals changes to ERNI expression upon Chiwi loss (MO and CRISPR), as well as Chiwi and YK mutant overexpression. Each data point represents the average fluorescent intensity of the right dorsal fold region (experimental) divided by the left (control) side from three nonadjacent sections from the cranial region of a single embryo. Scale bar, 50 μm. Box plots indicate the interquartile range, while whiskers extend to minimum and maximum values. *P ≤ 0.05 and **P ≤ 0.01. Asterisks (*) represent the difference between control and experimental measurements for each treatment. (D) Normalized small RNA read counts mapping to the ERNI mRNA sequence in total versus oxidized (Ox) small RNA libraries. Error bars indicate SDs from two biological replicates. (E) Analysis of 5′ to 5′ distance of complementary small RNA sequences mapping to the ERNI mRNA sequence in the oxidized small RNA libraries. (F) Small RNA-seq (top) and RNA-seq (bottom) tracks depicting sequences mapping to ENS-1 loci and the ERNI mRNA sequence (left). Oxidized small RNAs mapping in sense (teal) and antisense (red) orientation are depicted separately. Cranial neural fold total RNA-seq [control libraries from (A)] is depicted in blue. Replicate tracks are overlaid.
Fig. 4.
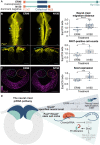
Fig. 4.. Perturbation of ERNI recapitulates Chiwi phenotypes.
(A) Schematic diagram of ERNI overexpression and dominant negative (N150) expression construct products. (B) Overexpression of ERNI recapitulates loss of Chiwi phenotype, with a reduction in neural crest migration distance and cell number, while overexpression of the N150 truncated ERNI sequence increases cell count and migration distance, as measured by Pax7-expressing cells. Left: Examples of whole mount and cross sections upon ERNI and N150 overexpression. Right: Quantification of image analysis. Each data point represents measurements from a single embryo, with the right (experimental) divided by the left (control) side. (C) HCR reveals that ERNI overexpression leads to a reduction in Sox2 expression in the dorsal neural tube, while N150 dominant negative overexpression increases Sox2 expression. Each data point represents the average fluorescent intensity of Sox2 signal in the right dorsal fold region (experimental) divided by the left (control) side from three nonadjacent sections from the cranial region of a single embryo. The teal stars and circle denote the control side, while the orange stars and circle denote the experimental side. Scale bars, 50 μm. Box plots indicate the interquartile range, while whiskers extend to minimum and maximum values. *P ≤ 0.05, **P ≤ 0.01, ***P ≤ 0.001, and ****P ≤ 0.0001. Asterisks (*) represent the difference between control and experimental measurements for each treatment. (D) Schematic diagram of the neural crest piRNA pathway, depicting a neural tube with the PAX7+/Snai2 stem cell niche in teal, which feeds into the Snai2+-specified neural crest region in dark blue. Chiwi represses ERNI in the PAX7+/Snai2 stem cell niche via a piRNA-mediated mechanism to maintain Sox2 expression and proliferation. In specified neural crest, Chiwi expression is reduced, permitting ERNI expression, which, in turn, represses Sox2 to allow for neural crest specification and EMT.

Similar articles

Cited by

References

    1. Cenik E. S., Zamore P. D., Argonaute proteins. Curr. Biol. 21, R446–R449 (2011). - PubMed
    1. Aravin A. A., Sachidanandam R., Girard A., Fejes-Toth K., Hannon G. J., Developmentally regulated piRNA clusters implicate MILI in transposon control. Science 316, 744–747 (2007). - PubMed
    1. Brennecke J., Aravin A. A., Stark A., Dus M., Kellis M., Sachidanandam R., Hannon G. J., Discrete small RNA-generating loci as master regulators of transposon activity in Drosophila. Cell 128, 1089–1103 (2007). - PubMed
    1. Vagin V. V., Sigova A., Li C., Seitz H., Gvozdev V., Zamore P. D., A distinct small RNA pathway silences selfish genetic elements in the germline. Science 313, 320–324 (2006). - PubMed
    1. Aravin A. A., Hannon G. J., Brennecke J., The Piwi-piRNA pathway provides an adaptive defense in the transposon arms race. Science 318, 761–764 (2007). - PubMed