. 2022 Aug 12;8(32):eabo2389.
doi: 10.1126/sciadv.abo2389. Epub 2022 Aug 10.

Disruption of the circadian clock drives Apc loss of heterozygosity to accelerate colorectal cancer

Affiliations

Disruption of the circadian clock drives Apc loss of heterozygosity to accelerate colorectal cancer

Sung Kook Chun et al. Sci Adv. .

Abstract

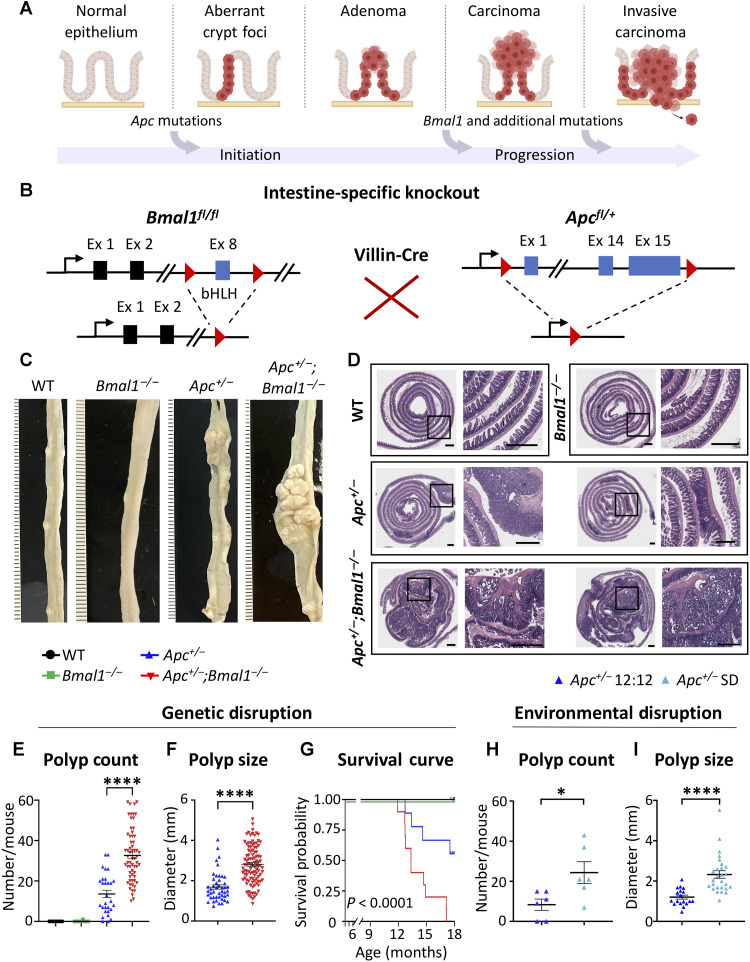
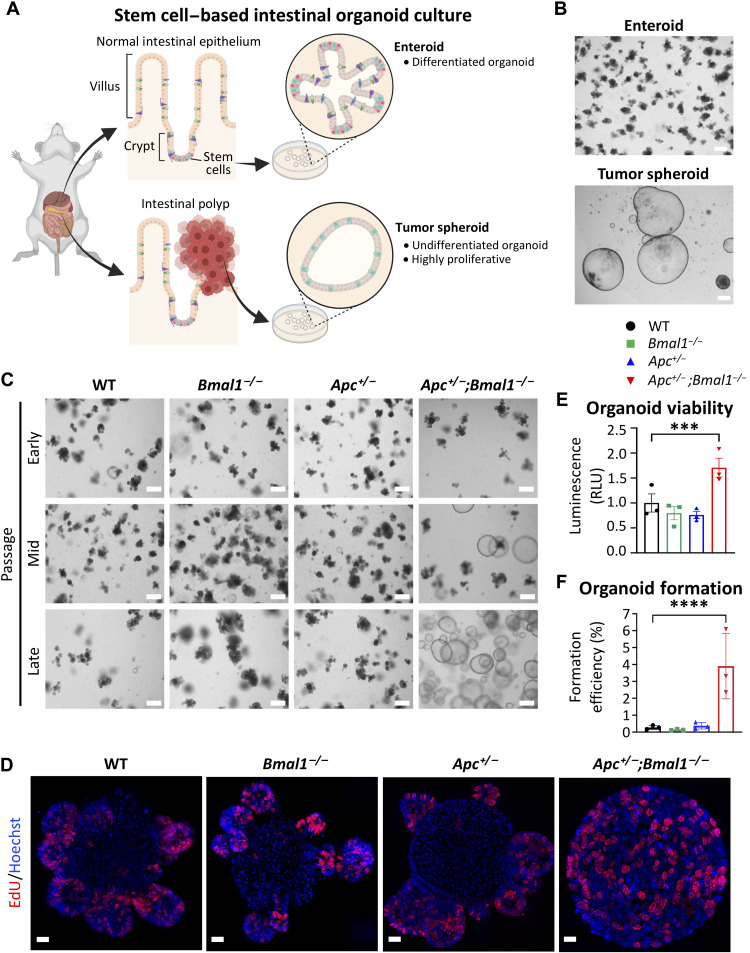
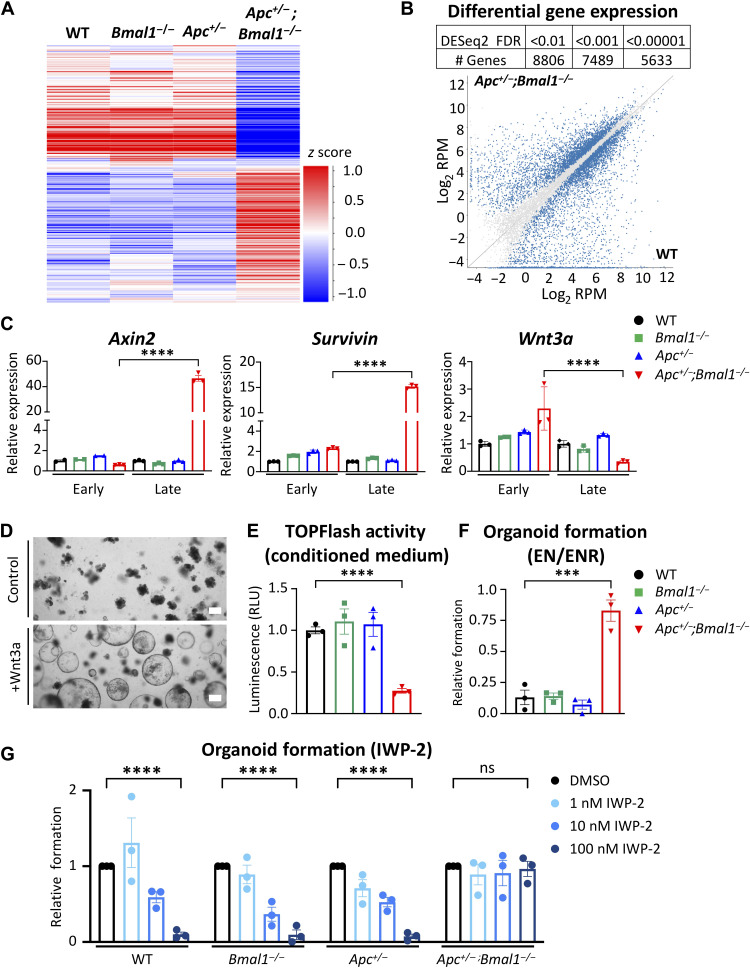
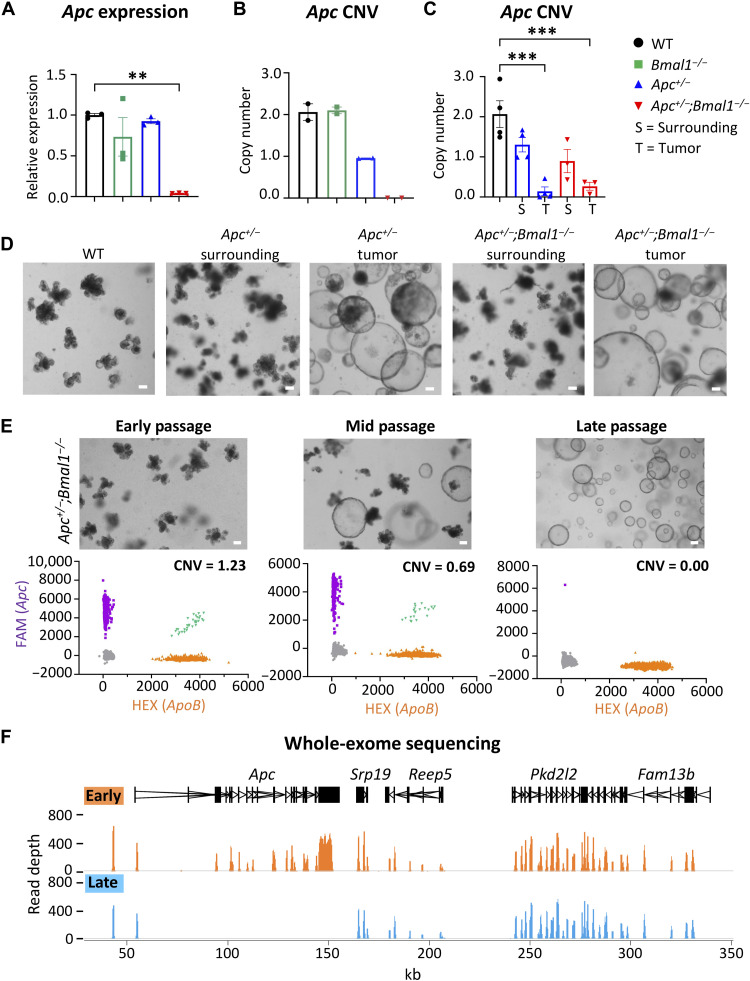
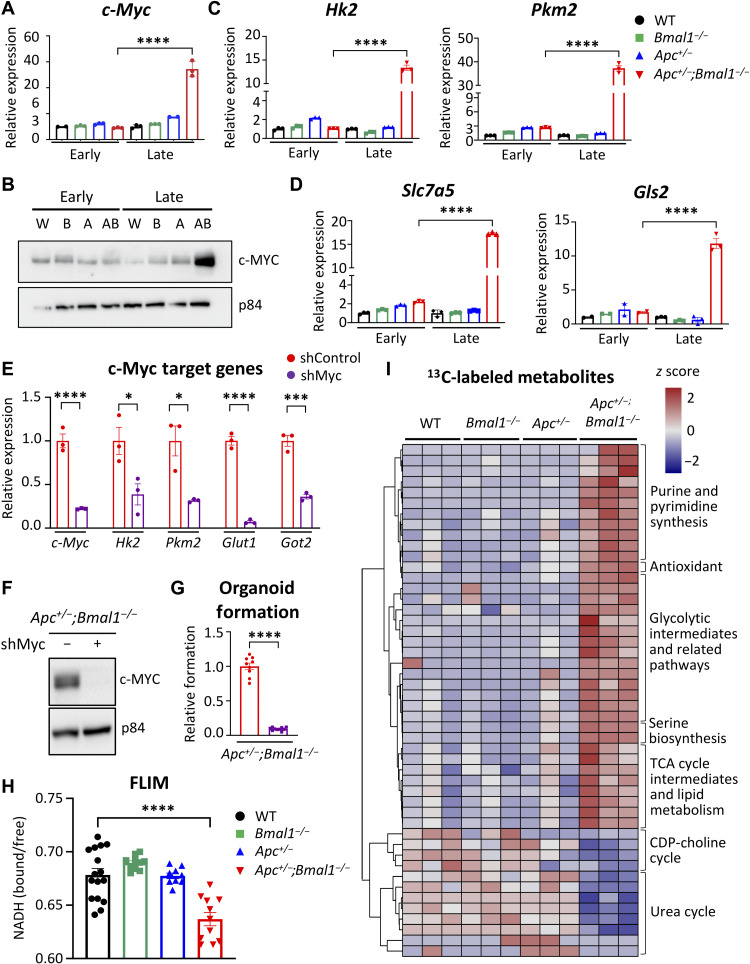
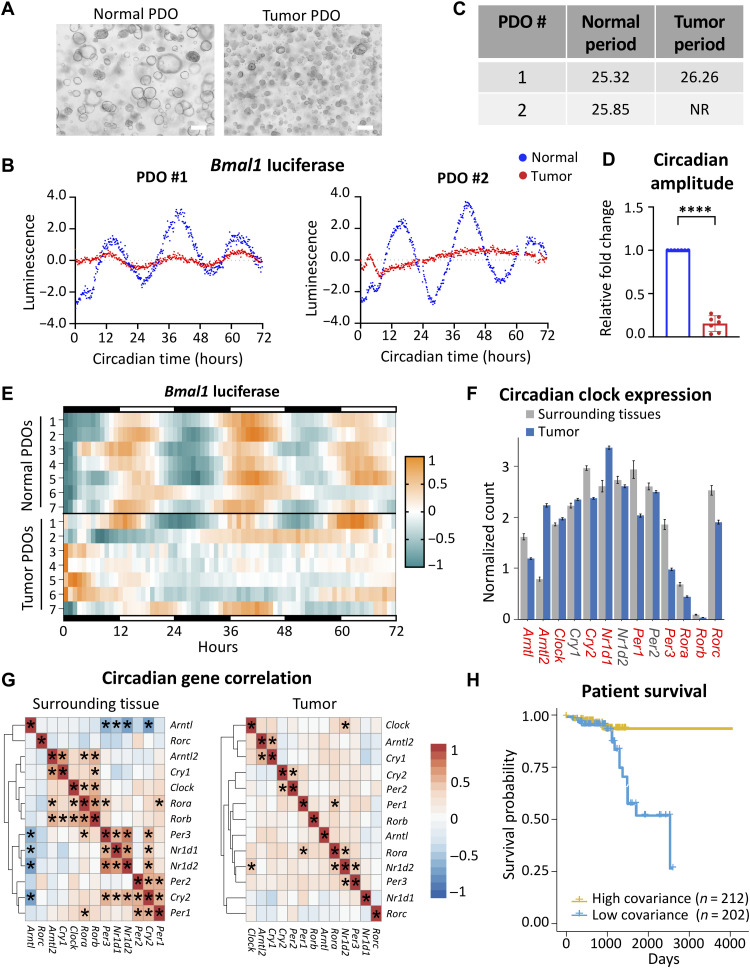
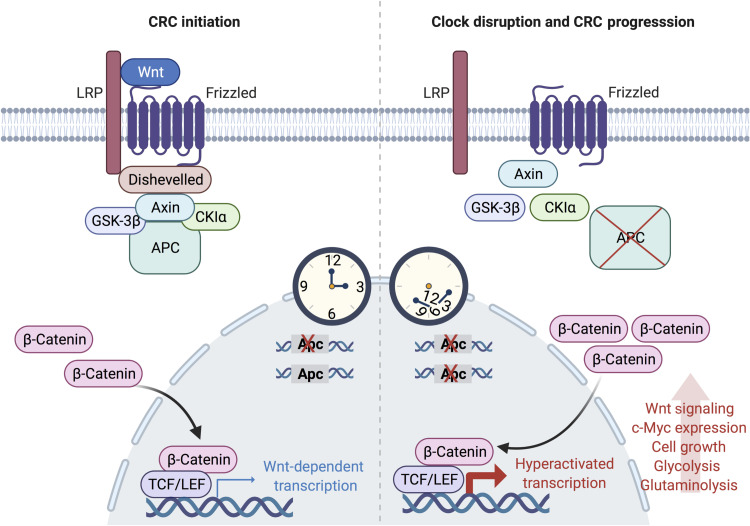
An alarming rise in young onset colorectal cancer (CRC) has been reported; however, the underlying molecular mechanism remains undefined. Suspected risk factors of young onset CRC include environmental aspects, such as lifestyle and dietary factors, which are known to affect the circadian clock. We find that both genetic disruption and environmental disruption of the circadian clock accelerate Apc-driven CRC pathogenesis in vivo. Using an intestinal organoid model, we demonstrate that clock disruption promotes transformation by driving Apc loss of heterozygosity, which hyperactivates Wnt signaling. This up-regulates c-Myc, a known Wnt target, which drives heightened glycolytic metabolism. Using patient-derived organoids, we show that circadian rhythms are lost in human tumors. Last, we identify that variance between core clock and Wnt pathway genes significantly predicts the survival of patients with CRC. Overall, our findings demonstrate a previously unidentified mechanistic link between clock disruption and CRC, which has important implications for young onset cancer prevention.


Figures

Fig. 1.
Fig. 1.. Disruption of circadian clock accelerates intestinal tumorigenesis in vivo.
(A) Schematic depicting the initiation and progression of CRC through Apc, Bmal1, and additional mutations. (B) In vivo intestine-specific gene targeting strategy for Bmal1 and Apc. (C) Linearized ileum tissue from representative mice of all genotypes. (D) Overview of representative sections of hematoxylin and eosin (H&E)–stained small intestinal Swiss rolls from WT, Bmal1−/−, Apc+/−, and Apc+/−;Bmal1−/− mice. Scale bars, 1 mm. (E) Scatterplot of small intestinal polyp count from 30 WT, 30 Bmal1−/−, 29 Apc+/−, and 62 Apc+/−;Bmal1−/− mice. (F) Scatterplot of individual polyp sizes from the small intestine of Apc+/− and Apc+/−;Bmal1−/− mice (n = 8 mice per genotype). (G) Kaplan-Meier survival curve of 9 to 11 mice per genotype up to 18 months. (H) Scatterplot of small intestinal polyp count from six Apc+/− mice maintained in 12-hour light:12-hour (12:12) dark conditions and six Apc+/− mice maintained in shift disruption (SD) conditions. (I) Scatterplot of individual polyp sizes from the small intestine of 12:12 and SD Apc+/− mice. Data represent the mean ± SEM, and statistical significance was determined by one-way analysis of variance (ANOVA) with Tukey’s multiple comparison test for (E), log-rank (Mantel-Cox) test for (G), and Student’s unpaired t test for (F), (H), and (I). Asterisks represent P values from t test or multiple comparisons, with *P < 0.05 and ****P < 0.0001.
Fig. 2.
Fig. 2.. Bmal1 disruption accelerates organoid spheroid formation and proliferation.
(A) Schematic depicting stem cell–based intestinal organoid culture from normal intestinal epithelium and tumors. (B) Bright-field microscopy images of enteroid (top) and tumor spheroid (bottom) organoids grown in culture. Scale bars, 100 μm. (C) Bright-field microscopy images of organoids established from intestinal crypts at early, mid, and late passages. Scale bars, 100 μm. (D) EdU incorporation in organoids. Merged channels of EdU (red) and Hoechst (blue) were taken on a Zeiss Elyra 7 super-resolution confocal microscope. Scale bars, 20 μm. (E) Viability of organoids after 5 days of growth as determined using CellTiter-Glo 3D cell viability assay (n = 3 independent organoid lines per genotype). Luminescence was normalized to total protein amount to obtain relative light units (RLU). (F) Organoid formation of WT, Bmal1−/−, Apc+/−, and Apc+/−;Bmal1−/− organoids after 5 days of culture. Organoid formation is shown as a percentage of single cells plated normalized to WT (n = 3 independent organoid lines per genotype). Data represent the mean ± SEM, and statistical significance was determined by one-way ANOVA with Tukey’s multiple comparison test. Asterisks represent P values from multiple comparisons, with ***P < 0.001 and ****P < 0.0001.
Fig. 3.
Fig. 3.. Bmal1 disruption induces global transcriptome shift and deregulation of Wnt signaling in intestinal organoids.
RNA-seq was performed using late-stage WT, Bmal1−/−, Apc+/−, and Apc+/−;Bmal1−/− organoids (n = 3 independent organoid lines per genotype). (A) Heatmap depicting gene expression in organoids. (B) Table indicating the number of differentially expressed genes (DEGs) at different false discovery rate (FDR) thresholds and scatterplot showing expression of transcripts in Apc+/−;Bmal1−/− compared to WT. Quantified reads are normalized per million mapped reads and log2-transformed (log2 RPM). DEGs with an FDR < 0.001 are highlighted in blue on the graph. (C) Expression of Wnt signaling genes Axin2, Survivin, and Wnt3a was determined by qPCR using WT, Bmal1−/−, Apc+/−, and Apc+/−;Bmal1−/− organoids at early stage (before transformation of Apc+/−;Bmal1−/− organoids) or late stage (after transformation of Apc+/−;Bmal1−/− organoids). (D) Bright-field microscopy images of WT organoids treated with Wnt3a conditioned medium for 5 days. Scale bars, 100 μm. (E) TOPFlash reporter assay in human embryonic kidney (HEK) 293T cells treated with conditioned medium from WT, Bmal1−/−, Apc+/−, and Apc+/−;Bmal1−/− organoids. Luciferase activity from each genotype is shown normalized to WT organoids, and RLU are shown (n = 3 independent organoid lines per genotype). (F) Relative organoid formation of WT, Bmal1−/−, Apc+/−, and Apc+/−;Bmal1−/− organoids in R-Spondin–depleted medium (EN) normalized to formation in ENR medium (n = 3 independent organoid lines per genotype). (G) Organoid formation of WT, Bmal1−/−, Apc+/−, and Apc+/−;Bmal1−/− organoids after treatment with increasing concentrations of inhibitor of Wnt signaling 2 (IWP-2). The formation at each concentration is presented as fold change relative to dimethyl sulfoxide (DMSO) vehicle treatment (n = 3 independent organoid lines per genotype). Data represent the means ± SEM. Statistical significance was determined by one-way ANOVA for (C), (E), and (F) and two-way ANOVA for (G) with Tukey’s multiple comparison test. Asterisks represent P values from multiple comparisons, with ***P < 0.001 and ****P < 0.0001. ns, not significant.
Fig. 4.
Fig. 4.. Intestinal clock disruption accelerates Apc LOH.
(A) Quantification of Apc mRNA in late-stage organoids as determined by qPCR. (B) CNV was determined in WT, Bmal1−/−, Apc+/−, and Apc+/−;Bmal1−/− organoids using dPCR (n = 2 independent organoid lines per genotype). (C) CNV was determined in WT organoids as well as tumor and surrounding Apc+/− and Apc+/−;Bmal1−/− organoids using dPCR (n = 3 to 4 independent organoid lines per genotype). (D) Microscope images of WT organoids along with tumor and surrounding Apc+/− and Apc+/−;Bmal1−/− organoids. Scale bars, 100 μm. (E) Microscope images of early-, mid-, and late-passage Apc+/−;Bmal1−/− organoids along with dPCR scatterplots. FAM represents Apc-positive partitions, while HEX represents a reference genomic locus. Scale bars, 100 μm. (F) WES of gDNA from early- and late-passage Apc+/−;Bmal1−/− organoids. Browser view shows exonic read depth at a region of chromosome 18, which includes Apc. Early (orange) and late (blue) peaks are the average quantification of reads in four independent organoid lines per condition. mRNA tracks are indicated in black, and the x axis indicates length in kilo–base pairs (kbp). Data represent the mean ± SEM. Statistical significance was determined by one-way ANOVA with Tukey’s multiple comparison test for (A) and (C). Asterisks represent P values from multiple comparisons, with **P < 0.01 and ***P < 0.001.
Fig. 5.
Fig. 5.. Increased MYC and glycolytic metabolism by disruption of the intestinal clock.
(A) The expression of c-Myc in early- versus late-stage WT, Bmal1−/−, Apc+/−, and Apc+/−;Bmal1−/− organoids, as determined using qPCR (n = 3 independent experiments). (B) Protein abundance of c-MYC shown by Western blot relative to p84 protein abundance in early- versus late-stage organoids. W, WT; B, Bmal1−/−; A, Apc+/−; AB, Apc+/−;Bmal1−/− organoids. The expression of c-MYC target genes involved in (C) glycolysis and (D) glutaminolysis was determined using qPCR in WT, Bmal1−/−, Apc+/−, and Apc+/−;Bmal1−/− organoids at early or late stages. (E) shRNA-mediated knockdown of c-Myc in Apc+/−;Bmal1−/− organoids. Gene expression analysis of c-Myc, Hk2, Pkm2, Glut1, and Got2 by qPCR (n = 3 independent experiments). (F) Knockdown of c-Myc protein abundance validated using Western blot and shown relative to p84 abundance. (G) Effect of c-Myc knockdown on organoid formation in Apc+/−;Bmal1−/− organoids. Organoid formation is presented as fold change relative to the control infection (n = 8 independent experiments). (H) Ratio of free NADH (reduced form of nicotinamide adenine dinucleotide) versus bound NADH as measured by fluorescence lifetime imaging microscopy (FLIM) in WT, Bmal1−/−, Apc+/−, and Apc+/−;Bmal1−/− organoids. Distribution of NADH signals was calculated by phasor analysis of segmented pixels. (I) Hierarchical clustered heatmap of significantly changed metabolites from 13C tracing metabolomics analysis in WT, Bmal1−/−, Apc+/−, and Apc+/−;Bmal1−/− organoids (n = 3 independent organoid lines per genotype). Data represent the mean ± SEM. Statistical significance was determined by one-way ANOVA with Tukey’s multiple comparisons for (A), (C), and (D) and with Student’s unpaired t test for (E) and (G). Asterisks represent P values from t test or multiple comparisons, with *P < 0.05, ***P < 0.001, and ****P < 0.0001.
Fig. 6.
Fig. 6.. The circadian clock is disrupted in human CRC.
(A) Representative bright-field microscopy images of organoids established from normal and tumor tissue from the same patient. Scale bars, 100 μm. (B) Detrended Bmal1-driven luminescence over time for matched normal and tumor PDOs. (C) Circadian period from PDOs was calculated in matched normal and tumor intestinal organoids using BioDare2. NR, nonrhythmic. (D) Circadian amplitude for each tumor-derived PDO normalized to the matched normal PDO from each of seven pairs. Amplitude was calculated using BioDare2. Data represent the mean ± SEM, and statistical significance was determined using Wilcoxon’s matched-pair signed-rank test. Asterisks represent the P value, with ****P < 0.0001. (E) Circadian rhythmicity determined by Bmal1-luciferase reporter activity of matched PDO pairs over 72 hours presented as a heatmap. Each row represents a normal or tumor PDO line (n = 7 independent PDO pairs). (F) Core clock gene expression in normal surrounding tissue (n = 57) versus colorectal tumors (n = 470) using TCGA. Data represent the mean ± SEM, and comparisons with a P value lower than 0.001 (two-way Student’s t test) are labeled red. (G) Heatmaps showing the correlation of gene expression among core clock genes in normal surrounding tissue and colorectal tumors. Asterisks represent significant covariance, where P < 0.001. (H) Patients with CRC in TCGA were binned into high-covariance (n = 212) or low-covariance (n = 202) categories on the basis of variance between core clock and Wnt pathway genes and shown relative to overall survival probability. P value was estimated using the log-rank method from Kaplan-Meier curves, P = 0.0032.
Fig. 7.
Fig. 7.. Model depicting how circadian clock disruption drives CRC progression.
Disruption of Bmal1 in the intestine accelerates Apc LOH, which results in the hyperactivation of Wnt signaling, including the Wnt-target gene c-Myc. In turn, MYC activates glycolytic metabolism and branch point pathways involved in supporting the demand of hyperproliferative cells. Together, circadian clock disruption drives proliferation and rewires metabolism of IECs to accelerate CRC progression in an Apc mutant background. Figure was created using biorender.com.

Similar articles

Cited by

References

    1. Nusse R., Clevers H., Wnt/β-Catenin signaling, disease, and emerging therapeutic modalities. Cell 169, 985–999 (2017). - PubMed
    1. Moser A. R., Pitot H. C., Dove W. F., A dominant mutation that predisposes to multiple intestinal neoplasia in the mouse. Science 247, 322–324 (1990). - PubMed
    1. Morin P. J., Sparks A. B., Korinek V., Barker N., Clevers H., Vogelstein B., Kinzler K. W., Activation of β-catenin-Tcf signaling in colon cancer by mutations in β-catenin or APC. Science 275, 1787–1790 (1997). - PubMed
    1. Korinek V., Barker N., Morin P. J., van Wichen D., de Weger R., Kinzler K. W., Vogelstein B., Clevers H., Constitutive transcriptional activation by a beta-catenin-Tcf complex in APC−/− colon carcinoma. Science 275, 1784–1787 (1997). - PubMed
    1. Rubinfeld B., Souza B., Albert I., Müller O., Chamberlain S. H., Masiarz F. R., Munemitsu S., Polakis P., Association of the APC gene product with β-catenin. Science 262, 1731–1734 (1993). - PubMed