. 2022 Aug 10;14(657):eabj2109.
doi: 10.1126/scitranslmed.abj2109. Epub 2022 Aug 10.

Neuroblastoma suppressor of tumorigenicity 1 is a circulating protein associated with progression to end-stage kidney disease in diabetes

Affiliations

Neuroblastoma suppressor of tumorigenicity 1 is a circulating protein associated with progression to end-stage kidney disease in diabetes

Hiroki Kobayashi et al. Sci Transl Med. .

Abstract

Circulating proteins associated with transforming growth factor-β (TGF-β) signaling are implicated in the development of diabetic kidney disease (DKD). It remains to be comprehensively examined which of these proteins are involved in the pathogenesis of DKD and its progression to end-stage kidney disease (ESKD) in humans. Using the SOMAscan proteomic platform, we measured concentrations of 25 TGF-β signaling family proteins in four different cohorts composed in total of 754 Caucasian or Pima Indian individuals with type 1 or type 2 diabetes. Of these 25 circulating proteins, we identified neuroblastoma suppressor of tumorigenicity 1 (NBL1, aliases DAN and DAND1), a small secreted protein known to inhibit members of the bone morphogenic protein family, to be most strongly and independently associated with progression to ESKD during 10-year follow-up in all cohorts. The extent of damage to podocytes and other glomerular structures measured morphometrically in 105 research kidney biopsies correlated strongly with circulating NBL1 concentrations. Also, in vitro exposure to NBL1 induced apoptosis in podocytes. In conclusion, circulating NBL1 may be involved in the disease process underlying progression to ESKD, and its concentration in circulation may identify subjects with diabetes at increased risk of progression to ESKD.


Figures

Fig. 1 |
Fig. 1 |. Association of ESKD risk in Discovery cohort with baseline concentration of 25 circulating candidate proteins. Results of univariate Cox regression analysis.
Effect size (Hazard Ratio and 95% CI) in Discovery cohort is presented per standard deviation change in protein concentration. Proteins are grouped to TGF-β signaling, BMP signaling, and Activin signaling. Bonferroni correction for n=25 independent tests (the number of examined proteins by the study design) yielded a threshold of P < 2.0×10⁻³. Bonferroni correction for n=1,129 independent tests (the number of proteins on SOMAscan) yielded a threshold of P < 4.0×10⁻⁵. Red dots show proteins that were replicated and validated in other study cohorts. See Supplementary Table S2 * Proteins which were measured only in 113 out of 219 subjects in the Discovery cohort in the 1st stage of SOMAscan screening (see methods). Anti-Muellerian hormone type-2 receptor (AMHR2) was significant (Bonferroni corrected P=0.024) in the 1st stage, but was not measured in the 2nd stage due to technical reasons.
Fig. 2 |
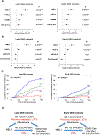
Fig. 2 |. Association of baseline circulating NBL1 with risk of ESKD in the study cohorts during 10-year follow-up.
a. Risk of ESKD according to baseline circulating concentration of each of 4 confirmed proteins in late and early DKD cohorts. Results of Cox regression analysis are shown. Effect measures were expressed as HR and 95% CI per standard deviation (SD) increase in protein concentration. Effect for each protein was adjusted for sex, duration of diabetes, HbA1c, systolic blood pressure, diastolic blood pressure, and baseline eGFR with stratification of type of diabetes. b. Effect of baseline circulating concentration of NBL1 on risk of ESKD after adjustment for other candidate proteins and baseline clinical characteristics. Results of Cox regression analysis with backward elimination of covariates are shown. Factors considered were NBL1, FSLT3, RGMB, TGF-βRIII, sex, duration of diabetes, HbA1c, systolic blood pressure, diastolic blood pressure, and baseline eGFR. Results are shown for late and early DKD cohorts. Effect measures were expressed as HR and 95% CI per SD increase in NBL1 concentration, 1% increase in HbA1c, 10 ml change in baseline eGFR, and 1 for women and 0 for men. P<0.05 was used to retain variables. c. Cumulative incidence of ESKD according to quartiles of baseline circulating concentration of NBL1 in late and early DKD cohorts. Q1, First quartile; Q2, Second quartile; Q3, Third quartile; Q4, Fourth quartile. d. Mediation analysis of association between baseline circulating concentrations of NBL1 and risk of ESKD during 10-year follow-up according to baseline albuminuria (ACR) in late and early DKD cohorts. NBL1 concentration was considered as exposure, risk of ESKD was outcome and ACR was mediator. In the analyses we used Cox regression model for 10-year risk of ESKD adjusted for sex, duration of diabetes, HbA1c, systolic blood pressure, diastolic blood pressure, and baseline eGFR with stratification of type of diabetes. Effect measures were expressed as the HR per SD increase in NBL1 concentration. The effect of a NBL1 on ESKD (total effect) is split into a natural indirect effect (through ACR) and natural direct effect, which is independent from the ACR.
Fig. 3 |
Fig. 3 |. Association between NBL1 and kidney structural lesions.
Association between baseline serum concentrations of NBL1 and structural lesions observed in research kidney biopsies obtained from 105 subjects in the T2D Pima Indian Validation cohort. Biopsies were obtained on average 1 year after baseline examination. For comparison, associations with three additional circulating proteins are shown: TNFR1- strong predictor of ESKD (71, 72), BMP7 and TGF-β1 both proteins not associated with risk of ESKD. Correlation was analyzed using Spearman rank correlation. See methods in Appendix.
Fig. 4 |
Fig. 4 |. Single Nucleus RNA Sequencing of Kidney Cortex.
Healthy control (n=3) and patients with early diabetic kidney disease (n=3) underwent nuclear dissociation and single nucleus RNA sequencing (snRNA-seq) with 10X Genomics 5’ chemistry. Libraries were processed with cellranger and Seurat. (a) UMAP of all kidney cell types identified in the aggregated dataset. PT_VCAM1=proximal tubule cells that express VCAM1, PT=proximal tubule, PEC=parietal epithelial cells, TAL=thick ascending limb, DCT1=early distal convoluted tubule, DCT2-CNT=late distal convoluted tubule and connecting tubule, PC=principal cells, ICA=type A intercalated cells, ICB=type B intercalated cells, PODO=podocytes, ENDO=endothelial cells, MC-VSMC mesangial and vascular smooth muscle cells, FIB=fibroblasts, LEUK=leukocytes (b) NBL1 is not significantly expressed in kidney cell types in either control (C) or diabetes (D) specimens. TNFRSF1A (TNFR1) is significantly expressed in multiple kidney cell types. Scale represents normalized log-fold-change and was prepared with the Seurat DotPlot function. See Supplementary Table S3 and methods in Appendix.
Fig. 5.
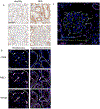
Fig. 5.. Localization of NBL1 in kidney from healthy and DKD subjects.
See methods in Appendix. Panel A. Representative 40x IHC images show proximal tubule (i, ii) and glomerular (iii, iv) localization of NBL1 (brown stain) in healthy (i, iii), and DKD kidney (ii, iv). The magnification Bar in panel i represents 60μm. Both podocyte and proximal tubule epithelial cells exhibit strong NBL1 staining in diabetic kidney disease tissue tested from 32 patients. Panel B. Representative 60x images show co-localization of NBL1 (iii and iv, pink) with CD68 positive macrophages (i and ii, green) in a glomerulus (left panels) and interstitium (right panels) of kidney tissue from a patient with diabetic kidney disease. The NBL1 positive macrophages are marked by white arrows. NBL1 staining is also present in tubular epithelial cells (iv and vi). Cell nuclei are stained with Dapi (blue). Glomerular Bowman’s capsule (i, iii, and v) and tubules (ii, iv, and vi) are outlined with dashed white line. The magnification bar in panel B represents 20μm. Panel C. Representative 40x image showing glomerular colocalization of NBL1 (pink) and Wilms Tumor-1 (WT-1, green, podocyte cell specific marker). Characteristic WT-1 positive podocytes in a diabetic kidney are labeled with arrows indicating colocalization of NBL1 signal in podocytes.
Fig. 6 |
Fig. 6 |. Effect of NBL1 exposure on apoptosis in kidney cells
(a, b, c, d). Bar graph representing cell death analysis in human podocytes (HuPodo) cultured in a dose-dependent manner with recombinant NBL1 (a), in human tubular (HuK2) and mesangial (HuMRC) cell lines (b, c) and in human umbilical vein endothelial cells (Huvec,(d) cultured with NBL1 2 ug/ml. (e). Bar graph showing the cell count of Apoptag+Synaptopodyn+ HuPodo detected in the presence/absence of NBL1 at the confocal analysis and presented as percentage of double positive cells (n=4). (f1-f2). Representative images of confocal analysis conducted on human podocytes cultured with NBL1 2 ug/ml or left untreated and stained with Apoptag and Synaptopodin. Merge pictures are presented. Magnification 20X. (g). Transcriptome analysis of apoptotic-related genes of human podocytes cultured with NBL1 2 ug/ml or left untreated. Three independent experiments were run in duplicates (a, b, c, d, e). Data are presented as mean ±SEM. *P <0.05 and ****P <0.0001 by two-sided t-test, One-way ANOVA followed adjusted for multiple comparisons. A.U., arbitrary unit; Syn, synaptopodin; APO, apoptag; HuPodo, human podocytes; HuK2, human tubular cells; HuMRC, human mesangial cells; Huvec, human umbilical vein endothelial cells; SEM, standard error of the mean. See methods in Appendix.
Fig. 7 |
Fig. 7 |. Association of circulating NBL1 with clinical characteristics
a. Fold changes in plasma concentrations of NBL1 and TNFR1 in cases over controls in T1D discovery (n=219) and T2D replication (n=144) cohorts. Fold changes in urine concentrations of NBL1 and TNFR1 normalized by urinary creatinine in cases over controls in nested case-control study of T1D (n=60) and T2D (n=52) subjects selected from the Joslin late DKD cohorts. b. Spearman rank correlation coefficient between baseline plasma NBL1 concentrations and clinical characteristics in Joslin T1D with early DKD (n=238), and urinary NBL1 concentrations and clinical characteristics in T1D (n=60) and T2D (n=52) subjects selected from the Joslin late DKD cohorts. c. Mean circulating NBL1 concentrations in relative fluorescence units (RFU) according to categories of baseline eGFR (ml/min/1.73m2) and ACR (mg/g) in Joslin T1D combined cohorts (n=457) and healthy controls (n=79). Red box shows mean RFU in healthy controls (see also Supplementary Fig. 7). There was no significant difference between concentrations of NBL1 in subjects with diabetes (ACR <30 mg/g and eGFR>120 ml/min/1.73m2) and in healthy controls (813 ± 393 vs 723 ± 150, P > 0.05).
Fig. 8 |
Fig. 8 |. Postulated mechanisms through which elevated concentrations of circulating NBL1 impact progression to ESKD.
Excessive circulating NBL1 is associated with progression to ESKD. We propose three mechanisms whereby NBL1 exerts its negative effects on kidney cells. In mechanism 1, NBL1 quenches Bone Morphogenic Proteins (BMPs) and prevents BMPs interaction with BMP-receptors (BMP-Rs) thereby favoring pro-fibrotic signaling pathways (66, 73). In mechanism 2, NBL1 binds the BMPs/BMP-Rs complex, thereby blocking its intracellular signaling and unlock the TGF-β-mediated profibrotic action (74). In mechanism 3, a NBL1-mediated BMPs-independent apoptosis of podocytes cells is postulated. Effect of normal concentration of NBL1 in circulation is indicated as blue arrows. Negative effect of elevated concentration of NBL1 in circulation is indicated as red arrows.

Comment in

Similar articles

Cited by

References

    1. Meng XM, Nikolic-Paterson DJ, Lan HY, TGF-β: the master regulator of fibrosis. Nat. Rev. Nephrol 12, 325–338 (2016). - PubMed
    1. Santibanez JF, Quintanilla M, Bernabeu C, TGF-beta/TGF-beta receptor system and its role in physiological and pathological conditions. Clin. Sci (Lond) 121, 233–251 (2011). - PubMed
    1. Liu Y, New insights into epithelial-mesenchymal transition in kidney fibrosis. J. Am. Soc. Nephrol 21, 212–222 (2010). - PMC - PubMed
    1. Pardali E, Sanchez-Duffhues G, Gomez-Puerto MC, Ten Dijke P, TGF-β-Induced Endothelial-Mesenchymal Transition in Fibrotic Diseases. Int. J. Mol. Sci 18, 2157 (2017). - PMC - PubMed
    1. Farris AB, Colvin RB, Renal interstitial fibrosis: mechanisms and evaluation. Curr. Opin. Nephrol. Hypertens 21, 289–300 (2012). - PMC - PubMed

Publication types

Substances