. 2022 Aug 10;14(657):eabo7604.
doi: 10.1126/scitranslmed.abo7604. Epub 2022 Aug 10.

Adenoviral-based vaccine promotes neoantigen-specific CD8+ T cell stemness and tumor rejection

Affiliations

Adenoviral-based vaccine promotes neoantigen-specific CD8+ T cell stemness and tumor rejection

Anna Morena D'Alise et al. Sci Transl Med. .

Abstract

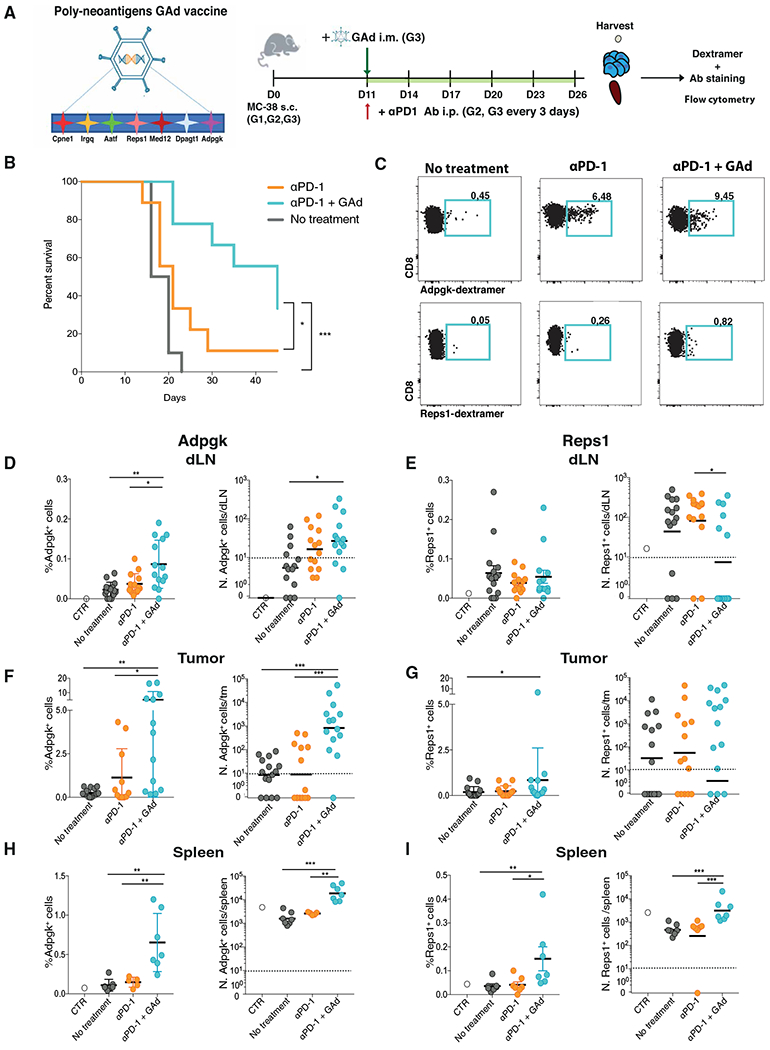
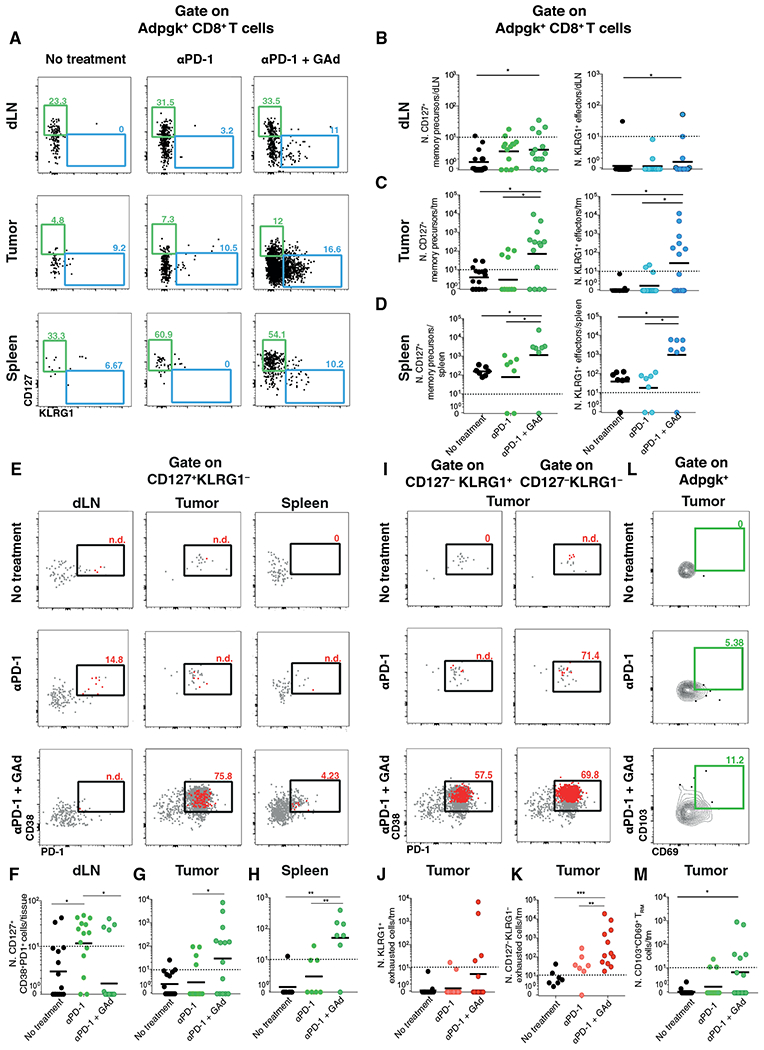
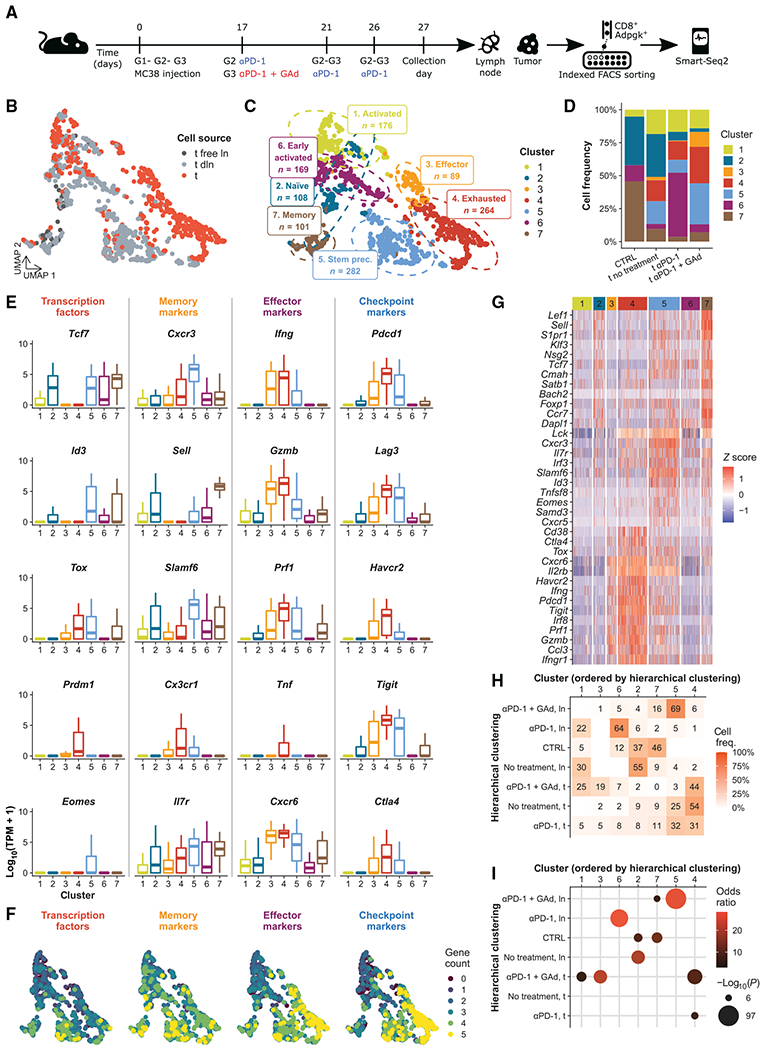
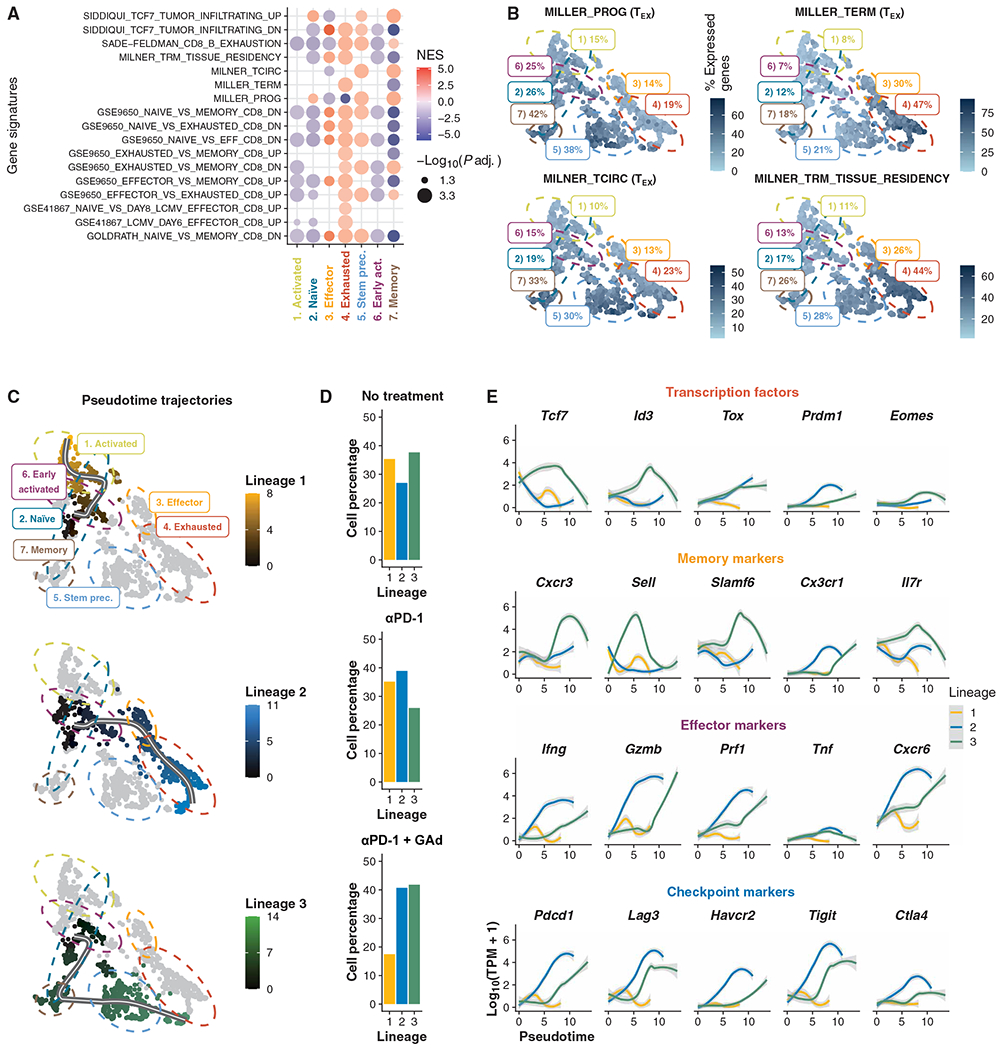
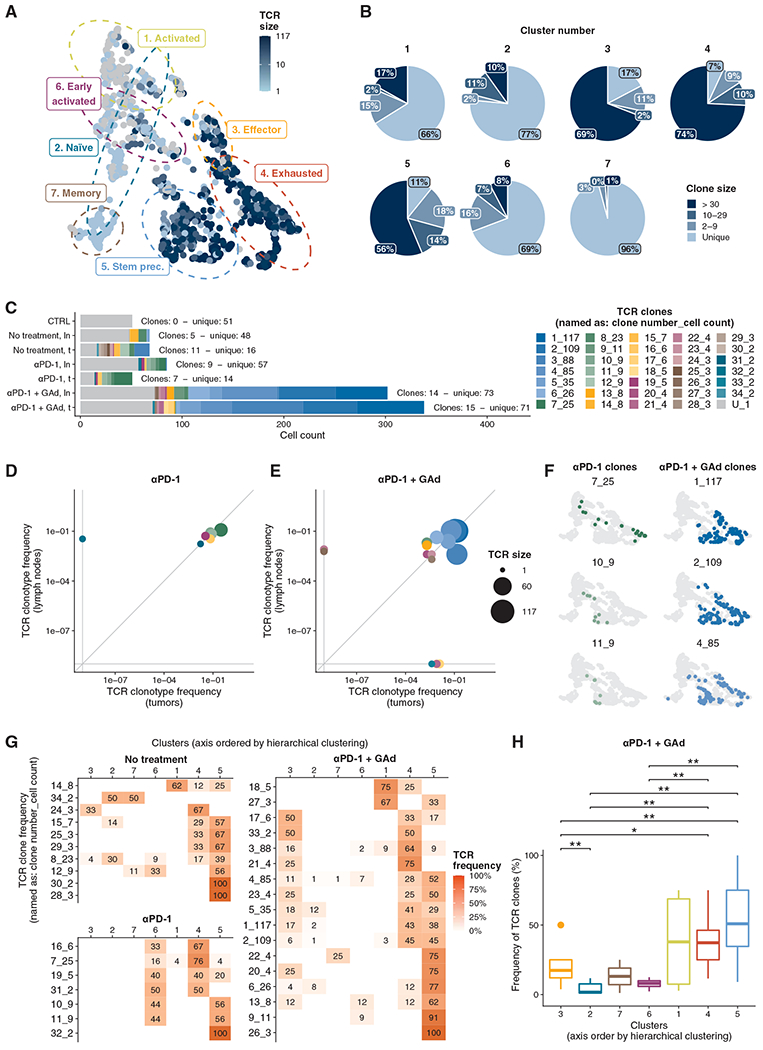
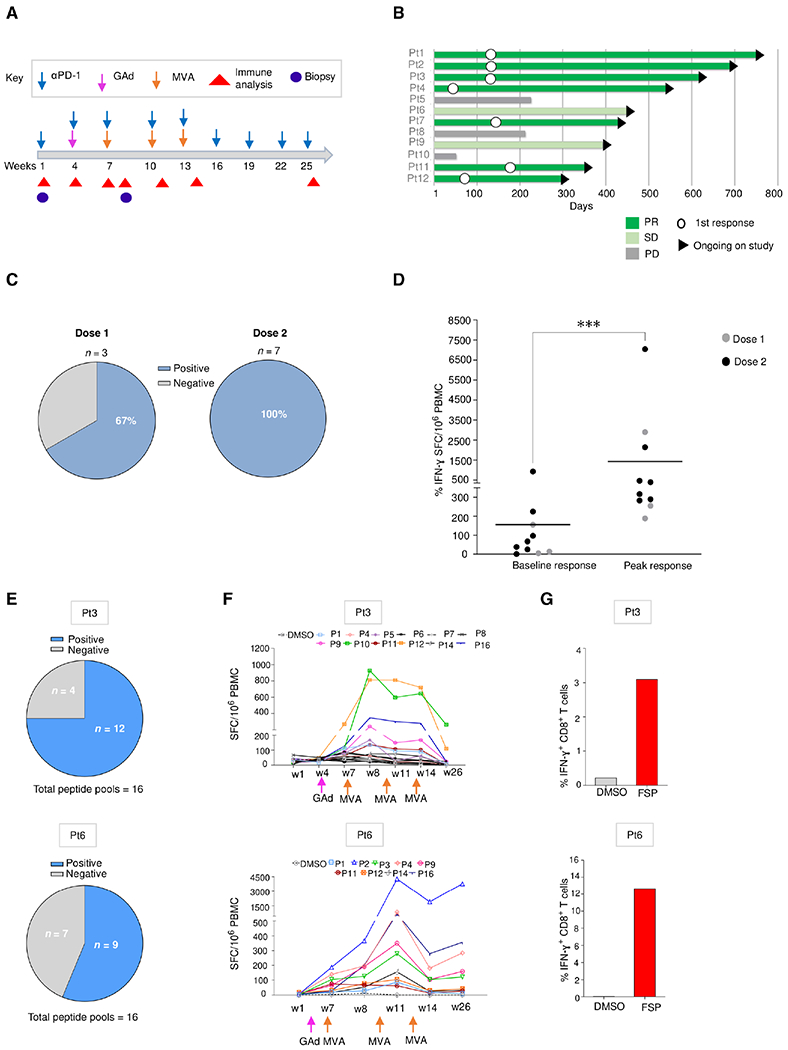
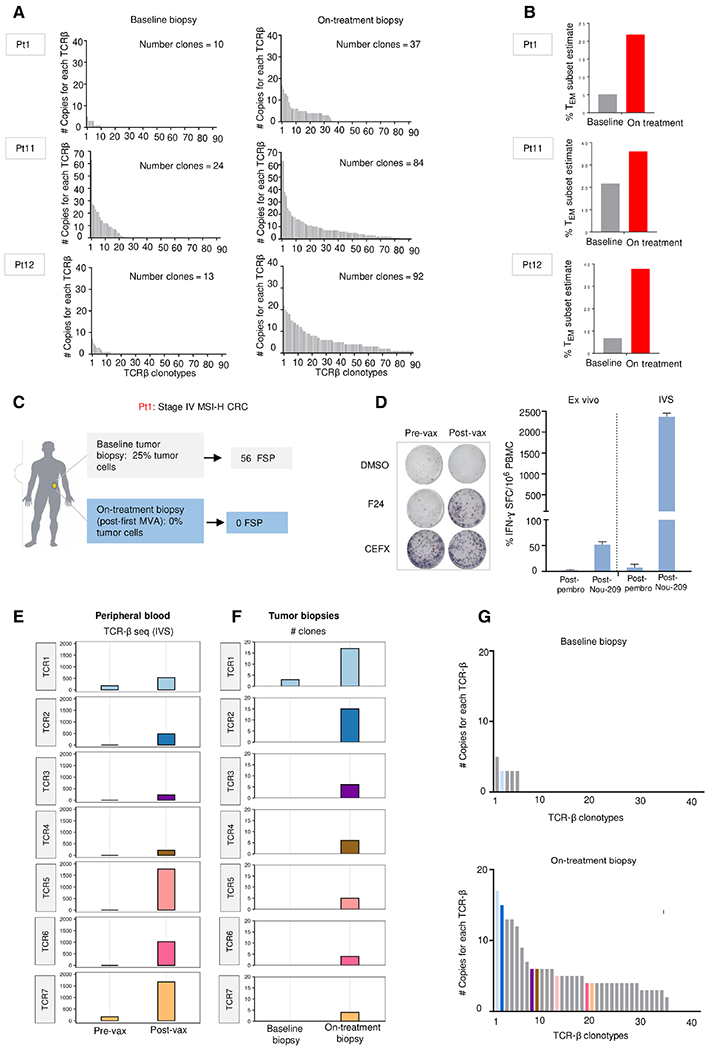
Upon chronic antigen exposure, CD8+ T cells become exhausted, acquiring a dysfunctional state correlated with the inability to control infection or tumor progression. In contrast, stem-like CD8+ T progenitors maintain the ability to promote and sustain effective immunity. Adenovirus (Ad)-vectored vaccines encoding tumor neoantigens have been shown to eradicate large tumors when combined with anti-programmed cell death protein 1 (αPD-1) in murine models; however, the mechanisms and translational potential have not yet been elucidated. Here, we show that gorilla Ad vaccine targeting tumor neoepitopes enhances responses to αPD-1 therapy by improving immunogenicity and antitumor efficacy. Single-cell RNA sequencing demonstrated that the combination of Ad vaccine and αPD-1 increased the number of murine polyfunctional neoantigen-specific CD8+ T cells over αPD-1 monotherapy, with an accumulation of Tcf1+ stem-like progenitors in draining lymph nodes and effector CD8+ T cells in tumors. Combined T cell receptor (TCR) sequencing analysis highlighted a broader spectrum of neoantigen-specific CD8+ T cells upon vaccination compared to αPD-1 monotherapy. The translational relevance of these data is supported by results obtained in the first 12 patients with metastatic deficient mismatch repair (dMMR) tumors vaccinated with an Ad vaccine encoding shared neoantigens. Expansion and diversification of TCRs were observed in post-treatment biopsies of patients with clinical response, as well as an increase in tumor-infiltrating T cells with an effector memory signature. These findings indicate a promising mechanism to overcome resistance to PD-1 blockade by promoting immunogenicity and broadening the spectrum and magnitude of neoantigen-specific T cells infiltrating tumors.


Figures

Fig. 1.
Fig. 1.. GAd vaccination combined with αPD-1 treatment reduces tumor growth by increasing the number of neoepitope-reactive CD8+ T cells in mice.
(A) Experimental design. C57BL/6J female mice (G1 to G3) were subcutaneously (s.c.) injected with MC38 adenocarcinoma colon cancer cell line. Eleven days later, G2 and G3 were intraperitoneally (i.p.) injected, every 3 days, with the monoclonal antibody (Ab) αPD-1. Eleven days after tumor implantation (tumor size between 70 and 100 mm3), G3 were also intramuscularly (i.m.) injected with poly-neoantigen Gad vaccine. Twenty-six days after tumor implantation, Db-Adpgk+ and Db-Reps1+CD8+ T cells were analyzed, in the draining lymph node, tumor, and spleen, by flow cytometry. (B) Overall survival of tumor-bearing mice was measured over time in G1, G2, and G3. (C) Representative dot plots of Db-Adpgk+CD8+ T cells and Db-Reps1+CD8+ T cells in the tumors; numbers represent percentages. (D, F, and H) Percentages and numbers (N.) of Db-Adpgk+CD8+ T cells were measured in draining lymph node (dLN) (D), tumor (tm) (F), and spleen (H). (E, G, and I) Percentages and numbers of Db-Reps1+CD8+ T cells were measured in draining lymph node (E), tumor (G), and spleen (I). Data are shown as mean with SEM (D to I, left) and geometric mean (D to I, right). *P < 0.05, **P < 0.01, and ***P < 0.001 (Mann-Whitney test). Graphs are representative of six experiments with seven mice per group.
Fig. 2.
Fig. 2.. GAd combined with αPD-1 treatment induces neoepitope-reactive memory precursor CD8+ T cells in mice.
(A) Representative dot plots of CD127 and KLRG1 markers (CD127+KLRG1 memory precursors and CD127KLRG1+ effectors); numbers represent percentages. (B to D) Number of Db-Adpgk+CD8+ T memory precursors and effectors were measured in draining lymph node (B), tumor (C), and spleen (D). (E) Representative dot plots of CD38 and PD-1 markers gated on CD127+KLRG1Db-Adpgk+CD8+ T cells. (F to H) Numbers of CD38+PD-1+ cells gated on CD127+Db-Adpgk+CD8+ T cells were measured in draining lymph node (F), tumor (G), and spleen (H). (I) Representative dot plots of exhausted CD38+PD-1+cells analyzed on gated CD127KLRG1+ (left) and on gated CD127KLRG1 (right) Db-Adpgk+ CD8+ T cells in tumor; numbers represent percentages. In red, memory precursors gated on Db-Adpgk+ CD8+ T cells were displayed; in gray, the total number of Db-Adpgk+ CD8+ T cells was displayed. (J) Numbers of exhausted Db-Adpgk+ CD8+ T cells on gated CD127KLRG1+ were measured in tumor. (K) Numbers of exhausted Db-Adpgk+ CD8+ T cells on gated CD127KLRG1 were measured in tumor. (L) Representative dot plots of CD103 and CD69 markers (CD103+CD69+ TRM cells) in tumor; numbers represent percentages out of the total CD8+ T cells isolated from the tumor. (M) Numbers of Db-Adpgk+ CD8+ TRM cells were measured in tumors. Data are shown as geometric mean (B to D, F to H, J, K, and M). *P < 0.05, **P < 0.01, and ***P < 0.001 (Mann-Whitney test). Graphs are representative of six experiments with seven mice per group. Cells below the limit of detection were indicated as non-detectable (n.d.).
Fig. 3.
Fig. 3.. scRNA-seq of CD8+ T cells identifies distinct subpopulations induced by αPD-1 + GAd vaccine in mice.
(A) Experimental design for scRNA-seq. Three groups of mice (G1 to G3) were treated as shown; CD8+ T cells isolated from untreated mice were used as the control (CTRL). (B) UMAP visualization of CD8+ T cells (n = 1189) color-coded by tissue of origin (t, tumor; ln, lymph node, dln, draining lymph node). (C) UMAP visualization of clustering results with phenotype annotations. (D) Distribution of Db-Adpgk+ CD8+ T cell frequencies in each experimental condition, color-coded by cluster. (E) Measurement of the expression of genes encoding transcription factors, memory, effector, and checkpoint markers is shown in boxplots. Kruskal-Wallis test, P ≤ 5.7−16. (F) Number of expressed marker genes from (E) projected onto UMAP. (G) Heatmap of selected top differentially expressed (DE) genes, TSTEM progenitor, and TEX CD8+ T cell signatures (29), color-coded by cluster. (H) Heatmap of cluster-wise cell frequencies for each treatment and cell type (ln, lymph node; t, tumor) and (I) results of Fisher’s exact test of those frequencies. The x- and y-axis orders were defined through hierarchical clustering. Frequencies were calculated from each combination of cell type and treatment (shown on rows) across all clusters; thus, the sum of the values of each row of the heatmap is 1 (=100%).
Fig. 4.
Fig. 4.. Phenotype landscapes and trajectories of differentiation of Db-Adpgk+ CD8+ T cells from mice.
(A) GSEA of DE genes found in clusters (adjusted P ≤0.05). NES, normalized enrichment score. (B) Percentage of signature expression of TSTEM progenitors (MILLER_PROG.) and TEX CD8+ T cells (MILLER_TERM), core circulating (MILNER_TCIRC), and core tissue-resident memory T cell (MILNER_TRM_TISSUE_RESIDENCY) signatures (29, 32) in each cell. (C) Trajectory inference results shown as pseudotime projected onto UMAP. (D) Bar plots of cell percentages across experimental treatments for each lineage. (E) Locally weighted scatterplot smoothing of expression of transcription factors, memory, effector, and checkpoint markers along pseudotime trajectories.
Fig. 5.
Fig. 5.. Expanded TCR clonotypes are in memory progenitor stem-like and exhausted stages in lymph nodes and tumors of mice, respectively.
(A) T cell receptor (TCR) clonotype size of each Db-Adpgk+ CD8+ T cell projected onto UMAP. (B) Pie charts of TCR clonotype size for each cluster. (C) Distribution of TCR clonotype size in the different experimental groups, color-coded by TCR. The TCR label indicates the numeric ID of each clonotype and the number of cells belonging to the clonotypes before and after the underscore, respectively. “U” indicates unique TCRs. Numbers of clones and unique TCRs are annotated on the plot. (D and E) Scatterplot of cell frequencies for each TCR clonotype in lymph node and tumors isolated from (D) αPD-1–treated and (E) αPD-1 + GAd–treated mice, respectively. (F) Examples of TCR distributions projected onto UMAP for αPD-1– and αPD-1 + GAd–treated mice, respectively. (G) TCR-wise frequencies from cell counts of clonotypes across clusters. Axis order was defined through hierarchical clustering. (H) Distribution of TCR cell frequencies from αPD-1 + GAd–treated mice among clusters (Wilcoxon signed-rank test).
Fig. 6.
Fig. 6.. Nous-209 vaccination elicits a strong and broad neoantigen-specific T cell response in patients with dMMR tumors.
(A) Clinical event timeline for 12 vaccinated patients (Pt) from baseline to the latest time point; treatments include αPD-1 combined with GAd and MVA vaccine prime boost administrations. (B) Clinical responses after treatment as assessed by tumor imaging per RECIST v1.1: response duration shown as a swimmer plot for tumor response over time. White circles indicate time of first response. The arrowheads on the right indicate continuing study treatment. (C and D) Immune responses measured in patients (n = 10) after Nous-209 vaccine by ex vivo IFN-γ. Immunogenicity was assessed by ex vivo IFN-γ ELISpot on peripheral blood mononuclear cells (PBMCs) stimulated with 16 pools of overlapping peptides covering the entire vaccine sequence. (C) Frequency of patients showing a positive response after vaccination and number of SFCs/million PBMCs corresponding to the sum of the responses to the single pools. Dot plot in (D) represents peak responses for each individual subject, compared with baseline prevaccination responses after pembrolizumab. Lines represent the mean of immune response. (E to G) Breadth of immune responses: number of FSP-positive pools (E), kinetic T cell responses measured by ex vivo IFN-γ ELISpot (F), and IFN-γ+ FSP-specific CD8+ T cells measured by intracellular staining (ICS) and flow cytometry after vaccination (G) are reported for patients 3 (dose 1) and 6 (dose 2).
Fig. 7.
Fig. 7.. TCR neoantigen-specific T cell clonotype repertoire is expanded and diversified after Nous-209 vaccination.
(A) Expansion and diversification of TCR-β repertoire in preand posttreatment tumor biopsies in three patients with clinical response (PR). (B) Estimated mRNA fraction of effector memory T (TEM) cells on tumor samples before and after treatment according to gene expression data (34). (C) Study of patient 1 (Pt1), a stage IV microsatellite instability–high (MSI-H) CRC, second line (2L) in PR. For this patient, baseline tumor biopsy and on-treatment biopsy were collected before the first pembrolizumab administration (week 1) and after first MVA (week 8), respectively. (D) T cell responses in Pt1 were measured by IFN-γ ELISpot assay performed ex vivo and after in vitro restimulation (IVS) with a peptide specific for one encoded FSP (FSP 24). Tested PBMC were collected after pembrolizumab (week 4) and after vaccination (week 7). DMSO and CEFX were used as negative and positive control, respectively. (E) TCR-β sequencing of PBMCs stimulated in vitro with the F24 peptide. The abundance of seven TCR-β clonotypes shared among PBMCs stimulated in vitro with F24 peptide and the clonotypes in the on-treatment tumor biopsy, detected by RNA-seq, are represented. (F) Bar plots represent the abundance of the seven clonotypes analyzed at baseline and after treatment on the tumor biopsies. Only one TCR (TCR1) was also found in the baseline biopsy as already present in the tumor and expanded after treatment, whereas the other six clones were exclusively detected in the posttreatment biopsy. (G) Expansion and diversification of TCR-β repertoire in pre- and posttreatment tumor biopsies. The clonotypes detected on the tumor biopsies of Pt1 are shown. Each bar is a TCR-β individual clone; colored bars indicated seven TCR clonotypes specific for F24 FSP identified in (F).

References

    1. Pace L, Temporal and epigenetic control of plasticity and fate decision during CD8+ T-cell memory differentiation. Cold Spring Harb. Perspect. Biol 13, a037754 (2021). - PMC - PubMed
    1. Oliveira G, Stromhaug K, Klaeger S, Kula T, Frederick DT, Le PM, Forman J, Huang T, Li S, Zhang W, Xu Q, Cieri N, Clauser KR, Shukla SA, Neuberg D, Justesen S, MacBeath G, Carr SA, Fritsch EF, Hacohen N, Sade-Feldman M, Livak KJ, Boland GM, Ott PA, Keskin DB, Wu CJ, Phenotype, specificity and avidity of antitumour CD8+ T cells in melanoma. Nature 596, 119–125 (2021). - PMC - PubMed
    1. Im SJ, Hashimoto M, Gerner MY, Lee J, Kissick HT, Burger MC, Shan Q, Hale JS, Lee J, Nasti TH, Sharpe AH, Freeman GJ, Germain RN, Nakaya HI, Xue HH, Ahmed R, Defining CD8+ T cells that provide the proliferative burst after PD-1 therapy. Nature 537, 417–421 (2016). - PMC - PubMed
    1. He R, Hou S, Liu C, Zhang A, Bai Q, Han M, Yang Y, Wei G, Shen T, Yang X, Xu L, Chen X, Hao Y, Wang P, Zhu C, Ou J, Liang H, Ni T, Zhang X, Zhou X, Deng K, Chen Y, Luo Y, Xu J, Qi H, Wu Y, Ye L, Follicular CXCR5-expressing CD8+ T cells curtail chronic viral infection. Nature 537, 412–416 (2016). - PubMed
    1. Hudson WH, Gensheimer J, Hashimoto M, Wieland A, Valanparambil RM, Li P, Lin JX, Konieczny BT, Im SJ, Freeman GJ, Leonard WJ, Kissick HT, Ahmed R, Proliferating transitory T cells with an effector-like transcriptional signature emerge from PD-1+ stem-like CD8+ T cells during chronic infection. Immunity 51, 1043–1058.e4 (2019). - PMC - PubMed

Publication types

Substances