. 2022 Aug 26;50(15):8626-8642.
doi: 10.1093/nar/gkac666.

Resistance of mitochondrial DNA to cadmium and Aflatoxin B1 damage-induced germline mutation accumulation in C. elegans

Affiliations

Resistance of mitochondrial DNA to cadmium and Aflatoxin B1 damage-induced germline mutation accumulation in C. elegans

Tess C Leuthner et al. Nucleic Acids Res. .

Abstract

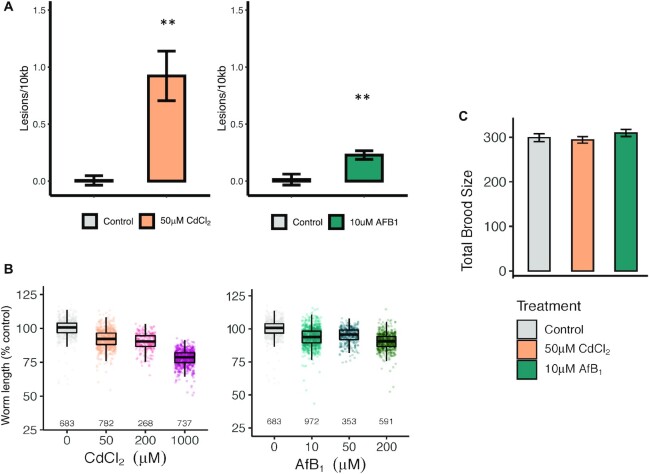
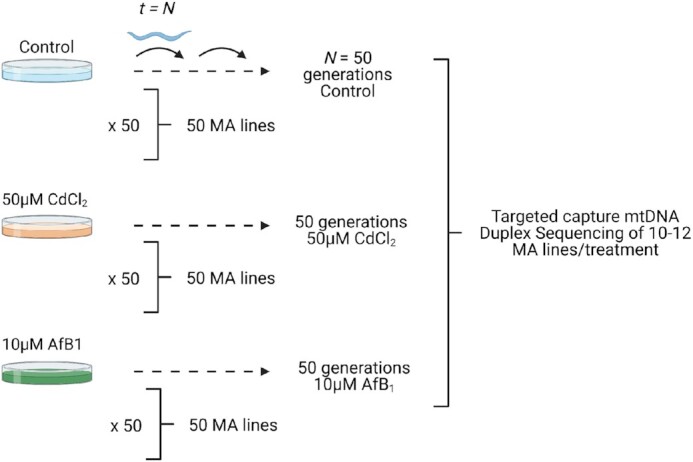
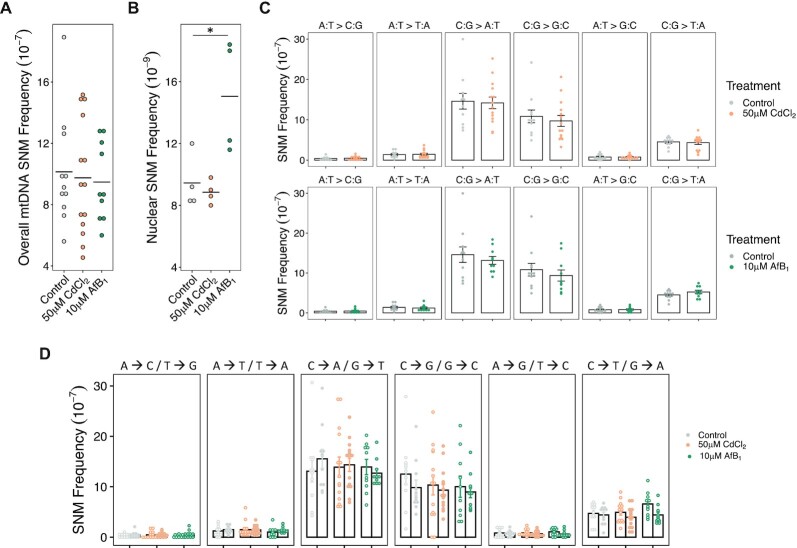
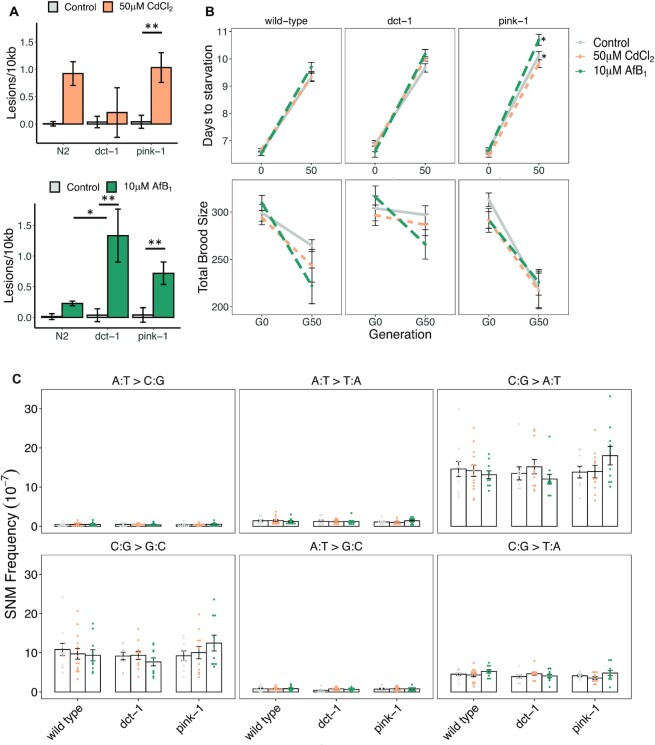
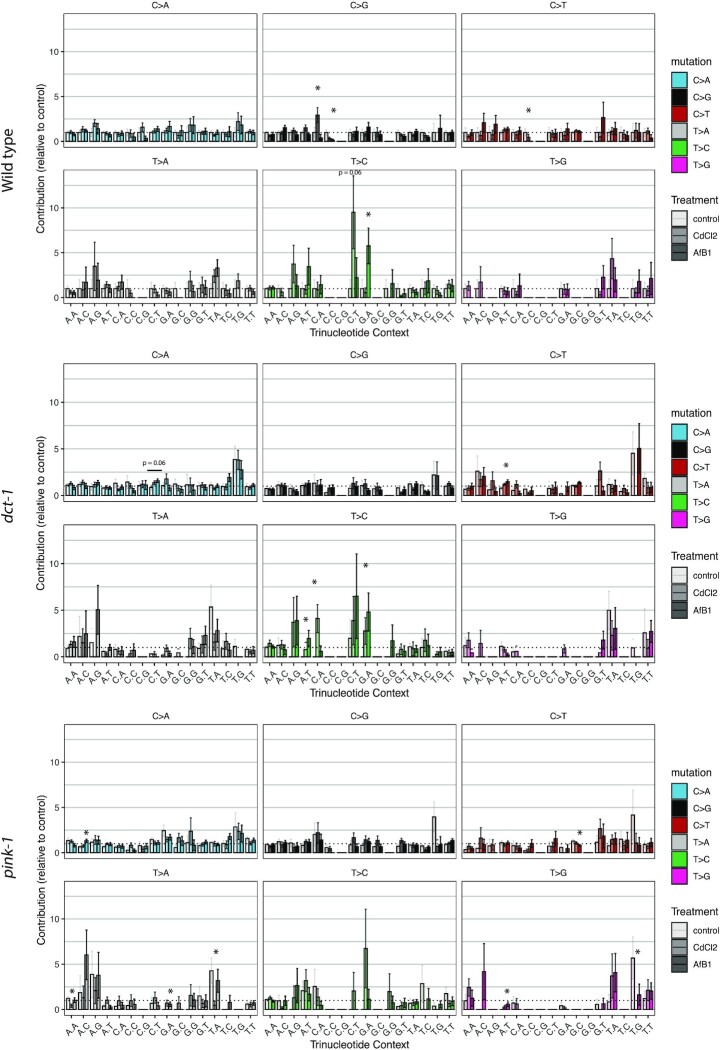
Mitochondrial DNA (mtDNA) is prone to mutation in aging and over evolutionary time, yet the processes that regulate the accumulation of de novo mtDNA mutations and modulate mtDNA heteroplasmy are not fully elucidated. Mitochondria lack certain DNA repair processes, which could contribute to polymerase error-induced mutations and increase susceptibility to chemical-induced mtDNA mutagenesis. We conducted error-corrected, ultra-sensitive Duplex Sequencing to investigate the effects of two known nuclear genome mutagens, cadmium and Aflatoxin B1, on germline mtDNA mutagenesis in Caenorhabditis elegans. Detection of thousands of mtDNA mutations revealed pervasive heteroplasmy in C. elegans and that mtDNA mutagenesis is dominated by C:G → A:T mutations generally attributed to oxidative damage. However, there was no effect of either exposure on mtDNA mutation frequency, spectrum, or trinucleotide context signature despite a significant increase in nuclear mutation rate after aflatoxin B1 exposure. Mitophagy-deficient mutants pink-1 and dct-1 accumulated significantly higher levels of mtDNA damage compared to wild-type C. elegans after exposures. However, there were only small differences in mtDNA mutation frequency, spectrum, or trinucleotide context signature compared to wild-type after 3050 generations, across all treatments. These findings suggest mitochondria harbor additional previously uncharacterized mechanisms that regulate mtDNA mutational processes across generations.


Figures

Figure 1.
Figure 1.
50μM CdCl2 and 10 μM AfB1 exposure induces mtDNA lesions in wild-type C. elegans, but has no effect on growth or reproduction. (A) mtDNA damage from pools of six individual age-synchronized L4 C. elegans was quantified after chronic exposure to control (N = 8), 50 μM CdCl2 (N = 8) or 10 μM AfB1 (N = 4) (** P< 0.01, one-way ANOVA). (B) A dose–response was conducted to measure effects on growth after 48 h of exposure (L1–L4). Each individual worm length was first normalized to the mean control length for each experiment. Dots represent technical replicates (individual nematodes, total N displayed) and the boxplots display the median and upper and lower quartiles. The mean normalized length was then calculated within each experimental replicate. There was no effect of growth after exposure to 50 μM or 200 μM CdCl2, but we observed 22% growth inhibition at 1000 μM CdCl2 compared to control (P = 0.15, P= 0.2, P= 0.009, respectively; one-way ANOVA, Tukey HSD). We did not observe growth inhibition after 10 μM or 50 μM AfB1 compared to control, but did observe 11% growth inhibition at 200 μM AfB1, though trending (P= 0.27, P= 0.59, P= 0.09, respectively; one-way ANOVA, Tukey HSD). (C) There was no effect of either 50 μM CdCl2 or 10 μM AfB1 on total brood size compared to control (N = 9–10, P= 0.9, P= 0.63, respectively; one-way ANOVA, Tukey HSD). Error bars indicate standard error (* P< 0.05; ** P< 0.01).
Figure 2.
Figure 2.
Schematic of mutation accumulation line experimental design. Offspring of a single founding ancestor (G0) were isolated onto individual plates. Every t = 4 days, a single L4 nematode was randomly selected and transferred to a new plate. This was repeated every generation (G) for 50 generations. We conducted MA lines on control plates, and plates that contained OP50 that was spiked with a final concentration of 50 μM CdCl2 and 10 μM AfB1. We conducted MA line experiments in wild-type C. elegans and two mitophagy mutant strains, dct-1 and pink-1. 50 replicate ‘sublines’ were passaged for each strain*treatment. MA lines were randomly selected after 50 generations per subline (9–14 MA lines/strain/treatment) for life history analysis and targeted mtDNA Duplex-Sequencing. Image created with BioRender.com.
Figure 3.
Figure 3.
The mtDNA single nucleotide mutation signature in wild-type C. elegans is consistent with oxidative damage and demonstrates resistance to point mutations caused by CdCl2 and AfB1 mtDNA lesions. (A) Overall mtDNA SNM frequency was determined by Duplex Sequencing after 50 generations of mutation accumulation per subline in wild-type C. elegans in control conditions (gray dots; N = 11), as well as after 50 generations per subline of exposure to 50 μM CdCl2 (gold dots; N = 14) and 10 μM AfB1 (green dots, N = 10). There was no effect of either 50 μM CdCl2 or 10 μM AfB1 on overall mtDNA mutation frequency compared to control (P= 0.96, P =0.90, respectively); one-way ANOVA, Tukey HSD). Horizontal lines indicate mean values. (B) Overall nuclear SNM rates of a subset of MA lines in each treatment (N = 4 per treatment). There was no effect of 50 μM CdCl2 on overall SNM rate, but there was a 1.6-fold increase in overall SNM rate after exposure to 10 μM AfB1 (P = 0.01; ANOVA). Horizontal lines indicate mean rates. (C) mtDNA mutation spectrum of control, CdCl2 and AfB1-treated MA lines. Each dot represents a single MA line. The wild-type C. elegans mtDNA mutational signature was dominated by C:G → A:T and C:G → G:C transversion mutations, and there was no effect of Cd or AfB1 exposure on mtDNA mutational signature (Welch two-sample t-test). Error bars represent standard error of the mean. (D) mtDNA lesions may accumulate disproportionately on mtDNA strands, resulting in mtDNA mutation strand bias. We observed a trend towards an increase in C → T over G → A mutations after exposure to AfB1 compared to control (P = 0.08; two-way ANOVA, Tukey HSD). Open circles indicate one strand (i.e. A → C) and filled circles indicate the other strand (i.e. T → G).
Figure 4.
Figure 4.
Mitophagy deficient mutants accumulate higher levels of mtDNA damage and exhibit greater fitness declines compared to wild-type, but exhibit no differences in mtDNA mutation frequencies after exposures. (A) mtDNA damage from pools of six individual age-synchronized L4 C. elegans after exposure to control (N = 8), 50 μM CdCl2 (N = 8) or 10 μM AfB1 (N = 8). pink-1 mutants accumulated mtDNA damage after exposure to CdCl2, but not more than wild-type, while dct-1 mutants did not accumulate mtDNA damage. Both mutants accumulated high levels of mtDNA damage after exposure to AfB1, and dct-1 accumulated significantly higher levels compared to wild-type exposed C. elegans. Error bars indicate standard error of the mean (* P < 0.05; ** P< 0.01; two-way ANOVA, Tukey HSD). (B) Population growth rate and total brood size as indicators of fitness in ancestors (G0) and after 50 generations of MA in all lines (G50). Each dot represents the mean value of days to starvation (until all of the food was eliminated and the population dispersed on the plate), with error bars as standard error of the mean (N = 3 for G0, N = 39- 48 for G50 MA lines). Lines indicate the rate of change in fitness from G0 to G50 (gray solid = control, gold small dash = 50 μM CdCl2, and green large dash = 10 μM AfB1) for wild-type, dct-1, and pink-1 strains. Y-axis lower limit begins at Day 6. There was no effect of 50 μM CdCl2 or 10 μM AfB1 on population growth rate in any strain at G0. All MA lines had significantly slower population growth rate at G50 compared to G0 (two-way ANOVA, P <2.2e–16). There was no effect of either CdCl2 or AfB1 on wild-type MA lines at G50 (P= 1, P= 0.95, respectively; two-way ANOVA, Tukey HSD). There was no effect of either CdCl2 or 10 μM AfB1 on dct-1 MA lines at G50 (P= 0.98, P= 0.6, respectively; two-way ANOVA, Tukey HSD). There was no effect of either CdCl2 or 10 μM AfB1 on pink-1 MA lines at G50 (P= 1, P= 0.4, respectively; two-way ANOVA, Tukey HSD). Both control and 10 μM AfB1pink-1 MA lines had a significantly greater decline in fitness compared to control and 10 μM AfB1 wild-type MA lines (P= 0.03, P = 0.0008, respectively; two-way ANOVA, Tukey HSD). At G50, three individual L4s per MA line were transferred onto an individual control plate for brood size experiments. Each individual was transferred every day until cessation of egg-laying. Reproduction was counted on the previous plate after 48 h. Each dot represents the mean value total brood size per MA line, with error bars indicating standard error of the mean (N = 9–10 for G0, N = 18–20 for G50 MA lines). Lines indicate the rate of change in fitness from G0 to G50 (gray solid = control, gold small dash = 50 μM CdCl2, and green large dash = 10 μM AfB1) for wild-type, dct-1, and pink-1 strains. The y-axis lower limit begins at 190. All MA lines had significantly lower fecundity at G50 compared to G0 (P =2.596e–11; two-way ANOVA). However, there was no effect of either CdCl2 or 10 μM AfB1 on total brood size in wild-type MA lines (P= 1, P =0.7, respectively; two-way ANOVA, Tukey HSD). pink-1 control MA lines had significantly smaller broods than dct-1 control MA lines at G50 (P< 0.01; two-way ANOVA, Tukey HSD) and pink-1 CdCl2 MA lines had significantly smaller broods than dct-1 CdCl2 MA lines at G50 (P= 0.03), suggesting a decrease in fitness in pink-1 MA lines compared to dct-1 MA lines. (C) Mutation spectrum of control (gray), CdCl2 (gold), and AfB1 (green) treated MA lines in wild-type, dct-1, and pink-1 strains. The mitophagy mutant C. elegans mtDNA mutational signatures were also dominated by C:G → A:T and C:G → G:C transversion mutations, and there was no effect of CdCl2 or AfB1 exposure on dct-1 or pink-1 mtDNA mutational signature (two-way ANOVA). Error bars indicate standard error of the mean.
Figure 5.
Figure 5.
Trinucleotide context mutational signature of wild-type, dct-1 and pink-1 C. elegans after exposure to CdCl2 or AfB1. Contributions of each of the 96 possible trinucleotide mutations were determined for each MA line, and then normalized to the mean wild-type control contribution (show as a dashed line) to determine effects relative to wild-type control. Bar graphs show the relative mean and standard error of each trinucleotide context mutation, with each mutation represented by a different color and control, CdCl2 and AfB1 treatment as increasing color hues. Potential effects of each exposure compared to control were determined within each mutation type (Welch two-sample t-test) only after a significant ANOVA was determined. * P< 0.05.

Similar articles

Cited by

References

    1. Johnston I.G., Williams B.P.. Evolutionary inference across eukaryotes identifies specific pressures favoring mitochondrial gene retention. Cell Syst. 2016; 2:101–111. - PubMed
    1. Bannwarth S., Procaccio V., Lebre A.S., Jardel C., Chaussenot A., Hoarau C., Maoulida H., Charrier N., Gai X., Xie H.M.et al. .. Prevalence of rare mitochondrial DNA mutations in mitochondrial disorders. J. Med. Genet. 2013; 50:704–714. - PMC - PubMed
    1. Hertweck K.L., Dasgupta S.. The landscape of mtDNA modifications in cancer: a tale of two cities. Front. Oncol. 2017; 7:262. - PMC - PubMed
    1. Ju Y.S., Alexandrov L.B., Gerstung M., Martincorena I., Nik-Zainal S., Ramakrishna M., Davies H.R., Papaemmanuil E., Gundem G., Shlien A.et al. .. Origins and functional consequences of somatic mitochondrial DNA mutations in human cancer. Elife. 2014; 3:e02935. - PMC - PubMed
    1. Tuppen H.A.L., Blakely E.L., Turnbull D.M., Taylor R.W.. Mitochondrial DNA mutations and human disease. BBA - Bioenerg. 2009; 1797:113–128. - PubMed

Publication types