. 2022 Aug 9;40(6):111172.
doi: 10.1016/j.celrep.2022.111172.

Nano-organization of spontaneous GABAergic transmission directs its autonomous function in neuronal signaling

Affiliations

Nano-organization of spontaneous GABAergic transmission directs its autonomous function in neuronal signaling

Natalie J Guzikowski et al. Cell Rep. .

Abstract

Earlier studies delineated the precise arrangement of proteins that drive neurotransmitter release and postsynaptic signaling at excitatory synapses. However, spatial organization of neurotransmission at inhibitory synapses remains unclear. Here, we took advantage of the molecularly specific interaction of antimalarial artemisinins and the inhibitory synapse scaffold protein, gephyrin, to probe the functional organization of gamma-aminobutyric acid A receptor (GABAAR)-mediated neurotransmission in central synapses. Short-term application of artemisinins severely contracts the size and density of gephyrin and GABAaR γ2 subunit clusters. This size contraction elicits a neuronal activity-independent increase in Bdnf expression due to a specific reduction in GABAergic spontaneous, but not evoked, neurotransmission. The same functional effect could be mimicked by disruption of microtubules that link gephyrin to the neuronal cytoskeleton. These results suggest that the GABAergic postsynaptic apparatus possesses a concentric center-surround organization, where the periphery of gephyrin clusters selectively maintains spontaneous GABAergic neurotransmission facilitating its autonomous function regulating Bdnf expression.

Keywords: CP: Neuroscience; GABAergic transmission; artemisinin; spontaneous neurotransmission; super resolution imaging; synapse nanostructure; synaptic transmission.


Conflict of interest statement

Declaration of interests The authors declare no competing interests.

Figures

Figure 1.
Figure 1.. Artemisinin treatment has a specific postsynaptic effect, decreasing gephyrin cluster volume
(A) Description of experimental design; preparation of primary hippocampal cultures and treatment with artemisinins before electrophysiology and immunocytochemistry experiments. (B) Molecular structure of artemisinins (Kasaragod et al., 2019) and diagram of molecular interaction of artemisinins and GABAAR intracellular loops between transmembrane domains 3–4 binding to the gephyrin universal binding pocket on the GephE domain. (C) Following 1-h control (DMSO) and 50 μM artemisinin treatment, neurons were co-immunolabeled for vGAT (presynaptic marker, green), gephyrin (postsynaptic marker, red), and MAP2 (dendrite, blue). The colocalization of vGAT and gephyrin puncta represent inhibitory puncta. (D) Quantitative analyses of inhibitory puncta per 10 μm of dendrite (ordinary one-way ANOVA p = 0.0137, Dunnett’s multiple comparisons test DMSO versus artemether p = 0.4367, DMSO versus artemisinin p = 0.1475, DMSO versus artesunate p = 0.9308. Sample size is equivalent to number of regions imaged: DMSO n = 12, artemether n = 10, artemisinin n = 16, artesunate n = 13). (E) 3D dSTORM reconstructions of colocalized and pre- and postsynaptic clusters with localizations color coded by probe (vGAT, blue; gephyrin, pink). (F) Quantitative analyses of gephyrin cluster volume (Kruskal-Wallis test p = 0.0001, Dunn’s multiple comparisons test DMSO versus artemether p = 0.0011, DMSO versus artemisinin p = 0.0003, DMSO versus artesunate p = 0.4738. Sample size is equivalent to number of regions imaged: DMSO n = 7, artemether n = 7, artemisinin n = 9, artesunate n = 6). (G) vGAT cluster volume (Kruskal-Wallis test p = 0.0872, Dunn’s multiple comparisons test DMSO versus artemether p = 0.9122, DMSO versus artemisinin p > 0.9999, DMSO versus artesunate p = 0.19991. Sample size is equivalent to number of regions imaged: DMSO n = 7, artemether n = 7, artemisinin n = 9, artesunate n = 6). (H) Distance between center of vGAT and gephyrin colocalized clusters (Kruskal-Wallis test p = 0.8732, Dunn’s multiple comparisons DMSO versus artemether p > 0.9999, DMSO versus artemisinin p > 0.9999, DMSO versus artesunate p > 0.9999. Sample size is equivalent to number of regions imaged: DMSO n = 7, artemether n = 7, artemisinin n = 9, artesunate n = 6). (I) Proposed schematic of how pre- and postsynapse centroid distance is unchanged following the loss of gephyrin. Graphs are mean ± SEM. Significance reported as *p < 0.05, **p < 0.01, ***p < 0.001, and ****p < 0.0001. NS denotes non-significance.
Figure 2.
Figure 2.. Artemether and parental artemisinin decrease gephyrin cluster density
(A) 3D dSTORM reconstructions of gephyrin molecules with localizations represented by density heatmap. (B) Quantitative analysis of gephyrin cluster density at individual annuli thickness of 5 nm (mixed-effects analysis treatment group factor p < 0.0001, DMSO versus artemether p = 0.0002, DMSO versus artemisinin p = 0.0024, DMSO versus artesunate p = 0.1558. Sample size is equivalent to number of clusters analyzed: DMSO n = 35, artemether n = 31, artemisinin n = 34, artesunate n = 35; refer to Table S1 for individual radii statistical results). (C–F) (C) Pair correlation functions of gephyrin clusters for all treatment groups to a radius of 300 nm and (D) for artemether (n = 28) and DMSO (n = 34) to 100 nm radius, (E) artemisinin (n = 33) and DMSO to 100 nm radius, and (F) artesunate (n = 33) and DMSO to 100 nm radius. Graphs are mean ± SEM. Significance reported as *p < 0.05, **p < 0.01, ***p < 0.001, and ****p < 0.0001. NS denotes non-significance.
Figure 3.
Figure 3.. Functional impact of artemisinin treatment
(A) 3D dSTORM reconstructions of GABAAR γ2 clusters with localizations color coded by treatment (DMSO, gray; artemisinin, blue). (B and C) (B) Quantitative analyses of GABAAR γ2 cluster surface area (Mann-Whitney test p < 0.0001. Sample size is equivalent to number of regions imaged: DMSO n = 7, artemisinin n = 7) and (C) GABAAR γ2 cluster sphericity (Mann-Whitney test p = 0.0010. Sample size is equivalent to number of regions imaged: DMSO n = 7, artemisinin n = 7). (D) Representative traces of whole-cell current-clamp action potentials following 1-h control (DMSO) and 50 μM artemisinin treatment. (E) Cumulative distribution of action potential inter-event interval (Kolmogorov-Smirnov test, p < 0.0001, sample size is equivalent to number of cells recorded from DMSO n = 13, artemisinin n = 13). (F and G) (F) Quantitative analyses of resting membrane potential (Mann-Whitney test, p = 0.9250, sample size is equivalent to number of cells recorded from DMSO n = 13, artemisinin n = 12), and (G) sub-threshold event amplitude (EPSP) (Mann-Whitney test, p = 0.4636. Sample size is equivalent to number of events analyzed: DMSO n = 120, artemisinin n = 120). (H) Bdnf mRNA expression normalized to DMSO following artemisinin (unpaired t test, p = 0.0343, sample size is equivalent to the number of independent groups: DMSO n = 10, artemisinin n = 8). (I) Tetrodotoxin (TTX) treatment (unpaired t test, p = 0.7890, DMSO n = 6, TTX n = 6). Graphs are mean ± SEM. Significance reported as *p < 0.05, **p < 0.01, ***p < 0.001, and ****p < 0.0001. NS denotes non-significance.
Figure 4.
Figure 4.. Artemether and parental artemisinin treatment selectivity decreased inhibitory miniature events
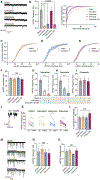
(A) Representative traces of whole-cell voltage-clamp mIPSCs following 1-h control (DMSO) and 50 μM artemisinin treatment. (B) Quantitative analyses of mIPSC frequency (Kruskal-Wallis test p < 0.0001, Dunn’s multiple comparisons test DMSO versus artemether p = 0.0002, DMSO versus artemisinin p = 0.0020, DMSO versus artesunate p > 0.9999, DMSO versus artesunate 24 h p = 0.0672. Sample size is equivalent to number of cells recorded from DMSO: n = 15, artemether n = 8, artemisinin n = 10, artesunate n = 12, artesunate 24 h n = 5) and cumulative distribution of mIPSC inter-event intervals (IEIs). (C) Cumulative distribution of mIPSC amplitude following artemether treatment (Kolmogorov-Smirnov test p < 0.0001, DMSO n = 15, artemether n = 8). (D) Artemisinin treatment (Kolmogorov-Smirnov test p < 0.0001, DMSO n = 15, artemisinin n = 10). (E) Artesunate treatment (Kolmogorov-Smirnov test p < 0.0001, DMSO n = 15, artesunate n = 12). (F) Quantitative analysis of mIPSC amplitude (average per coverslip) (ordinary one-way ANOVA p = 0.2030. Sample size is equivalent to number of cells recorded from DMSO n = 15, artemether n = 8, artemisinin n = 10, artesunate n = 12). (G) Quantitative analyses of mIPSC frequency following 1-h control (DMSO) and 50 μM artemether treatment with artemether included (same data as Figure 4B) and not included in Tyrode’s bath solution (Kruskal-Wallis test, p < 0.0001, Dunn’s multiple comparison test DMSO versus artemether incubation p = 0.1035, DMSO versus artemether incubation + bath p < 0.0001, artemether incubation versus artemether incubation + bath p = 0.2954, DMSO n = 17, artemether incubation n = 6, artemether incubation + bath n = 10). (H) 50 μM artemisinin treatment with artemisinin included (same data as Figure 4B) and not included in Tyrode’s bath solution (Kruskal-Wallis test, p < 0.0001, Dunn’s multiple comparison test DMSO versus artemisinin incubation p = 0.3020, DMSO versus artemisinin incubation + bath p < 0.0001, artemisinin incubation versus artemisinin incubation + bath p = 0.0506, DMSO n = 18, artemisinin incubation n = 9, artemisinin incubation + bath n = 12). (I) 50 μM artesunate treatment with artesunate included (same data as Figure 4B) and not included in Tyrode’s bath solution (Kruskal-Wallis test, p = 0.6794, Dunn’s multiple comparison test DMSO versus artesunate incubation p > 0.999, DMSO versus artemisinin incubation + bath p > 0.999, artesunate incubation versus artesunate incubation + bath p > 0.999, DMSO n = 17, artesunate incubation n = 8, artesunate incubation + bath n = 12). (J) Representative traces of mIPSC peaks in control (DMSO) treatment at baseline and following 200 μM TPMPA perfusion. (K) Quantitative analyses of decrease in mIPSC amplitude following TPMPA perfusion (Wilcoxon matched-pairs signed rank test DMSO p = 0.0156, artemether p = 0.0313, artemisinin p = 0.0156, artesunate p = 0.0156. Sample size is equivalent to number of cells recorded from DMSO n = 7, artemether n = 7, artemisinin n = 7, artesunate n = 7). (L) Quantitative analyses of percentage decrease in mIPSC amplitude following TPMPA perfusion (Kruskal-Wallis test, p = 0.3321, Dunn’s multiple comparison test DMSO versus artemether p > 0.9999, DMSO versus artemisinin p > 0.9999, DMSO versus artesunate p = 0.3342. Sample size is equivalent to number of cells recorded from DMSO n = 7, artemether n = 7, artemisinin n = 7, artesunate n = 7). (M) Representative traces of whole-cell voltage-clamp mEPSCs following 1-h control (DMSO) and 50 μM artemisinin treatment. (N and O) (N) Quantitative analyses of mEPSC frequency (Kruskal-Wallis test, p = 0.6979, Dunn’s multiple comparison test DMSO versus artemether p > 0.9999, DMSO versus artemisinin p > 0.9999, DMSO versus artesunate p > 0.9999. Sample size is equivalent to number of cells recorded from DMSO n = 11, artemether n = 11, artemisinin n = 15, artesunate n = 14) and (O) mEPSC amplitude (Kruskal-Wallis test, p = 0.7366, Dunn’s multiple comparison test DMSO versus artemether p > 0.9999, DMSO versus artemisinin p > 0.9999, DMSO versus artesunate p > 0.9999. Sample size is equivalent to number of cells recorded from DMSO n = 11, artemether n = 11, artemisinin n = 15, artesunate n = 14). Graphs are mean ± SEM. Significance reported as *p < 0.05, **p < 0.01, ***p < 0.001, and ****p < 0.0001. NS denotes non-significance.
Figure 5.
Figure 5.. Artemisinin treatment did not alter eIPSC amplitude
(A) Representative traces of whole-cell voltage-clamp eIPSCs following 1-h control (DMSO) and 50 μM artemisinin treatment. (B) Quantitative analyses of eIPSC amplitude (ordinary one-way ANOVA p = 0.6983, Dunnett’s multiple comparisons test DMSO versus artemether p = 0.8745, DMSO versus artemisinin p = 0.5277, DMSO versus artesunate p = 0.9591. Sample size is equivalent to number of cells recorded from DMSO n = 18, artemether n = 13, artemisinin n = 11, artesunate n = 9). (C) Ten stimulations at 10 Hz and 20 Hz were applied to each group with the quantification of paired pulse ratio using the amplitude of the postsynaptic current of the first and second stimulation. (D) 10 Hz (ordinary one-way ANOVA p = 0.7246, Dunnett’s multiple comparisons test DMSO versus artemether p = 0.8258, DMSO versus artemisinin p = 0.8064, DMSO versus artesunate p = 0.6556, DMSO n = 20, artemether n = 12, artemisinin n = 10, artesunate n = 9). (E) 20 Hz (Kruskal-Wallis test, p = 0.7560, Dunn’s multiple comparison test DMSO versus artemether p > 0.9999, DMSO versus artemisinin p > 0.9999, DMSO versus artesunate p = 0.9917. Sample size is equivalent to number of cells recorded from DMSO n = 19, artemether n = 12, artemisinin n = 10, artesunate n = 7). Graphs are mean ± SEM. Significance reported as *p < 0.05, **p < 0.01, ***p < 0.001, and ****p < 0.0001. NS denotes non-significance.
Figure 6.
Figure 6.. Artemisinin treatment augments tonic inhibition
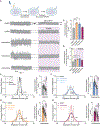
(A) Description of experimental design: 1-h treatment with artemisinins followed by baseline and bicuculline/TPMPA post-perfusion electrophysiology experiments. (B) Representative traces of tonic inhibitory current before and after bicuculine or TPMPA perfusion. Black dotted lines are representative of one standard deviation from the mean at baseline. (C) Tonic inhibitory baseline current was quantified by fitting the distribution of the noise around the mean to a Gaussian curve; a smaller standard deviation translates to a smaller dispersion of noise (ordinary one-way ANOVA p < 0.0001, Dunnett’s multiple comparisons test DMSO versus artemether p < 0.0001, DMSO versus artemisinin p = 0.0003, DMSO versus artesunate p = 0.6731, DMSO n = 14, artemether n = 14, artemisinin n = 14, artesunate n = 14). (D) The standard deviation of tonic inhibitory current following bicuculine or TPMPA perfusion (Kruskal-Wallis test p = 0.0018, Dunn’s multiple comparisons test bicuculline versus artemether p = 0.0076, bicuculline versus artemisinin p = 0.0018; all other comparisons not significant. Sample size is equivalent to number of baseline traces analyzed: bicuculline n = 14, DMSO n = 14, artemether n = 14, artemisinin n = 14, artesunate n = 14). (E) Frequency distribution of tonic current around the mean of each group (paired t test DMSO versus DMSO TPMPA p < 0.0001). (F) Frequency distribution of tonic current around the mean of each group (Wilcoxon test artemisinin versus artemisinin TPMPA p = 0.0001). (G) Frequency distribution of tonic current around the mean of each group (paired t test artemether versus artemether TPMPA p < 0.0001). (H) Frequency distribution of tonic current around the mean of each group (paired t test artesunate versus artesunate TPMPA p < 0.0001). Graphs are mean ± SEM. Significance reported as *p < 0.05, **p < 0.01, ***p < 0.001, and ****p < 0.0001. NS denotes non-significance.
Figure 7.
Figure 7.. Disruption of microtubule polymerization preferentially effected inhibitory miniature events
(A) Following 1-h control (DMSO) and 33 μM (10 mg/1 mL) nocodazole treatment, neurons were co-immunolabeled for gephyrin (postsynaptic marker, pink) and βIII tubulin (neuronal tubulin, green). (B) Quantitative analysis of gephyrin puncta per 10 μm of βIII tubulin (Kruskal-Wallis test p = 0.2535, Dunn’s multiple comparisons test DMSO versus 10 μM p > 0.9999, DMSO versus 20 μM p = 0.4111, DMSO versus 33 μM p = 0.3666. Sample size is equivalent to number of regions imaged: DMSO = 6, 10 μM = 3, 20 μM = 5, 33 μM = 5). (C) Gephyrin puncta size. (D) Quantitative analysis of gephyrin puncta size following 1-h treatment with increasing concentrations of nocodazole. (Kruskal-Wallis test p = 0.0078, Dunn’s multiple comparisons test DMSO versus 10 μM p = 0.1204, DMSO versus 20 μM p = 0.0117, DMSO versus 33 μM p = 0.0874. Sample size is equivalent to number of regions imaged: DMSO = 6, 10 μM = 3, 20 μM = 5, 33 μM = 5). (E) Representative traces of whole-cell voltage-clamp mIPSCs following 1-h control (DMSO) and 33 μM nocodazole treatment. (F and G) (F) Quantitative analysis of mIPSC frequency (Mann-Whitney test DMSO versus nocodazole p = 0.0097. Sample size is equivalent to number of cells recorded from DMSO n = 8, nocodazole n = 11) and (G) mIPSC amplitude (two-tailed unpaired t test DMSO versus nocodazole p = 0.5286. Sample size is equivalent to number of cells recorded from DMSO n = 8, nocodazole n = 11). (H) Cumulative distribution of mIPSC amplitude following nocodazole treatment (Kolmogorov-Smirnov test p = 0.0212. Sample size is equivalent to number of cells recorded from DMSO n = 8, nocodazole n = 11). (I) Analysis of the combined effect of artemisinin and nocodazole treatment on mIPSC frequency (ordinary one-way ANOVA p < 0.0001, Tukey’s multiple comparisons test DMSO versus artemisinin p = 0.0052, DMSO versus nocodazole p = 0.0002, DMSO versus artemisinin + nocodazole p = 0.0006, artemisinin versus nocodazole p = 0.5062, artemisinin versus artemisinin + nocodazole p = 0.7110, nocodazoleversus artemisinin + nocodazole p = 0.9922. Sample size is equivalent to number of cells recorded from DMSO n = 11, artemisinin n = 14, nocodazole n = 11, artemisinin + nocodazole n = 10). (J) Representative traces of eIPSCs following 1-h control (DMSO) and 33 μM nocodazole treatment. (K) Quantitative analysis of eIPSC amplitude (two-tailed unpaired t test DMSO versus nocodazole p = 0.4480. Sample size is equivalent to number of cells recorded from DMSO n = 12, nocodazole n = 10). (L) Ten stimulations at 10 Hz and 20 Hz were applied to each group with the quantification of paired pulse ratio using the amplitude of the postsynaptic current of the first and second stimulation. (M) 10 Hz (two-tailed unpaired t test DMSO versus nocodazole p = 0.7816. Sample size is equivalent to number of cells recorded from DMSO n = 9, nocodazole n = 9). (N) 20 Hz (Mann-Whitney DMSO versus nocodazole p = 0.3401. Sample size is equivalent to number of cells recorded from DMSO n = 9, nocodazole n = 9). (O) Proposed schematic of GABAAR clustering following artemisinin treatment: artemisinin selectively disrupts peripheral GABAAR clusters mediating spontaneous release, increasing their mobility and the number receptors mediating tonic inhibition, while evoked release is unaffected. Graphs are mean ± SEM. Significance reported as *p < 0.05, **p < 0.01, ***p < 0.001, and ****p < 0.0001. NS denotes non-significance.

Similar articles

Cited by

References

    1. Alldred MJ, Mulder-Rosi J, Lingenfelter SE, Chen G, and Lüscher B (2005). Distinct gamma2 subunit domains mediate clustering and synaptic function of postsynaptic GABAA receptors and gephyrin. J. Neurosci 25, 594–603. 10.1523/JNEUR0SCI.4011-04.2005. - DOI - PMC - PubMed
    1. Andreae LC, and Burrone J (2018). The role of spontaneous neurotransmission in synapse and circuit development. J. Neurosci. Res 96, 354–359. 10.1002/jnr.24154. - DOI - PMC - PubMed
    1. Atasoy D, Ertunc M, Moulder KL, Blackwell J, Chung C, Su J, and Kavalali ET (2008). Spontaneous and evoked glutamate release activates two populations of NMDA receptors with limited overlap. J. Neurosci 28, 10151–10166. 10.1523/JNEUROSCI.2432-08.2008. - DOI - PMC - PubMed
    1. Biederer T, Kaeser PS, and Blanpied TA (2017). Transcellular nanoalignment of synaptic function. Neuron 96, 680–696. 10.1016/j.neuron.2017.10.006. - DOI - PMC - PubMed
    1. Brady ML, and Jacob TC (2015). Synaptic localization of α5 GABA (A) receptors via gephyrin interaction regulates dendritic outgrowth and spine maturation. Dev. Neurobiol 75, 1241–1251. 10.1002/dneu.22280. - DOI - PMC - PubMed

Publication types

MeSH terms

LinkOut - more resources