. 2022 Aug 18;82(16):3061-3076.e6.
doi: 10.1016/j.molcel.2022.06.030. Epub 2022 Aug 9.

Lactate is an epigenetic metabolite that drives survival in model systems of glioblastoma

Affiliations

Lactate is an epigenetic metabolite that drives survival in model systems of glioblastoma

Consuelo Torrini et al. Mol Cell. .

Abstract

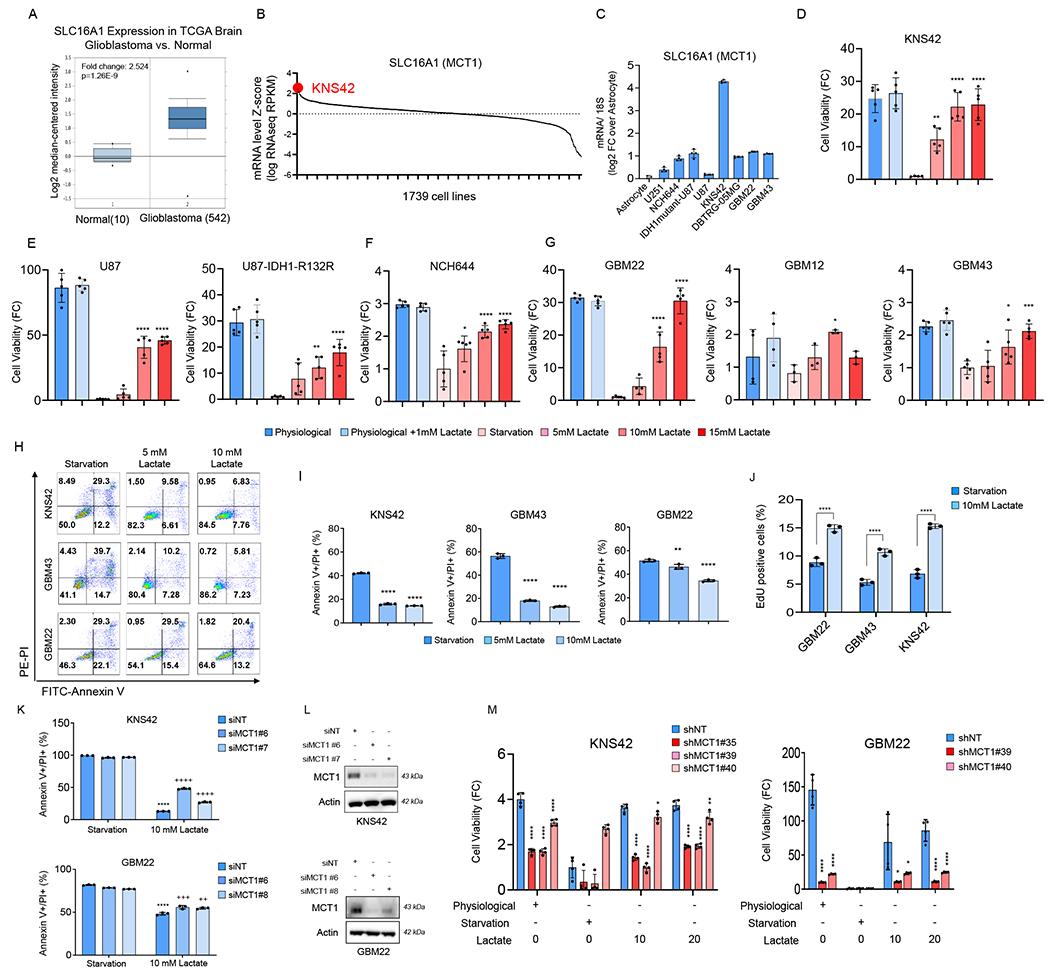
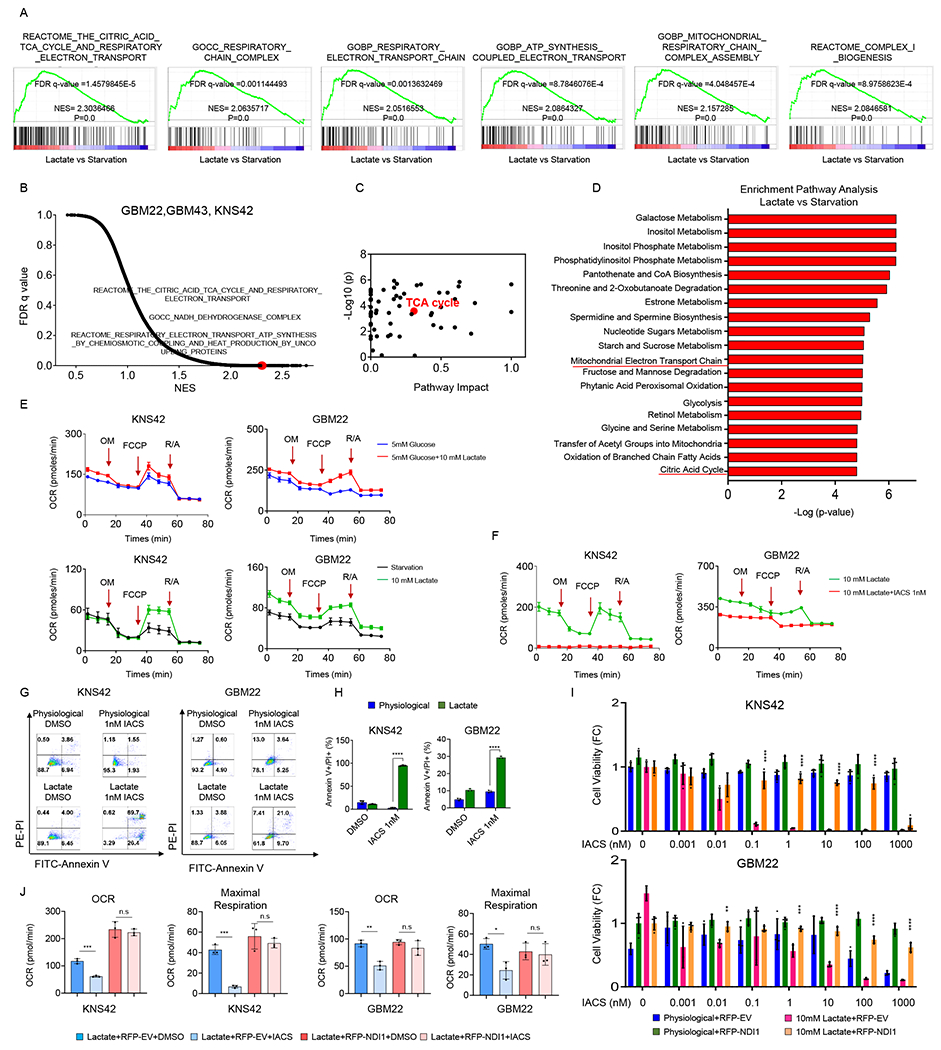
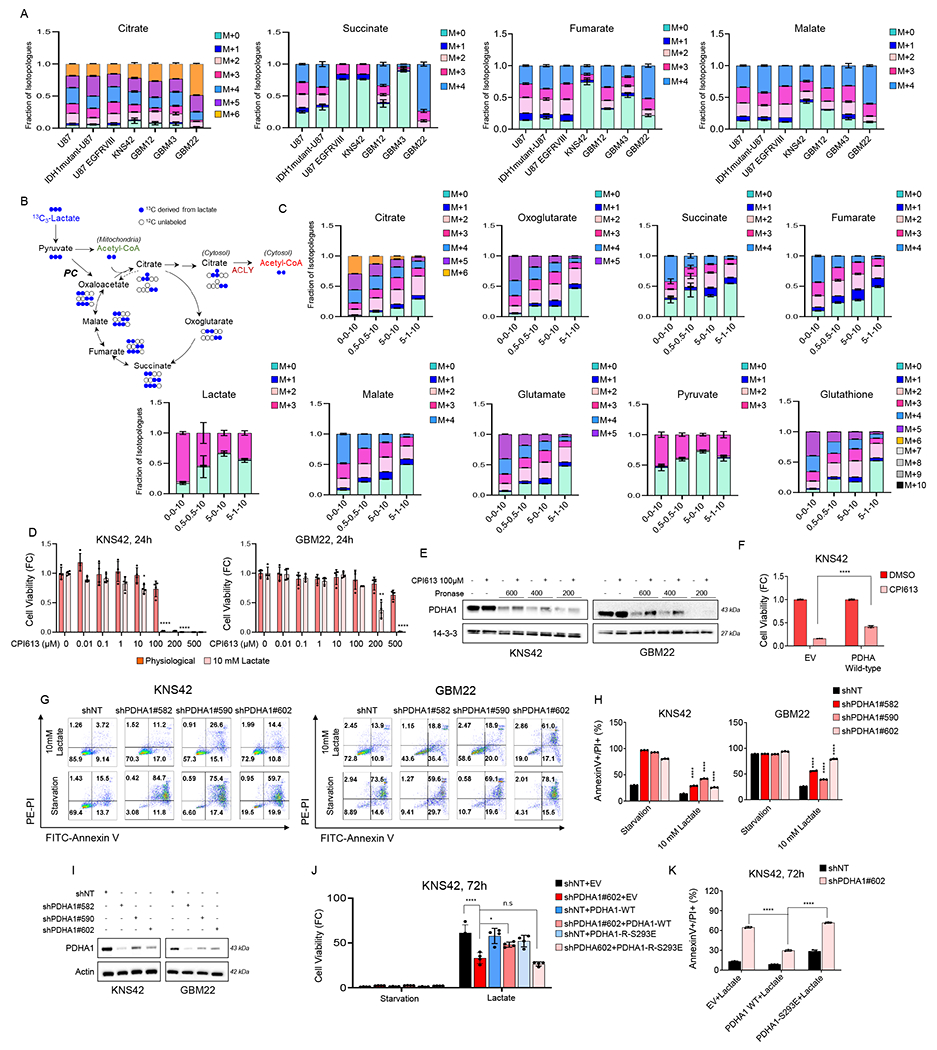
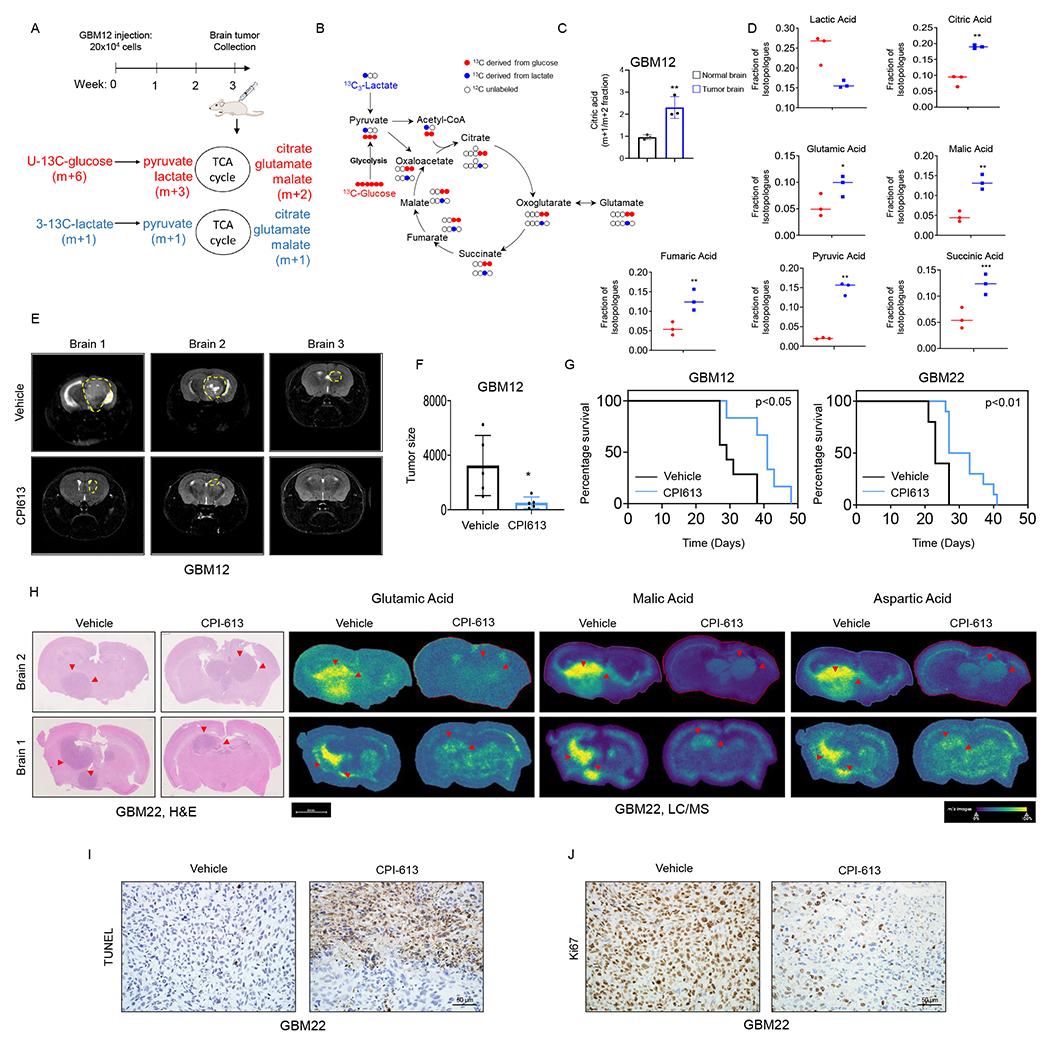
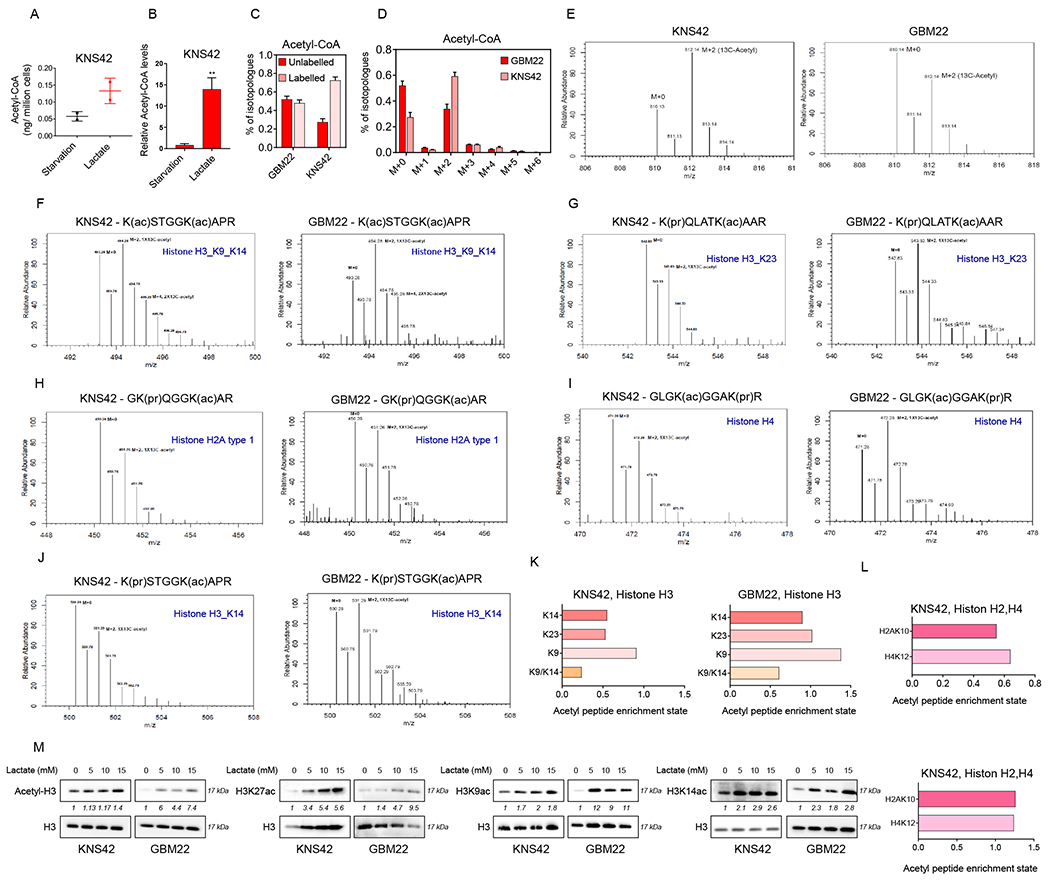
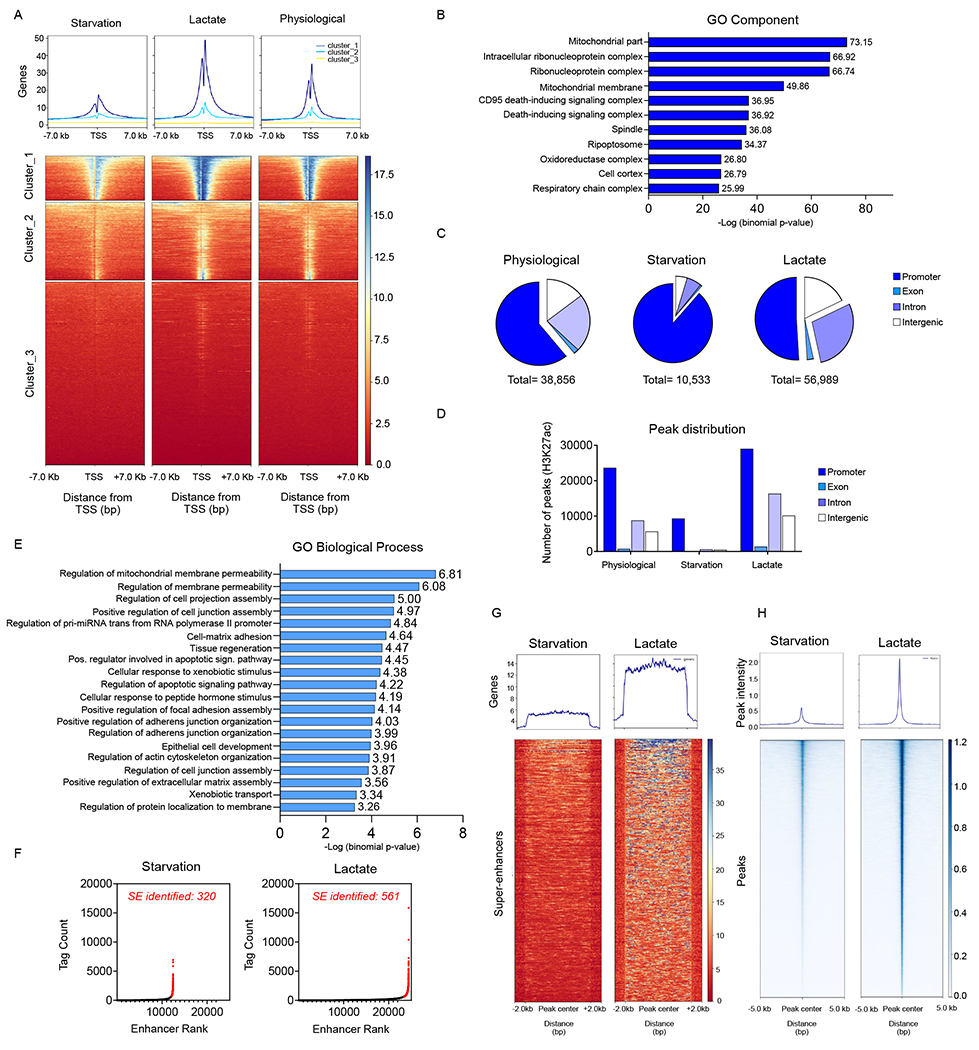
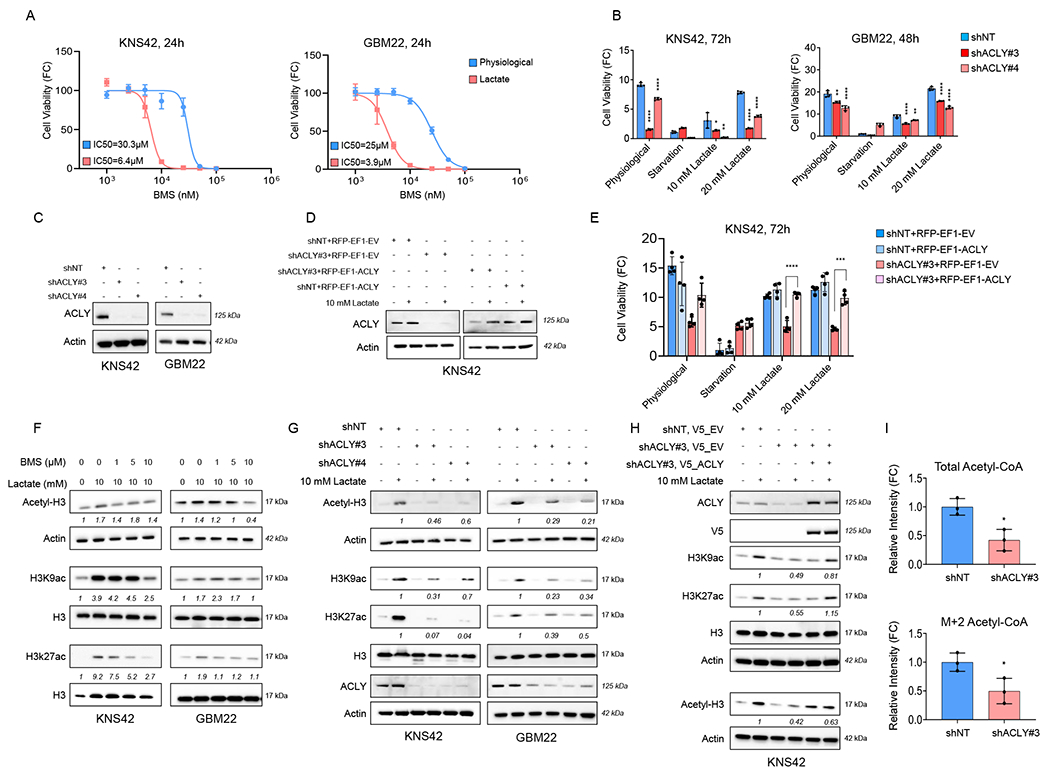
Lactate accumulates to a significant amount in glioblastomas (GBMs), the most common primary malignant brain tumor with an unfavorable prognosis. However, it remains unclear whether lactate is metabolized by GBMs. Here, we demonstrated that lactate rescued patient-derived xenograft (PDX) GBM cells from nutrient-deprivation-mediated cell death. Transcriptome analysis, ATAC-seq, and ChIP-seq showed that lactate entertained a signature of oxidative energy metabolism. LC/MS analysis demonstrated that U-13C-lactate elicited substantial labeling of TCA-cycle metabolites, acetyl-CoA, and histone protein acetyl-residues in GBM cells. Lactate enhanced chromatin accessibility and histone acetylation in a manner dependent on oxidative energy metabolism and the ATP-citrate lyase (ACLY). Utilizing orthotopic PDX models of GBM, a combined tracer experiment unraveled that lactate carbons were substantially labeling the TCA-cycle metabolites. Finally, pharmacological blockage of oxidative energy metabolism extended overall survival in two orthotopic PDX models in mice. These results establish lactate metabolism as a novel druggable pathway for GBM.

Keywords: ATAC-seq; ChIP-seq; glioblastoma; lactate; metabolic flux analysis; tumor metabolism.


Conflict of interest statement

Declaration of interests The authors declare no competing interests.

Figures

Figure 1.
Figure 1.. Lactate facilitates survival of GBM model systems under nutrient deprived conditions in a manner dependent on the MCT1 transporter
(A) Shown is the mRNA levels of SLC16A1 (MCT1) in the TCGA glioblastoma database. Data was extracted from oncomine.org. Middle lines in boxplot: median; box ranges: upper: 75th percentile; lower: 25th percentile; error bars: 10th and 90th percentile. (B) SLC16A1 (MCT1) mRNA expression in the cBioPortal cancer genomics database of 1739 cell lines. KNS42, a pediatric GBM cell line (highlighted in red), is among the top of cell lines with high expression of MCT1 mRNA levels. A complete list of cell lines with the relative SLC16A1 mRNA levels is shown in the Table S1. (C) Real time PCR analysis of SLC16A1 (MCT1) mRNA levels in astrocyte, established glioblastoma, patient-derived xenograft glioblastoma, and stem-like glioblastoma cells (n=4). FC: fold change. 18S is used as a housekeeping gene. (D-G) GBM cells were cultured in different media conditions: physiological media, starvation media, and lactate media for 72h and cell viability analysis was assessed by using CellTiter-Glo (n=5). (H, I) GBM cells were cultured in starvation media, 5 mM lactate media, or 10 mM lactate media for 48h and the cells were stained with annexin V/propidium iodide staining (n=3). The quantification was shown in (I). (J) Shown is the quantification of EdU positive (S-phase) staining in GBM cells cultured in starvation media or 10 mM lactate media for 48h (n=3). (K) KNS42 and GBM22 cells were transfected with non-targeting siNT or MCT1 specific siRNAs, cultured in starvation media or 10 mM lactate media for 48h and the cells were stained with annexin V/propidium iodide staining (n=3). *Statistical analysis was performed between starvation media and lactate media, +statistical analysis was performed between siNT and siMCT1. (L) Western blot of GBM cells that were transfected with non-targeting siNT or MCT1 specific siRNA. (M) KNS42 and GBM22 cells were transduced with non-targeting shNT or MCT1 specific shRNAs, cultured in physiological media, starvation media, or lactate media for 48h and analysis of cell viability was performed (n=4). Statistical significance was assessed by a two-tailed student’s t-test in (J) or ANOVA with Dunnett’s multiple comparison test in (D-G, I, K, M). Data are shown as mean ± SD. *p<0.05, **p<0.01, ***/ ****p<0.001. Media condition: physiological media (5 mM glucose, 1 mM glutamine), starvation media (0.5 mM glucose, 0.5 mM glutamine), 5 mM lactate media (0.5 mM glucose, 0.5 mM glutamine, 5 mM lactate), 10 mM lactate media (0.5 mM glucose, 0.5 mM glutamine, 10 mM lactate), 15 mM lactate media (0.5 mM glucose, 0.5 mM glutamine, 15 mM lactate). See also Figure S1.
Figure 2.
Figure 2.. Lactate mediated rescue of GBM viability is dependent on a functional electron transport chain/oxidative phosphorylation
(A, B) GBM cells were exposed to the starvation media (0.5 mM glucose, 0.5 mM glutamine) or lactate media (0.5 mM glucose, 0.5 mM glutamine, 10 mM lactate) overnight and were subjected to transcriptomic analysis and followed by GSEA. Shown are the enrichment plots of TCA cycle, mitochondrial respiration complex, and electron transport chain. NES: normalized enrichment score. FDR: false discovery rate. (C, D) KNS42 cells were exposed to the starvation media or lactate media overnight. Cells were then harvested and processed for polar metabolite LC/MS analysis. Metabolite set enrichment analysis was performed using MetaboAnalyst. Shown is the pathway impact and the TCA cycle is highlighted in red. (E) KNS42 and GBM22 cells were starved for 30 minutes (0 mM glucose, 0 mM glutamine, 0 mM lactate), exposed to 5mM glucose or 5mM glucose+10 mM lactate, and subjected to extracellular flux analysis on the Seahorse XFp instrument to perform a mitochondrial stress assay. OM; oligomycin. FCCP; Carbonyl cyanide-4 (trifluoromethoxy) phenylhydrazone. R/A; Rotenone and antimycin (n=3). (F) KNS42 and GBM22 cells were starved for 30 minutes, exposed to 10 mM lactate in the presence or absence of 1nM IACS-010759, a clinically validated respiratory complex I inhibitor, and subjected to extracellular flux analysis to perform a mitochondrial stress assay (n=3). (G, H) KNS42 and GBM22 cells were exposed to physiological media (5 mM glucose, 1mM glutamine) or lactate media (0.5 mM glucose, 0.5 mM glutamine, 10 mM lactate), treated with 1nM IACS-010759 for overnight (KNS42)/ 7h (GBM22) and the cells were stained with annexin V/propidium iodide staining (n=3). The quantification was shown in (H). (I) KNS42 and GBM22 cells transduced with empty vector (EV) or a vector containing NDI1 cDNA, exposed to physiological media or lactate media, treated with increasing concentration of IACS-010759 for 24h and cell viability was analyzed (n=4). (J) KNS42 and GBM22 cells transduced with empty vector (EV) or a vector containing NDI1 cDNA, exposed lactate media (0.5 mM glucose, 0.5 mM glutamine, 10 mM lactate), treated with 1nM IACS-010759 for 7h, and subjected to extracellular flux analysis on the Seahorse XFp instrument to perform a mitochondrial stress assay (n=3). Statistical significance was assessed by a two-tailed student’s t-test. Data are shown as mean ± SD. *p<0.05, **p<0.01, ***/ ****p<0.001. n.s: not significant. See also Figure S2, S3 and Table S1.
Figure 3.
Figure 3.. U-13C lactate substantially labels the intermediary metabolism of GBM cultures and PDHA1 is involved in lactate metabolism/survival pathways
(A) Established GBM cells, pediatric GBM cells, and patient-derived GBM cells were incubated in DMEM depleted of phenol red, glucose, and glutamine, supplemented with 1.5% dialyzed FBS in presence or absence of 10 mM U-13C-labelled lactate for 16h and were processed for LC/MS polar metabolite analysis. Shown are fraction of the isotopologues for each metabolite (n = 3). (B) Shown are the 13C-sodium lactate carbons and how they are transferred among molecules of the TCA cycle. Lactate is metabolized to pyruvate (m + 3). Lactate is either oxidized in the TCA cycle, resulting in (m + 2) citric acid. If lactate is used for anaplerosis, citric acid (m + 3) is produced. Lactate carbons also label acetyl-CoA via the ATP-citrate lyase (ACLY) reaction in the cytosol. (C) KNS42 cells were exposed to different media conditions containing U-13C-lactate overnight and were performed LC/S analysis. Media condition: 0-0-10: 0 mM glucose, 0 mM glutamine, 10 mM lactate, 0.5-0.5-10: 0.5 mM glucose, 0.5 mM glutamine, 10 mM lactate, 5-0-10: 5 mM glucose, 0 mM glutamine, 10 mM lactate, 5-1-10: 5 mM glucose, 1 mM glutamine, 10 mM lactate. Shown are fraction of the isotopologues for each metabolite (n=3). (D) KNS42 and GBM22 cells were exposed to physiological media (5 mM glucose, 1 mM glutamine) or lactate media (0.5 mM glucose, 0.5 mM glutamine, 10 mM lactate) and were treated with increasing concentration of CPI613 for 24h and cell viability analysis was performed (n=4). (E) DARTS assay identifies PDHA1 as a CPI-613 binding protein. Standard western blot of GBM cell extracts were used in the presence or absence of Pronase. 14-3-3 is used as a loading control. (F) Stably transduced empty vector (EV) and PDHA wild-type KNS42 cells were exposed to 10 mM lactate and were treated with CPI613 for 24h and the cells were stained with annexin V/propidium iodide staining (n=3). Shown is the quantification of viable cells. FC: fold change. (G, H) Stably transduced non-targeting shRNA or PDHA specific shRNA KNS42 and GBM22 cells were cultured in starvation media or 10 mM lactate media and cells were labeled with Annexin/PI dye and analyzed by flow cytometry. Quantification is shown in (H) (n=3). (I) Standard western blot of KNS42 and GBM22 cells transduced with non-targeting shNT or PDHA1 specific shRNA. (J-K) Stably transduced non-targeting shNT or PDHA1 specific shRNA KNS42 cells were transduced with empty vector (EV), PDHA1-R wild-type (PDHA1 cDNA resistant against PDHA1 shRNA), or PDHA1-R S293E, cultured in starvation media or 10 mM lactate media, and cell viability analysis or Annexin/PI staining were performed (n=3). Statistical significance was assessed by a two-tailed student’s t-test. Data are shown as mean ± SD. *p<0.05, **p<0.01, ****p<0.001. n.s: not significant. See also Figure S4.
Figure 4.
Figure 4.. Lactate predominantly labels the TCA-cycle in orthotopic PDX models in mice and pharmacological targeting of the TCA-cycle extends animal survival
(A) Schematic representation of the intracranial model of glioblastoma. GBM cells were implanted into the right striatum of nude mice for three weeks. An equal amount of both 3-13C-labelled lactate (m+1) and U-13C-labelled glucose (m+6) were injected i.p 30 min prior to brain tumor collection. (B) Shown is the U-13C-glucose carbons (red) and 3-13C-lactate carbons (blue) and how they are transferred among molecules of the TCA cycle. Glucose is metabolized to pyruvic acid labelling three carbons, while lactate is metabolized to pyruvic acid labelling just one carbon. Glucose derived carbons label the TCA cycle metabolites in a (m + 2) pattern, while lactate labelling occurs in (m+1). (C) GBM12 cells were implanted into the right striatum of Nu/Nu mice for three weeks. An equal amount of both 3-13C-labelled lactate (m+1) and U-13C-labelled glucose (m+6) were injected i.p 30 min prior to brain tumor collection for LC/MS analysis. (D) Shown are the levels of TCA cycle-intermediates isotopologue m+1 (derived from lactate, blue dot graph) and TCA cycle-intermediates isotopologue m+2 (derived from glucose, red dot graphs). (E, F) Two groups of mice implanted with GBM12 cells were randomly assigned: vehicle and CPI613 (50mg/kg) treatment was initiated after seven days of the implantation. Mice were treated four times per week by i.p. injection. Shown is the tumor size of representative MRI images using a Bruker BioSpecTM, 9.4 Tesla MR Imager. The quantification is shown in (F) (n=5). (G) GBM cells were implanted into the right striatum of Nu/Nu mice and treated with vehicle or CPI613 (50mg/kg) four times a week to assess tumor growth-related symptoms/survival. (H) Representative hematoxylin and eosin staining and MALDI-TOF imaging of the brain tissues treated with vehicle or CPI613. (I, J) TUNEL and Ki67 staining of the vehicle or CPI613 treated GBM22 tumors treatment in (G). Scale bar: 50μm. Statistical significance was assessed by a two-tailed student’s t-test. Kaplan–Meier curves of animal’s survival are provided and the log-rank test was used to assess statistical significance. Data are shown as mean ± SD. *p<0.05, **p<0.01. See also Figure S5.
Figure 5.
Figure 5.. Lactate labels acetyl-CoA and acetyl-residues of histone proteins in GBM models
(A, B) KNS42 cells were incubated overnight in starvation media (0.5 mM glucose, 0.5 mM glutamine) or lactate media (0.5 mM glucose, 0.5 mM glutamine, 10 mM lactate) and processed for LC/MS analysis to measure the absolute and relative acetyl-CoA levels. (C, D) KNS42 and GBM22 cells were incubated overnight in the presence of 10 mM U-13C-labelled lactate and processed for LC/MS analysis. Shown are labeled and unlabeled fractions of Acetyl-CoA. (E-L) KNS42 and GBM22 cells incubated with 10 mM of U-13C-labelled lactate overnight, the cells were used to extract histones (acidic extraction) to evaluate the incorporation of labeled carbons in histone peptides. Shown are the spectra of different histone peptides and the related acetylation sites which have incorporated the labelled lactate carbons. Shown in (K, L) are the fractions of enriched acetyl-peptides derived from U-13C-lactate carbons for the histone 3 (H3), histone 2A (H2A) and histone 4 (H4) at different lysine. (M) Standard western blot of GBM cells were incubated with different concentration of lactate for 24 h. H3 is used as a loading control. See also Figure S6.
Figure 6.
Figure 6.. Lactate enhances the accessibility of chromatin and regulates the enhancer landscape
(A) KNS42 were exposed to the media conditions as indicated: starvation media (0.5 mM glucose, 0.5 mM glutamine), lactate media (0.5 mM glucose, 0.5 mM glutamine, 10 mM lactate), physiological media (5 mM glucose, 1mM glutamine) overnight and harvested for ChIP with H3K27ac antibody followed by massive parallel DNA-sequencing (ChIP-seq). The CHIP H3K27ac signal enrichments of normalized reads at the transcriptional start sites as well as the metagene plots are shown (presented as clusters with the highest to lowest peak intensities). (B) The gene ontology cluster analysis shows enrichment for mitochondrial related genes (cluster 1 from (A)). (C, D) MACS2 peak calling was performed on the three individual samples in (A), annotated to their localization (promoter, exon, intron or intergenic) and quantified in relative and absolute number. (E-G) Enhancer and super-enhancer analysis was performed in KNS42 exposed to the starvation and lactate media using a modified ROSE algorithm. GO biological process analysis on the super-enhancer regions is shown in (E). The super-enhancers (SE) are highlighted in a hockey-stick plot is shown in (F). A heat map and a metagene plot of the super-enhancer regions are presented in (G). (H) ATAC-seq. analysis was performed to compare chromatin accessibility in KNS42 were exposed to the starvation media and lactate media. Shown are the heatmaps for the peak intensity detected. See also Figure S6.
Figure 7.
Figure 7.. ATP-citrate lyase (ACLY) is a key enzyme in lactate metabolism and facilitates histone acetylation in GBM models
(A) GBM cells were cultured in physiological media (5 mM glucose, 1mM glutamine) and lactate media (0.5 mM glucose, 0.5 mM glutamine, 10 mM lactate) and treated with increasing concentrations of BMS303141 for 24h and cell viability analysis was performed. FC: fold change (n=4). (B) GBM cells were transduced with non-targeting shNT or ACLY specific shRNAs, exposed to different media conditions: physiological, starvation media, and lactate media, and cell viability analysis was performed (n=4). *the statistical analysis was compared between shNT and shACLY. (C) Standard western blot of KNS42 and GBM22 cells transduced with non-targeting shNT or ACLY specific shRNA. Actin is used as a loading control. (D) Standard western blot of stably transduced shNT or shACLY KNS42 cells further infected with empty vector (EV) or ACLY cDNA in the presence or absence of 10 mM lactate. (E) Stably transduced shNT or shACLY (3’UTR) KNS42 cells were transduced with empty vector (EV) or ACLY cDNA, exposed to different media culture: physiological media, starvation media, and lactate media, and cell viability analysis was performed (n=4). (F) Standard western blot of KNS42 and GBM22 cells cultured in the presence or absence of 10 mM lactate media and treated with increasing concentrations of BMS303141 for 24h. (G) Standard western blot of stably transduced shNT or shACLY in KNS42 and GBM22 cells cultured in the presence or absence of 10 mM lactate media. (H) Stably transduced shNT or shACLY (3’UTR) KNS42 cells were transduced with empty vector (EV) or ACLY cDNA, exposed to different media culture: physiological media, starvation media, and lactate media. Thereafter, the cells were collected for standard western blot with indicated antibodies. (I) Stably transduced shNT or shACLY in KNS42 cells were incubated with 10 mM U-13C-labelled lactate overnight and processed for LC/MS analysis (n=3). Statistical significance was assessed by a two-tailed student’s t-test in (E, I) or ANOVA with Dunnett’s multiple comparison test in (B). Data are shown as mean ± SD and ±SEM in (A). *p<0.05, **p<0.01, ***/ ****p<0.001. See also Figure S7.

References

    1. Alistar A, Morris BB, Desnoyer R, Klepin HD, Hosseinzadeh K, Clark C, Cameron A, Leyendecker J, D’Agostino R Jr., Topaloglu U, et al. (2017). Safety and tolerability of the first-in-class agent CPI-613 in combination with modified FOLFIRINOX in patients with metastatic pancreatic cancer: a single-centre, open-label, dose-escalation, phase 1 trial. Lancet Oncol 18, 770–778. 10.1016/S1470-2045(17)30314-5. - DOI - PMC - PubMed
    1. Buenrostro JD, Giresi PG, Zaba LC, Chang HY, and Greenleaf WJ (2013). Transposition of native chromatin for fast and sensitive epigenomic profiling of open chromatin, DNA-binding proteins and nucleosome position. Nat Methods 10, 1213–1218. 10.1038/nmeth.2688. - DOI - PMC - PubMed
    1. Buenrostro JD, Wu B, Chang HY, and Greenleaf WJ (2015). ATAC-seq: A Method for Assaying Chromatin Accessibility Genome-Wide. Curr Protoc Mol Biol 109, 21 29 21–21 29 29. 10.1002/0471142727.mb2129s109. - DOI - PMC - PubMed
    1. Burgess EA, and Sylven B (1962). Glucose, lactate, and lactic dehydrogenase activity in normal interstitial fluid and that of solid mouse tumors. Cancer Res 22, 581–588. - PubMed
    1. Cai Z, Li CF, Han F, Liu C, Zhang A, Hsu CC, Peng D, Zhang X, Jin G, Rezaeian AH, et al. (2020). Phosphorylation of PDHA by AMPK Drives TCA Cycle to Promote Cancer Metastasis. Mol Cell 80, 263–278 e267. 10.1016/j.molcel.2020.09.018. - DOI - PMC - PubMed

Publication types