. 2022 Dec;163(6):1593-1612.
doi: 10.1053/j.gastro.2022.07.076. Epub 2022 Aug 7.

Combined MEK and STAT3 Inhibition Uncovers Stromal Plasticity by Enriching for Cancer-Associated Fibroblasts With Mesenchymal Stem Cell-Like Features to Overcome Immunotherapy Resistance in Pancreatic Cancer

Affiliations

Combined MEK and STAT3 Inhibition Uncovers Stromal Plasticity by Enriching for Cancer-Associated Fibroblasts With Mesenchymal Stem Cell-Like Features to Overcome Immunotherapy Resistance in Pancreatic Cancer

Jashodeep Datta et al. Gastroenterology. 2022 Dec.

Abstract

Background & aims: We have shown that reciprocally activated rat sarcoma (RAS)/mitogen-activated protein kinase/extracellular signal-regulated kinase (MEK) and Janus kinase/signal transducer and activator of transcription 3 (STAT3) pathways mediate therapeutic resistance in pancreatic ductal adenocarcinoma (PDAC), while combined MEK and STAT3 inhibition (MEKi+STAT3i) overcomes such resistance and alters stromal architecture. We now determine whether MEKi+STAT3i reprograms the cancer-associated fibroblast (CAF) and immune microenvironment to overcome resistance to immune checkpoint inhibition in PDAC.

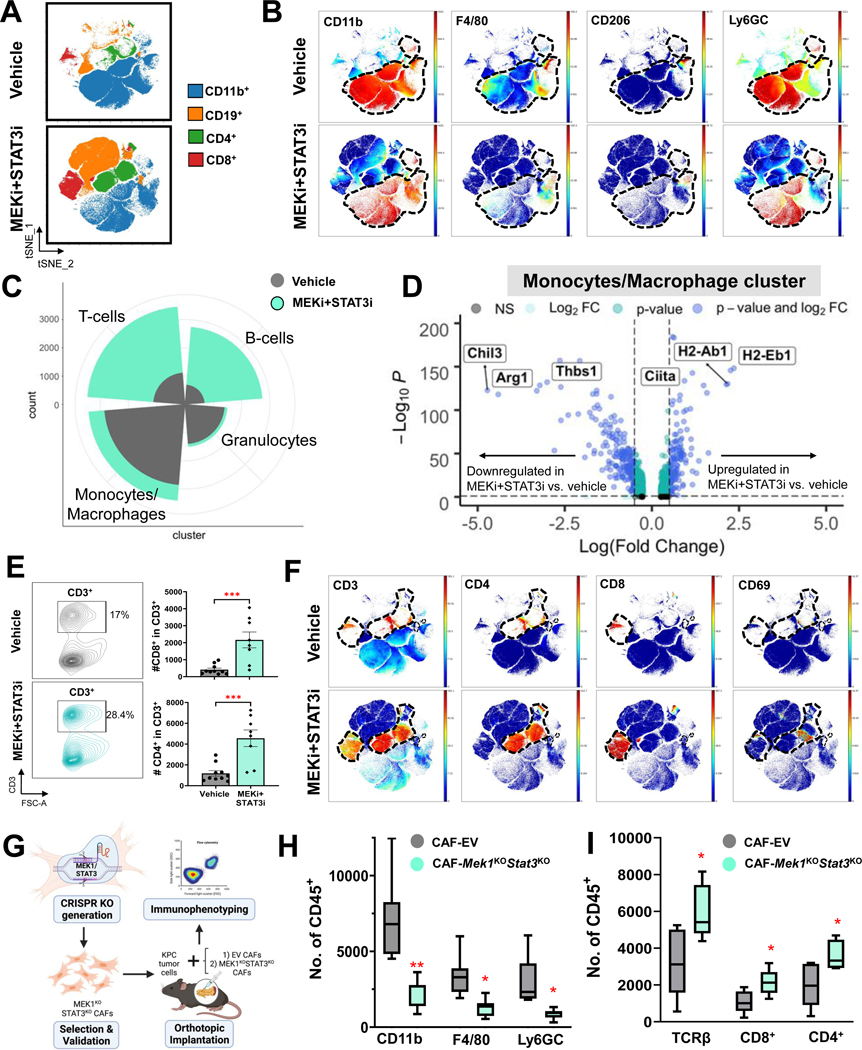
Methods: CAF and immune cell transcriptomes in MEKi (trametinib)+STAT3i (ruxolitinib)-treated vs vehicle-treated Ptf1aCre/+;LSL-KrasG12D/+;Tgfbr2flox/flox (PKT) tumors were examined via single-cell RNA sequencing (scRNAseq). Clustered regularly interspaced short palindromic repeats/clustered regularly interspaced short palindromic repeats associated protein 9 silencing of CAF-restricted Map2k1/Mek1 or Stat3, or both, enabled interrogation of CAF-dependent effects on immunologic remodeling in orthotopic models. Tumor growth, survival, and immune profiling via mass cytometry by time-of-flight were examined in PKT mice treated with vehicle, anti-programmed cell death protein 1 (PD-1) monotherapy, and MEKi+STAT3i combined with anti-PD1.

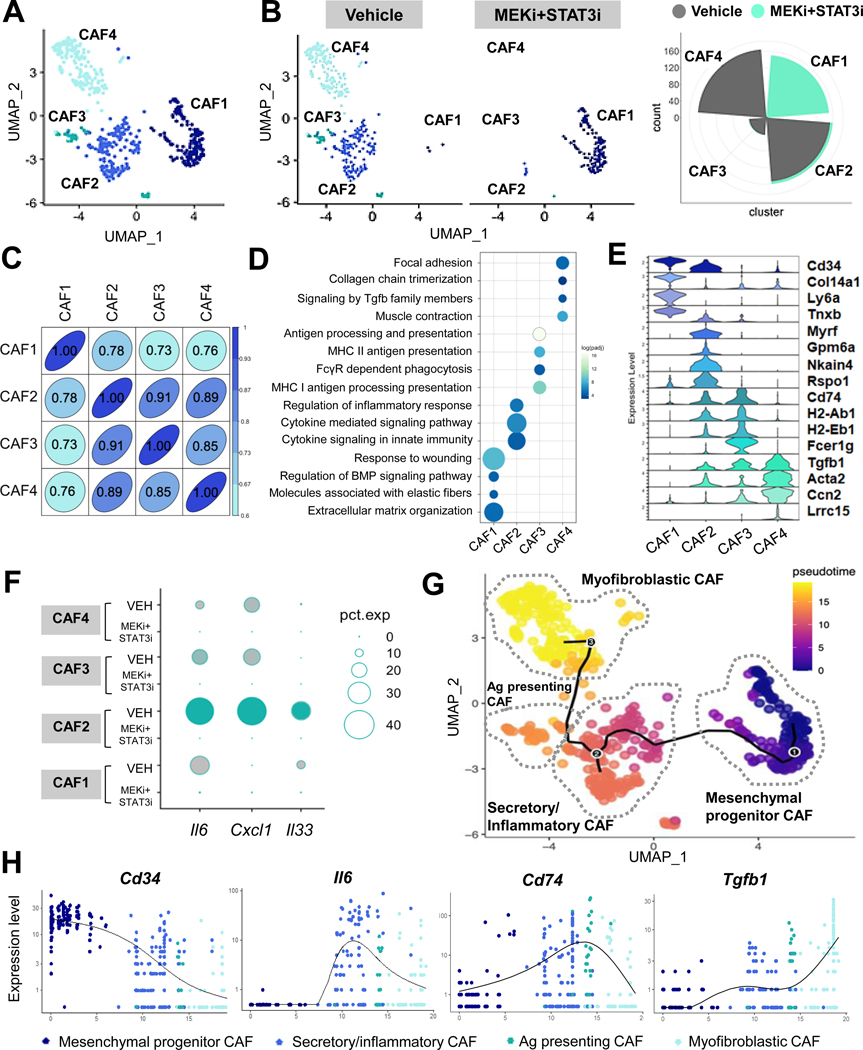
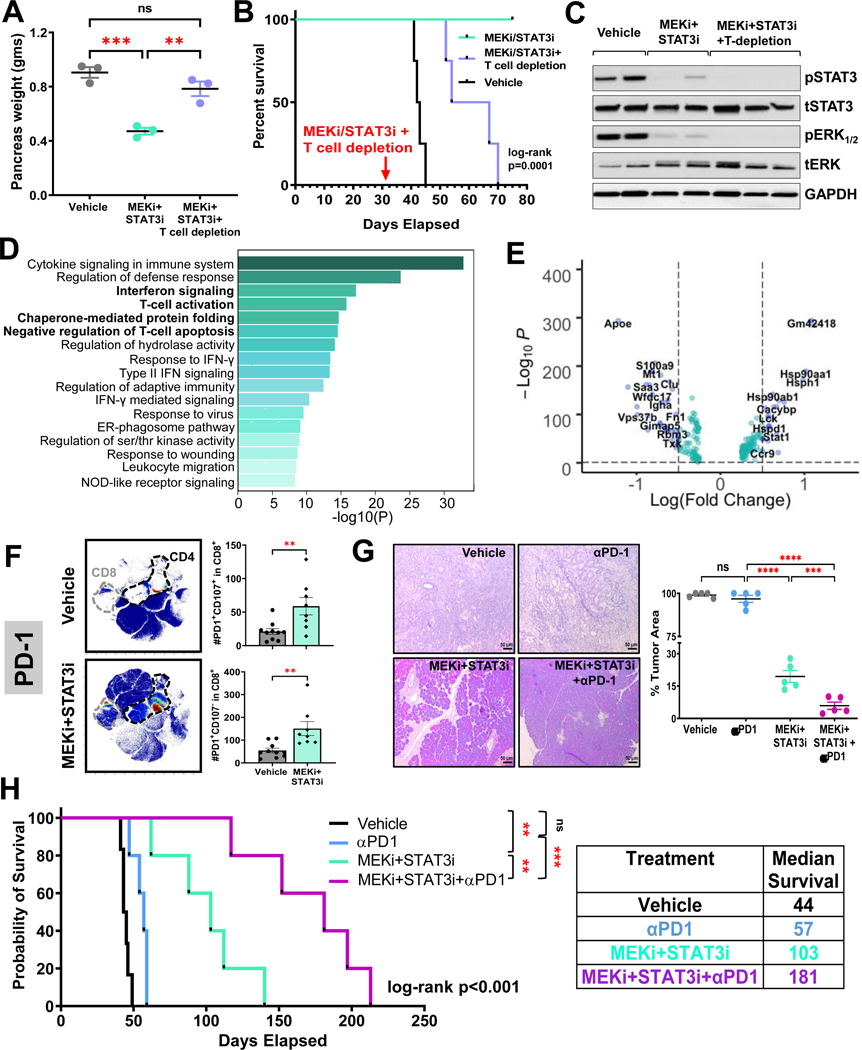
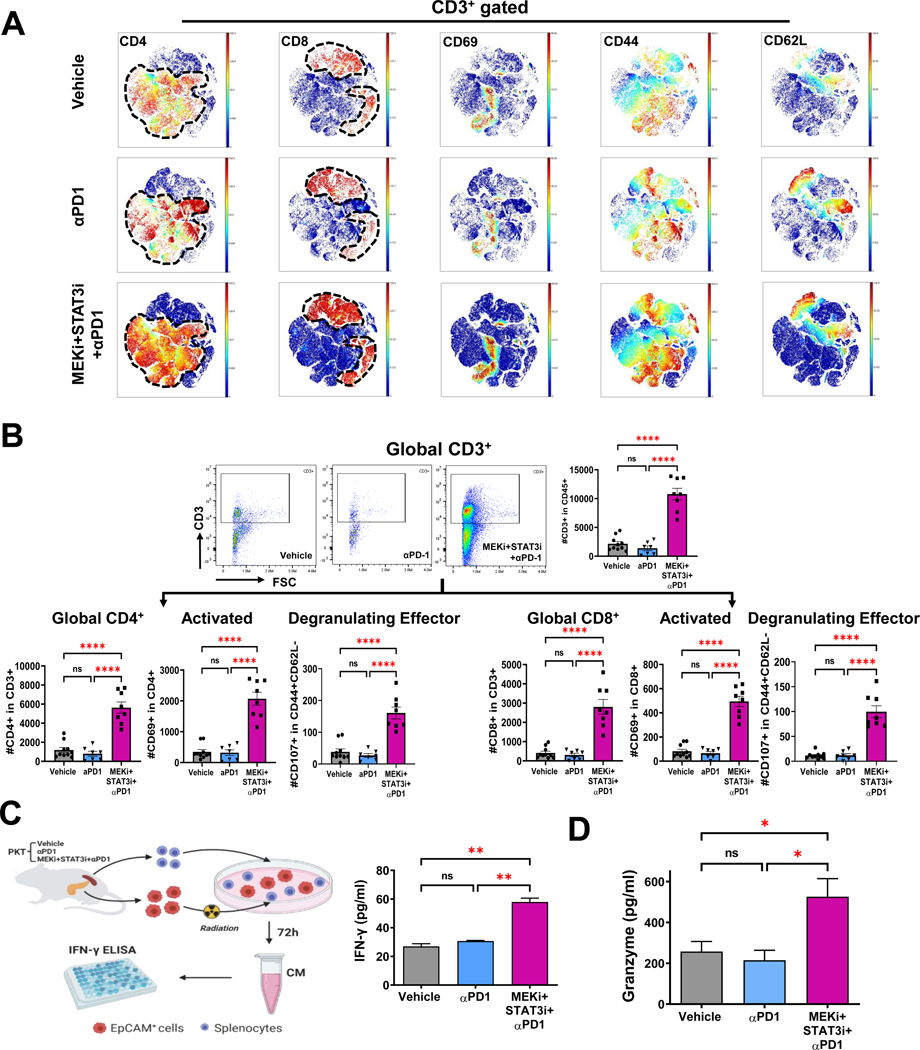
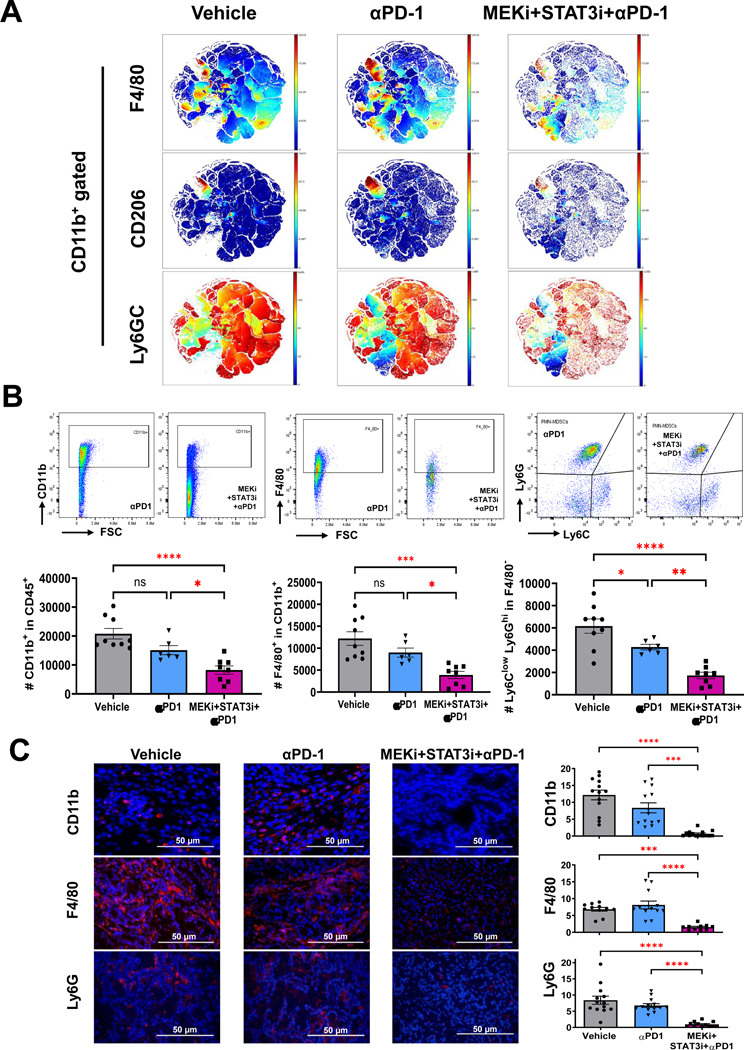
Results: MEKi+STAT3i attenuates Il6/Cxcl1-expressing proinflammatory and Lrrc15-expressing myofibroblastic CAF phenotypes while enriching for Ly6a/Cd34-expressing CAFs exhibiting mesenchymal stem cell-like features via scRNAseq in PKT mice. This CAF plasticity is associated with M2-to-M1 reprogramming of tumor-associated macrophages, and enhanced trafficking of cluster of differentiation 8+ T cells, which exhibit distinct effector transcriptional programs. These MEKi+STAT3i-induced effects appear CAF-dependent, because CAF-restricted Mek1/Stat3 silencing mitigates inflammatory-CAF polarization and myeloid infiltration in vivo. Addition of MEKi+STAT3i to PD-1 blockade not only dramatically improves antitumor responses and survival in PKT mice but also augments recruitment of activated/memory T cells while improving their degranulating and cytotoxic capacity compared with anti-PD-1 monotherapy. Importantly, treatment of a patient who has chemotherapy-refractory metastatic PDAC with MEKi (trametinib), STAT3i (ruxolitinib), and PD-1 inhibitor (nivolumab) yielded clinical benefit.

Conclusions: Combined MEKi+STAT3i mitigates stromal inflammation and enriches for CAF phenotypes with mesenchymal stem cell-like properties to overcome immunotherapy resistance in PDAC.

Keywords: Cancer-Associated Fibroblast; Heterogeneity; Immune Checkpoint Inhibition; Immunotherapy; MEK; Mesenchymal Stem Cell; Pancreatic Ductal Adenocarcinoma; STAT3; Stromal Plasticity.


Conflict of interest statement

Disclosures: The authors declare no potential conflicts of interest.

Figures

Figure 1.
Figure 1.. Combined MEK and STAT3 inhibition remodels stromal fibrosis and attenuates inflammatory fibroblast phenotypes in the TME in a CAF-dependent manner.
(A) Trichrome blue, α-SMA, and Sirius Red staining in tumor sections from PKT mice treated with vehicle or MEKi+STAT3i for 4 weeks; relative areas of positive staining of respective markers from tissue sections in vehicle- and MEKi+STAT3i-treated mice are indicated in adjacent histograms (scale bar=50 μm). Data are shown as mean ± SEM; (B) Concatenated UMAP plot showing annotated clusters from 12,680 single cells undergoing RNA sequencing from vehicle- and MEKi+STAT3i-treated PKT mice (n=3 each); (C) Bubble plot representing pathway enrichment analysis performed on genes differentially downregulated in MEKi-STAT3i treated CAF cluster using fgsea (log fold change (FC)>1). Reactome, KEGG, and GO pathways with p-adjusted value<0.05 are displayed with normalized enrichment score (NES) indicated on x-axis; (D) Volcano plot of select differentially regulated genes related to innate immune response and stromal organization in MEKi+STAT3i-treated vs. vehicle-treated CAF single-cell transcriptomes. Vertical dashed line indicates an adjusted p-value=0.1, horizontal dashed lines indicate an absolute log2FC=0.5. Transcripts achieving non-significance (NS), p-value, log2FC, or p-value and log2FC significance threshold are indicated in adjoining legend; (E) CAF clusters in vehicle and MEKi+STAT3i-treated superimposed UMAP plot (left); violin plots depicting log expression level of Cxcl1 and Il6 genes in CAF single-cell transcriptomes comparing MEKi+STAT3i vs. vehicle-treated CAFs; (F) RT-qPCR analysis from whole tumor-derived RNA in MEKi+STAT3i-treated vs. vehicle-treated primary PKT tumors (n=4 mice/group) depicting relative fold change of Cxcl1, Il6, and Lif gene expression; (G) Venn diagram of differentially expressed genes in bulk RNA sequencing derived from KPC CAF cell lines that underwent CRISPR-Cas9 genetic silencing of either Mek1KO alone, Stat3KO alone or combined Mek1KO/Stat3KO. Numbers in each circle (intersection) represent the unique number of differentially regulated genes in respective comparisons; 1837 genes were differentially expressed in CAF-Mek1KOStat3KO, and were utilized for further analysis; (H) Bubble plot representing pathway enrichment analysis performed on genes differentially downregulated in CAF-Mek1KOStat3KO cells. Reactome, KEGG, and GO pathways with p-adjusted value<0.05 are displayed with normalized enrichment score (NES) indicated on x-axis; (I) Representative contour plots of CD45PDPN+CD31 cells showing MHC-II and Ly6C gates to indicate iCAF (Ly6C+MHC-II), myCAF (Ly6CMHC-II), and apCAF (Ly6C+MHC-II+) populations from experiments in which tumors were isolated from orthotopically injected C57BL/6 mice co-injected with KPC6694c2 tumor cells and either CAF-EV or CAF-Mek1KO/Stat3KO CAF (ratio 1:9 respectively) after 2 weeks (n=7–8 mice/group). Adjacent histogram shows quantification of iCAF:myCAF ratio at endpoint analysis. ns, not significant; *, p<0.05; **, p<0.01; ***, p<0.001.
Figure 2.
Figure 2.. Combined MEK and STAT3 inhibition uncovers stromal plasticity and emergence of a CAF population with mesenchymal progenitor-like properties.
(A) Superimposed UMAP plot highlighting emergent CAF sub-clusters in vehicle- and MEKi+STAT3i treated PKT tumors subjected to single-cell RNA sequencing (scRNAseq); (B) Adjacent UMAP plots and circumplex plots showing absolute cell count of each CAF sub-cluster in vehicle- and MEKi+STAT3i-treated mice, respectively; (C) Pearson correlation analysis of transcriptional divergence between CAF sub-clusters in the combined vehicle- and MEKi+STAT3i CAF Seurat object. 1.00=complete correlation, 0.00=no correlation; (D) Bubble plot of pathway enrichment analysis highlighting the strongly differentially enriched pathways in each CAF cluster using fgsea (log(FC)>1. Reactome, KEGG, and GO pathways with adjusted p-value<0.05 were selected; (E) Stacked violin plots depicting expression level of select genes uniquely expressed in each CAF sub-cluster CAF1–4; (F) Dot plot depicting the expression of iCAF-defining genes Il6, Cxcl1, and Il33 across different CAF sub-subsets comparing vehicle- and MEKi+STAT3i-treated cohorts; (G) Single-cell lineage trajectory analysis performed using Monocle3 pipeline colored by Pseudotime timestamps (adjoining legend) in CAF-only cluster depicting 4 major putative CAF cellular sub-clusters in superimposed UMAP plot. The major trajectory is depicted by the continuous solid starting at (1), and two minor bifurcations indicated by branchpoints (2) and (3). CAF sub-clusters are nominated by gene expression identity and putative pathway enrichment into mesenchymal progenitor (CAF1), secretory/inflammatory (CAF2), antigen-presenting (CAF3), and myofibroblastic (CAF4); (H) Expression of lineage state-defining markers (Cd34, Il6, Cd74, Tgfb1) on Pseudotime scale across the CAF sub-clusters.
Figure 3.
Figure 3.. Combined MEK and STAT3 inhibition reprograms the immunosuppressive myeloid microenvironment and facilitates intratumoral T-cell trafficking in part via a CAF-dependent manner.
(A) Mass cytometry time-of-flight (CyTOF) FlowSOM plots depicting changes in total myeloid (CD11b+), T-cell (CD4+ and CD8+) and B-cell (CD19+) populations in PKT mice treated with vehicle or MEKi+STAT3i (n=7–8 mice/arm); (B) Representative viSNE plots demonstrating changes in CD11b+ myeloid sub-populations F4/80+ macrophages, CD206+ M2-like macrophages, and Ly6GC myeloid-derived suppressor cells between vehicle- and MEKi+STAT3i-treated PKT mice as analyzed by CyTOF. Parent CD11b+ cell populations are denoted by dashed line; (C) Circumplex plot from single-cell RNA sequencing (scRNAseq) analysis in PKT mice treated with either vehicle (grey) or MEKi+STAT3i (green) showing relative abundance of T-cell, B-cell, granulocytes, and monocyte/macrophage immune cell clusters between treatment groups; (D) Volcano plot of transcripts associated with monocyte/macrophage polarization toward M1 (Ciita, H2-Ab1, H2-Eb1) or M2 (Chil3, Arg1, Thbs1) skewness that are significantly overexpressed (right) or underexpressed (left) in MEKi+STAT3i-treated vs. vehicle-treated scRNAseq monocyte/macrophage transcriptomes. FDR-corrected P-value and log2(fold change) thresholds were established at ≤0.05 and ≥0.5, respectively; (E) Flow cytometric analysis comparing global CD3+ T-cell populations, shown in representative contour plots (left), as well as CD4+ and CD8+ T-cell subsets, shown in histograms (right), between vehicle and MEKi+STAT3i-treated PKT mice (n=8–10 mice/arm); (F) Representative viSNE plots demonstrating changes in CD3+, CD4+, CD8+, and CD69+ T-cell populations between vehicle- and MEKi+STAT3i-treated PKT mice as analyzed by CyTOF. Parent CD3+, CD4+, or CD8+ T-cell populations are denoted by dashed line, where applicable; (G) Schematic showing generation of CRISPR/Cas9 genetic silencing of Mek1 and Stat3 in KPC cancer-associated fibroblasts, and orthotopic injection of KPC tumor cells with either empty vector (EV) CAFs or Mek1KOStat3KO CAFs in syngeneic C57B/l6 mice, followed by immunophenotyping of established tumors by flow cytometry. Histograms showing total numbers of (H) CD11b+, F4/80+, and Ly6GC+ myeloid cells, and (I) TCR-β, CD8+, and CD4+ T-cells in CAF-EV vs. CAF-Mek1KOStat3KO tumors (n=7–8 mice/group). Data are shown as mean ± SEM. ns, not significant; *, p<0.05; **, p<0.01; ***, p<0.001.
Figure 4.
Figure 4.. Combined MEK and STAT3 controls PDAC growth in a T-cell dependent manner and overcomes immunotherapy resistance in vivo.
PKT mice were treated with vehicle, MEKi+STAT3i, or MEKi+STAT3i following T-cell depletion with anti-CD4 and anti-CD8 antibodies (scheme in Fig. S8). Differences in (A) pancreas weight at sacrifice and (B) overall survival were compared among treatment arms. (C) Representative western blot demonstrating target inhibition of pERK1/2 and pSTAT3 in mice treated with MEKi+STAT3i ± T-cell depletion; (D) Metascape pathway enrichment analysis depicting top 17 signaling pathways from MSigDB compendium differentially upregulated in MEKi+STAT3i-treated compared with vehicle-treated T-cell single-cell transcriptomes from scRNAseq analysis in PKT tumors. Bolded pathways highlight those related to interferon signaling, T-cell activation, chaperone-mediated protein folding, and negative regulation of T-cell apoptosis; (E) Volcano plot of transcripts associated with aforementioned pathways that are significantly overexpressed (right) or underexpressed (left) in MEKi+STAT3i-treated vs. vehicle-treated single cell T-cell transcriptomes. FDR-corrected P-value and log2(fold change) thresholds were established at ≤0.05 and ≥0.5, respectively; (F) Mass cytometry time-of-flight (CyTOF) analysis of PKT mice treated with vehicle or MEKi+STAT3i showing an increase in PD-1+ tumor-infiltrating CD8+ T-cells, as visualized by representative viSNE plots (F, left). Flow cytometric analysis showing increase in degranulating CD8+PD-1+CD107a+ T-cells and non-degranulating CD8+PD-1+CD107a T-cells in MEKi+STAT3i treated vs. vehicle-treated mice (n=8–10 mice/arm) (F, right); (G) Representative images from H&E sections from PKT mice treated with vehicle, αPD-1, MEKi+STAT3i, or MEKi+STAT3i plus αPD-1 for 4 weeks (G, left). Percent tumor area (G, right) at endpoint sacrifice were compared between treatment arms (n=5 mice/arm); (H) Kaplan-Meier survival plot depicting overall survival in PKT mice treated with vehicle, αPD-1, MEKi+STAT3i, or MEKi+STAT3i plus αPD-1 beginning at 4–4.5 weeks of age. Log-rank survival comparisons between individual treatment groups and overall cohort, as well as adjoining table with median survival times, are provided. Where applicable, data are shown as mean ± SEM. ns, not significant; *, p<0.05; **, p<0.01; ***, p<0.001.
Figure 5.
Figure 5.. Addition of MEKi+STAT3i to PD-1 blockade augments recruitment, activation, and functional cytotoxicity of tumor-infiltrating T-cells.
(A) viSNE plots demonstrating levels of tumor-infiltrating CD3+ cell subsets (CD4+, CD8+, CD69+, CD44+, and CD62L+) in vehicle, αPD-1, and combined MEKi+STAT3i/αPD-1 treated PKT mice as analyzed by CyTOF (n=7–8 mice/arm); (B) Analysis by flow cytometry showing changes in total CD3+, CD4+, and CD8+ tumor-infiltrating T-cells as well as levels of activated CD69+ and degranulating effector (CD4+CD62CD107+) CD4+/CD8+ T-cells in PKT mice treated with vehicle, αPD-1, or MEKi+STAT3i/αPD-1 (n=8–10 mice/arm); (C) Schematic depicting ex vivo tumor cell:splenocyte co-culture experiment. Splenocytes were isolated from PKT mice following treatment with vehicle, αPD-1, and MEKi+STAT3i/αPD-1 and co-cultured with irradiated PKT tumor cells for 72 hours. IFN-γ release was determined by ELISA (right). (D) ELISA demonstrating granzyme B levels in total tumor lysate in vehicle, αPD1, and MEKi+STAT3i/αPD-1 treatment arms (n=3 mice/arm). Data are shown as mean±SEM. Scale bar = 50 μm. ns, not significant; *, p<0.05; **, p<0.01; ***, p<0.001; ****, p<0.0001.
Figure 6:
Figure 6:. Differential effects on innate immune remodeling are driven by MEKi/STAT3i with minimal contribution from anti-PD-1 monotherapy in PKT mice.
(A) viSNE plots depicting mass cytometry time-of-flight (CyTOF) analysis of CD11b+ myeloid cell subsets (F4/80+, CD206+, and Ly6G+C+) in PKT mice treated with vehicle, αPD-1, and MEKi+STAT3i plus αPD-1 for 4 weeks (n=7–8 mice/arm); (B) Levels of total myeloid (CD11b+), macrophage (CD11b+F4/80+), and PMN-MDSCs (Ly6G+Ly6CloF4/80) cells were determined by flow cytometry in PKT tumors treated with vehicle, αPD1, and MEKi+STAT3i+αPD1 (n=7–8 mice/arm); (C) Immunofluorescent staining and quantification of CD11b+, F4/80+, and Ly6G+ levels in PKT mice among indicated treatment arms vehicle, αPD-1, and MEKi+STAT3i plus αPD-1 (n=3–4 mice/arm). Data are shown as mean ± SEM. Scale bar = 50 μm. ns, not significant; *, p<0.05; **, p<0.01; ***, p<0.001; ****, p<0.0001.
Figure 7:
Figure 7:. Combination MEK, STAT3, and PD-1 inhibition demonstrates efficacy in a metastatic PDAC patient with chemotherapy-refractory disease, laying groundwork for clinical trial.
(A) Treatment timeline for patient with chemotherapy refractory PDAC prior to initiation of Trametinib, Ruxolitinib, and Nivolumab treatment. Pre-treatment (B) and post-treatment (C) PET/CT scan showing a significant reduction in size and FDG avidity of both locally recurrent tumor in pancreatic bed (white arrows) and in a segment VII liver metastasis (yellow arrows) on PET/CT imaging following 3 months of treatment with Trametinib, Ruxolitinib, and Nivolumab; (D) Design of Phase 1 clinical trial investigating Trametinib (MEKi), Ruxolitinib (STAT3i), and Retifanlimab (αPD-1) in advanced/metastatic pancreatic cancer patients. Proposed treatment schedules, as well as scheme for biopsies/blood collection for correlative endpoints, are shown.

Similar articles

Cited by

References

    1. Collins MA, Bednar F, Zhang Y, et al. Oncogenic Kras is required for both the initiation and maintenance of pancreatic cancer in mice. J Clin Invest 2012;122:639–53. - PMC - PubMed
    1. Kerr EM, Gaude E, Turrell FK, et al. Mutant Kras copy number defines metabolic reprogramming and therapeutic susceptibilities. Nature 2016;531:110–3. - PMC - PubMed
    1. Beatty GL, Eghbali S, Kim R. Deploying Immunotherapy in Pancreatic Cancer: Defining Mechanisms of Response and Resistance. Am Soc Clin Oncol Educ Book 2017;37:267–278. - PubMed
    1. O’Reilly EM, Oh DY, Dhani N, et al. Durvalumab With or Without Tremelimumab for Patients With Metastatic Pancreatic Ductal Adenocarcinoma: A Phase 2 Randomized Clinical Trial. JAMA Oncol 2019. - PMC - PubMed
    1. Marabelle A, Le DT, Ascierto PA, et al. Efficacy of Pembrolizumab in Patients With Noncolorectal High Microsatellite Instability/Mismatch Repair-Deficient Cancer: Results From the Phase II KEYNOTE-158 Study. J Clin Oncol 2020;38:1–10. - PMC - PubMed

Publication types

MeSH terms