

Hospital Price Transparency in the United States: An Examination of Chargemaster, Cash, and Negotiated, Price Variation for 14 Common Procedures
- PMID: 35948351
- PMCID: PMC9464687
- DOI: 10.1097/MLR.0000000000001761
Hospital Price Transparency in the United States: An Examination of Chargemaster, Cash, and Negotiated, Price Variation for 14 Common Procedures
Abstract
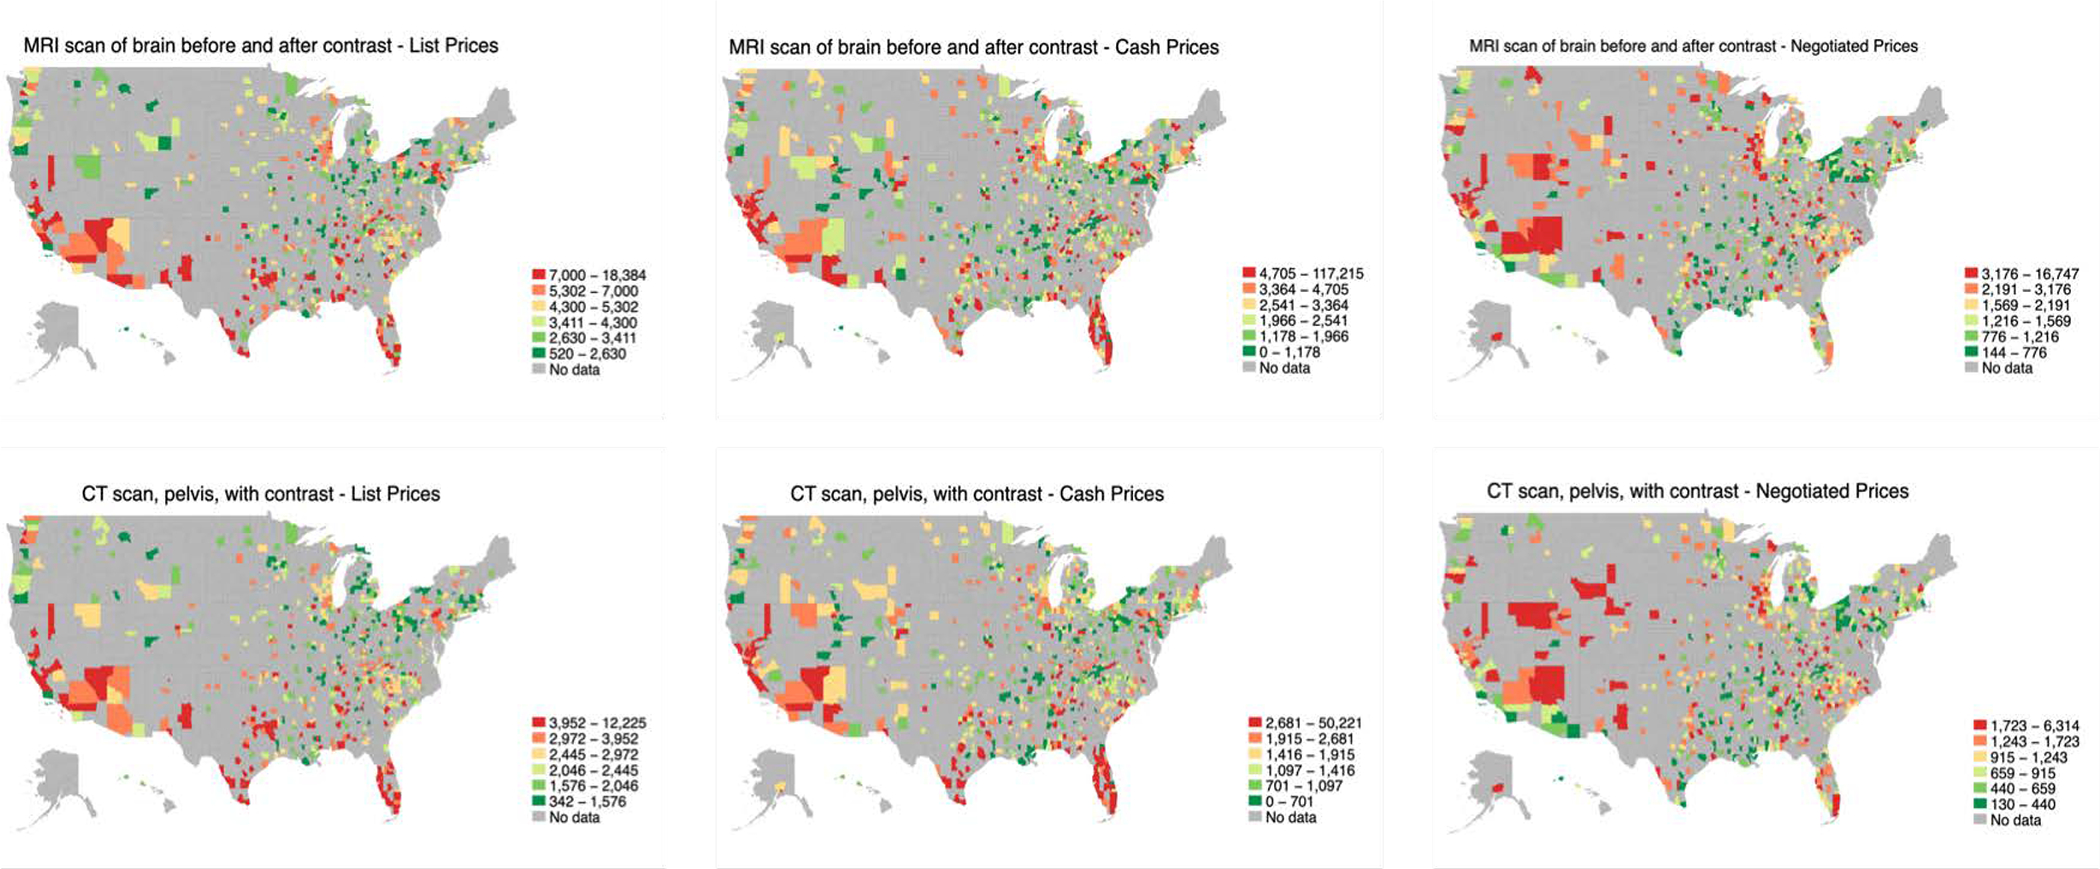
Background: Effective January 1, 2021, US hospitals were required to upload information on their chargemaster prices (database of list prices), discounted cash prices (commonly charged to self-pay patients), and payer-specific negotiated prices.
Objective: Examine how prices vary and are associated with hospital characteristics, market competition, and hospital quality.
Design setting and participants: This observational study used data on 14 common medical services across 1599 hospitals in 2021. Descriptive and regression analyses were used to study price variation. Analyses adjust for hospital characteristics, market competition and state fixed effects.
Results: Ninetieth -to-10th-percentile price markups factors (ratios) range between 3.2 and 11.5 for chargemaster; 6.1 and 19.7 for cash; and 6.6 and 30.0 for negotiated prices. Adjusted regression results indicate that hospitals' cash prices are on average 60% ( P <0.01) higher, and list prices are on average 164% ( P <0.01) higher, than negotiated prices. Systematic pricing differences across hospitals were noted, with urban hospitals having 14% ( P <0.01) lower prices than rural hospitals, teaching hospitals having 3% ( P <0.01) higher prices than nonteaching hospitals, and nonprofit hospitals pricing 9% ( P <0.01), and for-profit hospitals 39% ( P <0.01), higher than government owned hospitals. In addition, hospitals that contract with more insurance plans have higher prices, hospitals in more competitive markets have lower prices, and higher quality hospitals have on average 5% ( P <0.01) lower prices than lower quality hospitals.
Conclusions: Prices all vary considerably across US hospitals. High quality hospitals are associated with lower pricing across all three sets of prices examined. Hospital price transparency may help consumers better identify hospitals that provide both high quality, and low cost, care.
Copyright © 2022 Wolters Kluwer Health, Inc. All rights reserved.
Conflict of interest statement
The authors declare no conflict of interests.
Figures
References
-
- U.S. Department of Health and Human Services. CMS Final Rule [Internet]. Available from: https://www.federalregister.gov/documents/2019/11/27/2019-24931/medicare...
-
- U.S. Department of Health and Human Services. Public Health Service Act [Internet]. 2019;Available from: https://www.hhs.gov/sites/default/files/i-amendments.pdf
-
- Anderson GF. From “soak the rich” to “soak the poor”: Recent trends in hospital pricing. Health Affairs 2007;26(3):780–9. - PubMed
-
- Bai G, Anderson GF. US hospitals are still using chargemaster markups to maximize revenues. Health Affairs 2016;35(9):1658–64. - PubMed
-
- Bai G, Anderson GF. Extreme markup: The fifty US hospitals with the highest charge-to-cost ratios. Health Affairs 2015;34(6):922–8. - PubMed
Publication types
MeSH terms
Grants and funding
LinkOut - more resources
Full Text Sources
Medical
