. 2022 Sep 27;32(9):1627-1641.
doi: 10.1101/gr.276665.122.

Single-cell multi-omics of human preimplantation embryos shows susceptibility to glucocorticoids

Affiliations

Single-cell multi-omics of human preimplantation embryos shows susceptibility to glucocorticoids

Cheng Zhao et al. Genome Res. .

Abstract

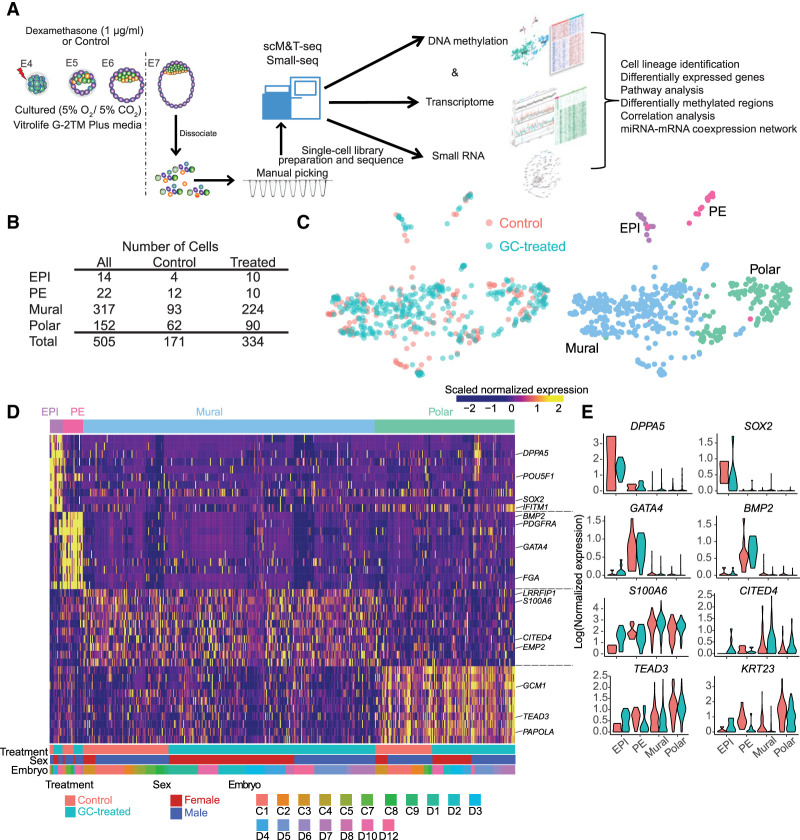
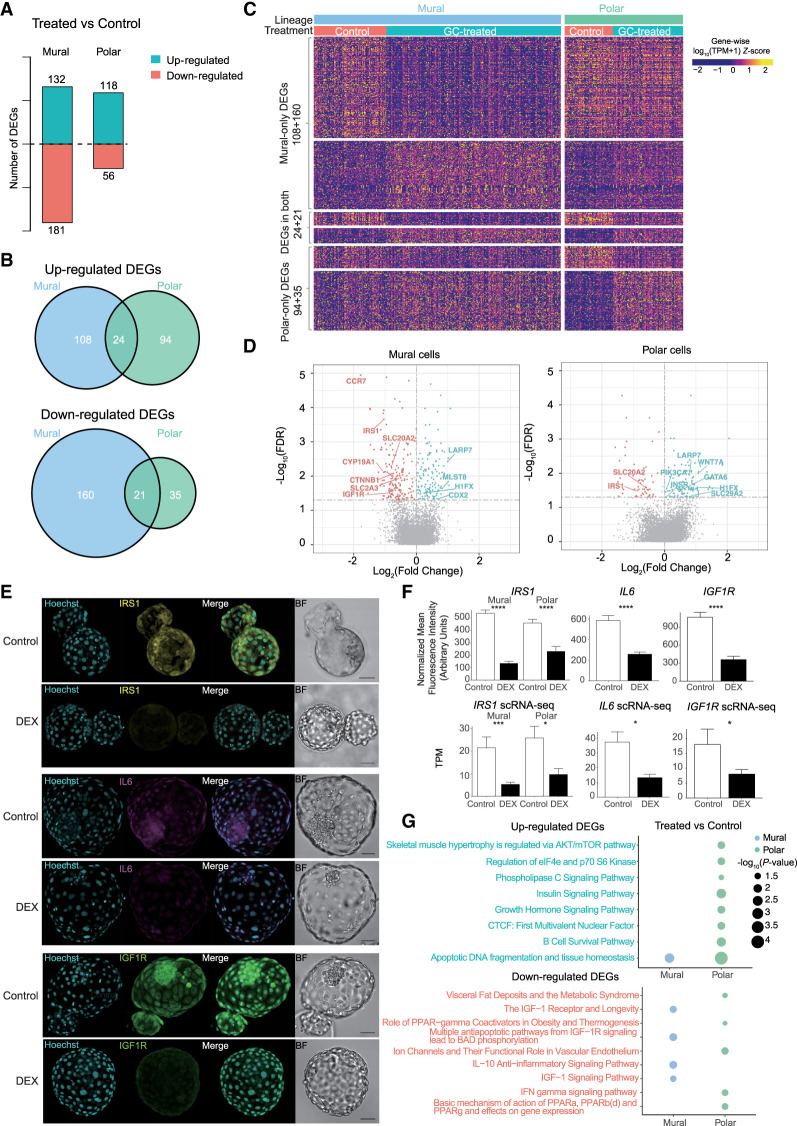
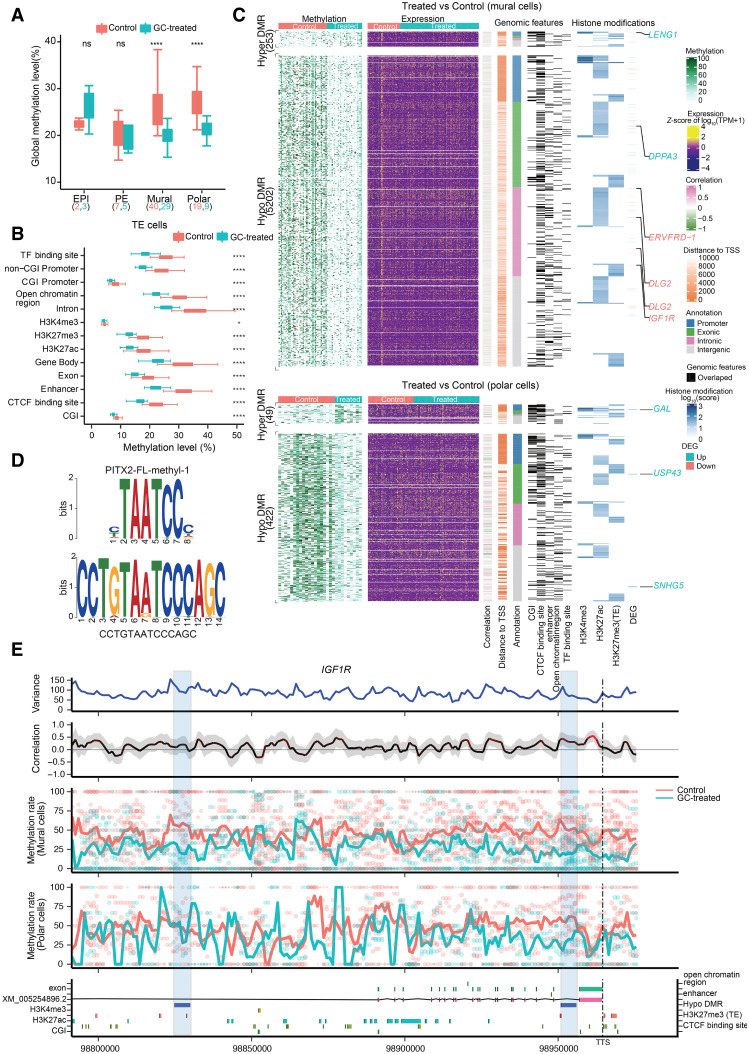
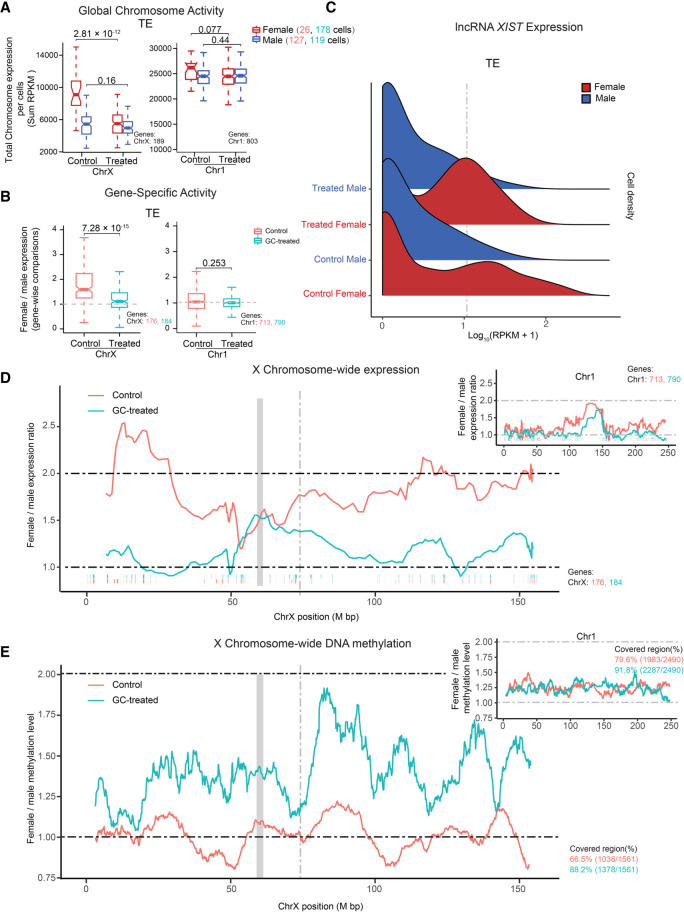
The preconceptual, intrauterine, and early life environments can have a profound and long-lasting impact on the developmental trajectories and health outcomes of the offspring. Given the relatively low success rates of assisted reproductive technologies (ART; ∼25%), additives and adjuvants, such as glucocorticoids, are used to improve the success rate. Considering the dynamic developmental events that occur during this window, these exposures may alter blastocyst formation at a molecular level, and as such, affect not only the viability of the embryo and the ability of the blastocyst to implant, but also the developmental trajectory of the first three cell lineages, ultimately influencing the physiology of the embryo. In this study, we present a comprehensive single-cell transcriptome, methylome, and small RNA atlas in the day 7 human embryo. We show that, despite no change in morphology and developmental features, preimplantation glucocorticoid exposure reprograms the molecular profile of the trophectoderm (TE) lineage, and these changes are associated with an altered metabolic and inflammatory response. Our data also suggest that glucocorticoids can precociously mature the TE sublineages, supported by the presence of extravillous trophoblast markers in the polar sublineage and presence of X Chromosome dosage compensation. Further, we have elucidated that epigenetic regulation-DNA methylation and microRNAs (miRNAs)-likely underlies the transcriptional changes observed. This study suggests that exposures to exogenous compounds during preimplantation may unintentionally reprogram the human embryo, possibly leading to suboptimal development and longer-term health outcomes.


Figures

Figure 1.
Figure 1.
Single-cell analysis reveals cell lineages in control and glucocorticoid-exposed embryos. (A) Process flow diagram of single-cell sequencing data analysis on preimplantation embryos. Single cells were collected from in vitro cultured embryos on E7 (glucocorticoid-treated and control). Libraries were generated using scM&T-seq for the simultaneous measure of transcriptome and methylation and using Small-seq to measure small RNA biotypes. (B) The number of cells retained after quality control for scRNA-seq data. (C) UMAP showing individual cells from all control and glucocorticoid-exposed embryos. Cells are colored by lineages (left) and treatments (right), respectively. (D) Heatmap depicting the expression pattern of the top 10 marker genes (ranked by the “power” values from “roc” test) for each lineage. Names of the known marker genes are listed on the right side. Each row represents individual marker genes; the column represents each cell. The lineage, embryo treatment, embryo sex, and embryo identity are indicated by upper and lower panel annotation, respectively. Color in the heatmap is for the scaled expression data. (E) Violin plots show the expression level distributions of selected marker genes with colors indicating treatment. Lineage marker genes for each cell type are listed in Supplemental Table S2.
Figure 2.
Figure 2.
Glucocorticoid exposure induces cell type–specific responses. (A) The number of DEGs between control and glucocorticoid-treated embryos in mural and polar cells. The numbers above and below the x-axis represent the number of up-regulated and down-regulated DEGs in glucocorticoid-exposed embryos, respectively. (B) Venn diagrams of overlapping DEGs identified in mural cells and polar cells. (C) Heatmap showing the DEG expression level for the same groups as in the Venn diagrams in B. Color in the heatmap denotes the z-score of log-transformed TPM normalized expression values. (D) Volcano plot showing the expression fold change and the adjusted P-value (FDR) of treatment-related DEGs in mural and polar cells. The blue dots represent the up-regulated DEGs, and pink dots represent the down-regulated DEGs with glucocorticoid exposure. All significant DEGs associated with glucocorticoid exposure are found in Supplemental Table S3. (E) Validation-selected DEGs in the human embryo. Z-projection of immunofluorescence staining in E7 human embryos for IRS1, IL6, and IGF1R from control and DEX treatment (N = 5–7 embryos/treatment group). (BF) Bright field. Scale bars for all images are set at 50 µm. (F) Quantification of normalized mean fluorescence intensity and TPM values obtained from scRNA-seq. Significance: (****) P < 0.0001 using Student's t-test; (***) FDR < 0.001 and (*) FDR < 0.05 using “MAST” test for immunofluorescence and scRNA-seq, respectively. (G) Pathway enrichment analysis showing statistically significant BioCarta pathways following glucocorticoid exposure. The size of the circle represents the significance of pathways, and the color of the circle represents the lineages from which DEGs are identified.
Figure 3.
Figure 3.
DMRs and genome-wide associations between methylation and transcriptional heterogeneity in control and glucocorticoid-exposed embryos. (A) Boxplot of the global DNA methylation levels showing the heterogeneity for each lineage in control and glucocorticoid-exposed embryos. The number of cells is labeled at the bottom. (B) Boxplot of methylation levels for different genomic contexts. (C) Comprehensive visualization of associations between methylation, expression, genomic features, and histone modification. From left to right, heatmap represents the methylation level of DMRs in individual cells with the number of DMRs indicated on the left. Missing values in DNA methylation heatmap are indicated with white: the expression level of nearest genes (from transcription start sites [TSSs], including different isoforms) for each DMR, the estimated weighted correlation between the DMRs’ methylation level and gene expression, the distance to its nearest TSS, the DMR annotation, the corresponding overlapping genomic features, the histone modification scores for the DMRs. Genes highlighted are the selective DEGs associated with the DMRs, where red represents down-regulated expression and blue represents up-regulated gene expression. (D) Top enriched sequence aligned to the most significant binding motif identified, PITX2 (217 hits, P = 1.2 × 10⁻⁷ and P of alignment = 0.0001). (E) Representative methylation variance, correlation, and methylation rate near the 3′ region of IGF1R. Shown from bottom to top are the annotation of the IGF1R locus with genomic features, histone modifications; the estimated methylation level of 3-kb sliding windows for each cell with dot size indicating CpG coverage, and dot colors indicating different treatments. The solid curve denotes the weighted mean methylation rate, with line colors representing different treatments and dashed vertical lines delineating the position of transcription termination sites (TTSs) of IGF1R. The correlation between the methylation rate and IGF1R expression for each window. Color of the curve represents the level of significance for the correlations, and the gray-shaded area denotes the 95% confidence interval of the correlation coefficient using the estimated weighted DNA-methylation variance between cells. Two hypomethylated DMRs identified between the control and treated mural cells are highlighted with blue rectangles.
Figure 4.
Figure 4.
Glucocorticoid exposure perturbs X Chromosome dosage compensation. (A) Boxplots of X Chromosome and Chromosome 1 RPKM sums stratified by sex and treatment. Color represents sex. P-value was calculated using the two-sided Wilcoxon test. (B) Boxplots of female-to-male expression ratios of X Chromosome and Chromosome 1 linked genes in TE cells. Color represents treatment and control. P-value was calculated using the two-sided Wilcoxon test. (C) Ridge plot for XIST expression stratified by sex and treatment in TE cells. Color represents sex. (D) Sliding window (20-nearest genes) of female-to-male expression average along the X Chromosome for TE cells. The ticks below the moving-average lines indicate the location of expressed genes included in the estimates, colored according to different treatments. The gray block represents the locus of the centromere position. The gray dashed line denotes the locus of XIST. Similar analysis was performed for Chromosome 1. (E) Female-to-male moving methylation average along the X Chromosome in TE cells using a 50-nearest 100-kb sliding window. Chromosome 1 included for comparison. Colored according to different treatments. The gray block represents the locus of the centromere position. The gray dashed line denotes the locus of XIST.
Figure 5.
Figure 5.
Characterization of small RNAs in control and glucocorticoid-exposed embryos. (A) The proportion of miRNAs, tRNAs, snoRNAs, and snRNAs in control and treated embryos. (B) Heatmap depicting the significant differentially expressed small RNA between control and glucocorticoid-exposed embryos. The type and the number of differentially expressed small RNAs are shown on the left. (C) Node-link diagram for differentially expressed miRNA–mRNA coexpression regulatory network. Red and blue represent log2 fold changes of expression between control and treated cells.

Similar articles

Cited by

References

    1. Angermueller C, Clark SJ, Lee HJ, Macaulay IC, Teng MJ, Hu TX, Krueger F, Smallwood SA, Ponting CP, Voet T, et al. 2016. Parallel single-cell sequencing links transcriptional and epigenetic heterogeneity. Nat Methods 13: 229–232. 10.1038/nmeth.3728 - DOI - PMC - PubMed
    1. Bai Q, Assou S, Haouzi D, Ramirez JM, Monzo C, Becker F, Gerbal-Chaloin S, Hamamah S, de Vos J. 2012. Dissecting the first transcriptional divergence during human embryonic development. Stem Cell Rev Reports 8: 150–162. 10.1007/s12015-011-9301-3 - DOI - PMC - PubMed
    1. Bai R, Dou K, Wu Y, Ma Y, Sun J. 2020. The NF-κB modulated miR-194-5p/IGF1R/PPFIBP axis is crucial for the tumorigenesis of ovarian cancer. J Cancer 11: 3433–3445. 10.7150/jca.40604 - DOI - PMC - PubMed
    1. Bailey TL, Johnson J, Grant CE, Noble WS. 2015. The MEME Suite. Nucleic Acids Res 43: W39–W49. 10.1093/nar/gkv416 - DOI - PMC - PubMed
    1. Barker DJP, Bagby SP, Hanson MA. 2006. Mechanisms of disease: in utero programming in the pathogenesis of hypertension. Nat Clin Pract Nephrol 2: 700–707. 10.1038/ncpneph0344 - DOI - PubMed

Substances