. 2022 Aug 10;13(1):4689.
doi: 10.1038/s41467-022-32087-5.

Targeting the Retinoblastoma/E2F repressive complex by CDK4/6 inhibitors amplifies oncolytic potency of an oncolytic adenovirus

Affiliations

Targeting the Retinoblastoma/E2F repressive complex by CDK4/6 inhibitors amplifies oncolytic potency of an oncolytic adenovirus

Jana Koch et al. Nat Commun. .

Abstract

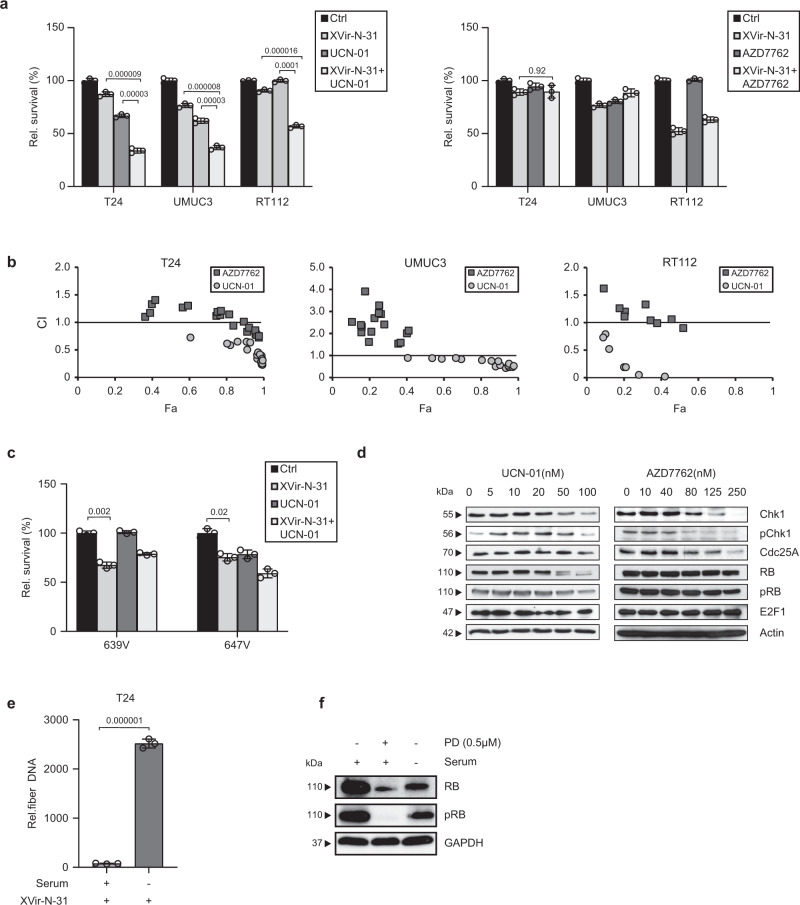
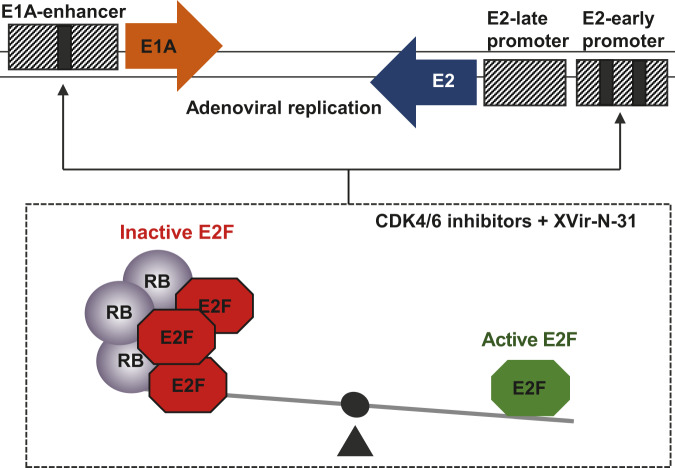
CDK4/6 inhibitors (CDK4/6i) and oncolytic viruses are promising therapeutic agents for the treatment of various cancers. As single agents, CDK4/6 inhibitors that are approved for the treatment of breast cancer in combination with endocrine therapy cause G1 cell cycle arrest, whereas adenoviruses induce progression into S-phase in infected cells as an integral part of the their life cycle. Both CDK4/6 inhibitors and adenovirus replication target the Retinoblastoma protein albeit for different purposes. Here we show that in combination CDK4/6 inhibitors potentiate the anti-tumor effect of the oncolytic adenovirus XVir-N-31 in bladder cancer and murine Ewing sarcoma xenograft models. This increase in oncolytic potency correlates with an increase in virus-producing cancer cells, enhanced viral genome replication, particle formation and consequently cancer cell killing. The molecular mechanism that regulates this response is fundamentally based on the reduction of Retinoblastoma protein expression levels by CDK4/6 inhibitors.


Conflict of interest statement

P.S.H. is co-founder of XVir Therapeutics GmbH. All other authors declare no competing interests.

Figures

Fig. 1
Fig. 1. Combination therapies that downregulate RB expression enhance oncolytic virotherapy.
a Cell proliferation analyses in bladder cancer cell lines. Bladder cancer cells were pre-treated with UCN-01 for 24 h and infected with XVir-N-31 (RT112 (40 nM, MOI 400), T24 (20 nM, MOI 40), and UMUC3 (20 nM, MOI 20)). T24, UMUC3, and RT112 were pre-treated with AZD7762 (80 nM) and infected with MOI 40, MOI 20, and MOI 400 of XVir-N-31, respectively. Cell viability was assessed at 4 dpi. Data are shown as the percentage of surviving cells (n = 3, mean ± SE relative to non-infected, untreated control. b Combination index (CI) plots show synergistic effects on cell viability in combination with UCN-01 (circles) but not with AZD7762 (squares). CI values were calculated using the Chou–Talalay theorem. CI < 1 synergism; CI = 1 additivity; CI > 1 antagonism; Fa: fraction affected. c RB-negative 647V and 639V cells were pre-treated with UCN-01 (20 nM) for 24 h and infected with MOI 2 and MOI 200 of XVir-N-31 respectively. Cell viability was assessed at 4 dpi. Data are shown as the percentage of surviving cells (n = 3, mean ± SE) relative to non-infected, untreated control. p < 0.05 d Protein expression was analyzed by western blotting in T24 cells treated with increasing concentrations of UCN-01 or AZD7762 for 24 h. One representative blot is shown in three independent experiments. e Viral genome replication was assessed in serum-starved T24 cells infected with XVir-N-31 (MOI 50) by qPCR to amplify viral fiber DNA at 24 hpi. Data are represented relative to fiber DNA at 4 hpi as the baseline (n = 3, mean ± SD). f Protein expression was analyzed by western blotting in T24 cells that were serum starved for 24 h. One representative blot is shown in two independent experiments. SD standard deviation, SE standard error, hpi/dpi hours/days post-infection, MOI multiplicity of infection. The statistical significance was determined by a two-sided Student’s t-test. n: number of biologically independent samples. Source data are provided as a Source Data file.
Fig. 2
Fig. 2. Combination with CDK4/6 inhibition enhances oncolytic virotherapy.
a, b Cell proliferation analyses in RB positive T24 cells. a T24 cells were pre-treated for 24 h with CDK4/6 inhibitors as indicated and infected with ADWT (MOI 80) or XVir-N-31 (MOI 60). b T24 cells were treated with increasing concentrations of Palbociclib for 24 h and infected with ADWT (MOI 50) and XVir-N-31 (MOI 50). Cell viability was assessed at 4 dpi. Data are shown as the percentage of surviving cells (n = 3, mean ± SE) relative to non-infected, untreated control. p < 0.05. c RB protein expression was analyzed in T24 cells upon treatment with increasing concentrations of Palbociclib for 24 h by western blotting. d Viral genome replication was assessed by qPCR to amplify viral fiber DNA in T24 cells pre-treated for 24 h with Palbociclib and infected with XVir-N-31 (MOI 50). Data are represented as relative fiber DNA at indicated time points compared to fiber DNA at 4 hpi as baseline (n = 3, mean ± SD). e Quantification of viral particles was performed by a hexon titer test in T24 cells that were pre-treated with indicated CDK4/6 inhibitors (5 µM LEE, 0.5 µM LY, and 0.5 µM PD) and infected with MOI 50 of ADWT or XVir-N-31. The titers are presented as infectious units per milliliter (IFU/ml). n = 3, mean ± SE. f Cellular cell cycle protein expression was determined by western blotting in T24 cells treated with PD, LY, or LEE for up to 3 days. g Viral protein expression was analyzed at indicated time points by western blotting in T24 cells pre-treated with Palbociclib and infected with the viruses ADWT and XVir-N-31 (MOI 50). One representative blot is shown in three independent experiments. h Cell proliferation analyses were performed in RB-negative 647V and 639V cell lines pretreated with Palbociclib (2 µM) and infected with MOI 2 and MOI 200 of XVir-N-31, respectively. Cell viability was analyzed at 4 dpi. Data are shown as a percentage of surviving cells (n = 3, mean ± SE) relative to non-infected, untreated control. hbi hours before infection, hpi/dpi hours/days post-infection, SD standard deviation, SE standard error, MOI multiplicity of infection. The statistical significance was determined by a two-sided Student’s t-test; n number of biologically independent samples. Source data are provided as a Source Data file.
Fig. 3
Fig. 3. CDK4/6i induces a cellular environment that augments virus replication.
a Viral genome replication was assessed by qPCR to amplify viral fiber DNA in T24 cells pre-treated for 24 h with Palbociclib and infected with XVir-N-31 (MOI 1). Data are represented as relative fiber DNA at indicated time points compared to fiber DNA at 4 hpi as the baseline (n = 3, mean ± SD). b Quantification of viral particles in electron microscopy in two independent samples. Data represent the mean of two experiments. c Representative electron microscopy images showing viral proliferation at 48 hpi in T24 cells pre-treated with Palbociclib and infected with ADWT (MOI 50). Scale bars in upper and lower panels represent 4 µm and 400 nm, respectively. d Representative immunocytochemistry images depicting hexon staining at 48 hpi in UMUC-3, T24, RT112, and Hek293 cells infected with MOI 1, 50, 10, and 1 of ADWT respectively. Scale bars represent 100 µM. e Quantification of hexon-positive cells from immunofluorescence. f Representative immunofluorescence images depicting staining against YB-1 protein in T24 cells treated with Palbociclib for 24 h. Scale bars represent 10 µM. SD standard deviation, hpi hours post-infection, MOI multiplicity of infection. The statistical significance was determined by a two-sided Student’s t-test; n number of biologically independent samples. Source data are provided as a Source Data file.
Fig. 4
Fig. 4. The modulation of RB–E2F protein complex by CDK4/6i is responsible for enhanced viral genome replication.
T24 cells were pre-treated for 24 h with 0.5 µM Palbociclib and infected with ADWT or XVir-N-31 (MOI 50). a, b Cellular gene expression was analyzed by qRT-PCR at indicated time points for the genes E2F1 (a) and RB (b). Data are presented as relative mRNA expression compared to the housekeeping gene beta-actin (n = 3, mean ± SD). c Protein expression was analyzed at indicated time points by western blotting. One representative blot is shown in three independent experiments. d, e Viral gene expression was analyzed in ADWT-infected cells by qRT-PCR at indicated time points for the E1A13S gene (d) and E2-early transcripts (e). The data shown represent the mRNA expression in treated samples relative to Actin at each time point (n = 3, mean ± SD). SD standard deviation, MOI multiplicity of infection. The statistical significance was determined by a two-sided Student’s t-test; n number of biologically independent samples. Source data are provided as a Source Data file.
Fig. 5
Fig. 5. RB but not E2F1 expression level is the decisive factor for viral genome replication.
a, b siRNA-mediated knockdown of one of E2F1,3 and 4 was performed with siPOOL technology in T24 cells infected with ADWT or XVir-N-31 (MOI 50). a Viral genome replication was analyzed at 24 hpi. n = 4. b Quantification of viral particles was performed by a hexon titer test and presented as infectious units per milliliter (IFU/ml). n = 2, mean ± SE. c Viral replication was analyzed in T24 cells transfected with siE2F1 pool and treated with 500 nM Palbociclib for 24 h, and infected with XVir-N-31 (MOI 50). d siRNA-mediated knockdown of E2F1 was performed with siPOOL technology in T24 cells and infected with ADWT or XVir-N-31 (MOI 50). Protein levels were detected by immunoblotting at indicated time points for E2F1, RB, and E1A proteins. GAPDH was used as a reference protein. e SK-N-MC cells were transfected with siRNAs against E2F1 or RB or RBL1 (p107) or RBL2 (p130) and infected with the XVir-N-31 (MOI 20). Viral replication was analyzed at 48 hpi. n = 3. f RB-negative T24shRB1 cells and scrambled control T24shCtrl cells were treated with Palbociclib (1 µM) and infected with MOI 50 of the indicated viruses. Viral genome replication was analyzed at 24 hpi. g RB-negative Saos-2 cells were transfected with indicated plasmids and infected with adenovirus ADWT (MOI 20). Viral genome replication was analyzed at 24 hpi. n = 3. All viral genome replication analyses were performed by qPCR to amplify viral fiber DNA. Data are represented as relative fiber DNA at indicated time points compared to fiber DNA at 4 hpi as the baseline (mean ± SD). SD standard deviation, SE standard error, MOI multiplicity of infection, hpi hours post-infection. The statistical significance was determined by a two-sided Student’s t-test; n: number of biologically independent samples. Source data are provided as a Source Data file.
Fig. 6
Fig. 6. E2F binding sites in the adenoviral genome influence viral life cycle.
a, b T24 cells were pre-treated with Ribociclib and infected with the E1A-deleted virus dl312 (MOI 50). a Viral genome replication was assessed at 48 hpi. n = 3. b Quantification of viral particles was performed by a hexon titer test and presented as infectious units per milliliter (IFU/ml) (n = 3, mean ± SE). c E2-early promoter activity was examined by transfecting T24 cells with plasmids pE2-early-luc or pE2-earlyM-luc. Cells were pre-treated with Palbociclib (0.5 µM) and infected with adenoviruses dl703 or dl348 (MOI 100). Luciferase activity was measured at 42hpi. Results are presented as relative luciferase activity in the percentage of control, (n = 3, mean ± SE). d Viral genome replication upon E2F-binding site mutation in E2-early promoter was assessed in T24 and UMUC-3 cells that are infected with ADWT or ADWT/E2Fm (MOI 10) at 24 hpi. e, f The effect of E2F-binding on E2-early promoter activity was assessed in T24 cells that were transfected with a plasmid containing 10 E2-early motifs with 20 E2F binding sites (pE2-early-luc-Trap) or with mutated E2F binding sites (pE2-early-luc-TrapM). Cells were infected with ADWT (MOI 50). Luciferase activity (e) (mean ± SE) and viral replication (f) were assessed at 24 hpi, n = 3. g Viral genome replication was analyzed at 24hpi in T24 cells infected with ADWT or ADWT/Trap at indicated MOI, n = 3. h T24 cells were infected with ADWT or ADWT/Trap (MOI 10) and viral genome replication was analyzed at indicated time points, n = 3. All the viral replication analyses were performed by qPCR to amplify viral fiber DNA. Data are represented as relative fiber compared to fiber DNA at 4hpi as baseline (n = 3, mean ± SD). SD standard deviation, SE standard error, hpi hours post infection, MOI multiplicity of infection. The statistical significance was determined by two-sided Student’s t-test; n number of biologically independent samples. Source data are provided as a Source Data file.
Fig. 7
Fig. 7. CDK4/6i enhances expression of early genes in ADWT/E2Fm.
a Gene expression was studied in T24 cells infected with viruses ADWT or ADWT/E2Fm (MOI 10) at indicated time points after infection for the viral E1A13S gene, E2-early transcripts, E2-late transcripts and fiber gene. Data are represented as relative mRNA expression compared to the reference gene beta-actin (n = 3, mean ± SD). b Protein expression was analyzed by western blotting in T24 cells infected with ADWT and ADWT/E2Fm (MOI 10) at indicated time points. One representative blot is shown of three independent experiments. c T24 cells, infected with ADWT or ADWT/E2Fm (MOI 50), were crosslinked, isolated and DNA was digested with micrococcal nuclease and subjected to chromatin immunoprecipitation using an E2F1 antibody at 8 hpi. IgG was used as a negative control. Precipitated DNA was quantified by RT-PCR using primers for the E1-enhancer. Palbociclib (0.5 µM) treated cells were used as the positive control (n = 3, mean ± SE). d Gene expression for viral genes was analyzed in T24 cells pre-treated with Palbociclib (0.5 µM) and infected with ADWT and ADWT/E2Fm (MOI 50) at 20 hpi. Data are represented as the fold increase relative to untreated control (n = 3, mean ± SD). e Expression analysis for the viral transcripts E1A13S and E2-early transcripts was performed through qRT-PCR in the cells infected with ADWT or ADWT/2xE2Fm (MOI 10). Data are represented as relative mRNA expression compared to the reference gene beta-actin (n = 3, mean ± SD). SD standard deviation, SE standard error, MOI multiplicity of infection, hpi hours post infection. The statistical significance was determined by two-sided Student’s t-test; n number of biologically independent samples. Source data are provided as a Source Data file.
Fig. 8
Fig. 8. Effect of combination and monotherapy in xenograft mouse models.
a Experimental design of the in vivo study (nude mouse model). VP viral particles. b Kaplan–Meier survival curves of treatment groups (n = number of animals pre group). Statistics, if not specified otherwise were derived from mixed-effect modeling using the TumGrowth software (see methods section) Survival curves were compared using the log-rank test. c Tumor volume growth curves of respective treatment groups. Each data point shows the mean ± SE tumor size at indicated days after initiation of treatment. LEE011 (LEE) was administered daily at 200 mg/kg/body weight by oral gavage for a total of 5 days (day X until day X + 3). All control animals which did not receive XVir-N-31, received intratumoral PBS injections. d Evaluation of therapy response at days 12–21 after initiation of treatment is indicated column bars (tumor volume) of respective treatment groups (PBS, LEE, XVir-N-31 only, combo); the number of animals per group is indicated (n). e Viral genome replication within the tumor is assessed by qPCR to amplify viral fiber DNA in three independent tumors in monotherapy (XVir-N-31 only) and in combination therapy (LEE + XVir-N-31), mean ± SD. f Hematoxylin and eosin staining of the xenografts. Arrows indicate necrotic areas. Scale bars represent 100 µm. g A comparable experimental setup as described in (a) was used but A673 tumor cells were implanted in Rag2−/−γc−/−mice. LEE was also administered daily at 200 mg/kg/body weight for a total of 5 days but XVir-N-31 was only injected once (1 × 1011 VP) at DX + 2 and whole tumors were harvested at DX + 5 for immunoblotting analysis. Each lane presents one explanted tumor and h depicts the densitometric quantification of the immunoblots per group and protein, as indicated (done with ImageJ 1.53k). Tukey’s multiple comparison in combination with two-way ANOVA was used for statistical analysis (GraphPad Prism). Source data are provided as a Source Data file.
Fig. 9
Fig. 9. Control of viral replication in the combination therapy with oncolytic adenovirus and CDK4/6 inhibitors.
Adenovirus E1A and E2 expression is controlled by the well-balanced E2F/RB protein complex through E2F-binding sites in their promoter region (black bars). Both promoter regions compete for binding of the E2F/RB protein complex indicating a novel level of regulatory mechanism in viral life cycle. Excess level of this protein complex suppresses efficient transcription at early time points in the replication life cycle. Inhibition of RB and E2F1 protein level by CDK4/6-inhibitors might cause a shift towards low level of active E2F1 and thus facilitate early viral gene expression and replication.

Similar articles

Cited by

References

    1. Matsuda T, Karube H, Aruga A. A comparative safety profile assessment of oncolytic virus therapy based on clinical trials. Ther. Innov. Regul. Sci. 2018;52:430–437. doi: 10.1177/2168479017738979. - DOI - PubMed
    1. Peter, M. & Kuhnel, F. Oncolytic adenovirus in cancer immunotherapy. Cancers (Basel)12, 3354 (2020). - PMC - PubMed
    1. Hong J, Yun CO. Overcoming the limitations of locally administered oncolytic virotherapy. BMC Biomed. Eng. 2019;1:17. doi: 10.1186/s42490-019-0016-x. - DOI - PMC - PubMed
    1. Chesney J, et al. Randomized, Open-Label Phase II Study evaluating the efficacy and safety of talimogene laherparepvec in combination with ipilimumab versus ipilimumab alone in patients with advanced, unresectable melanoma. J. Clin. Oncol. 2018;36:1658–1667. doi: 10.1200/JCO.2017.73.7379. - DOI - PMC - PubMed
    1. Hindupur, S. V. et al. STAT3/5 inhibitors suppress proliferation in bladder cancer and enhance oncolytic adenovirus therapy. Int. J. Mol. Sci.21, 1106 (2020). - PMC - PubMed

Publication types

MeSH terms