. 2022 Aug 10;13(1):4699.
doi: 10.1038/s41467-022-32379-w.

Conserved subcortical processing in visuo-vestibular gaze control

Affiliations

Conserved subcortical processing in visuo-vestibular gaze control

Tobias Wibble et al. Nat Commun. .

Abstract

Gaze stabilization compensates for movements of the head or external environment to minimize image blurring. Multisensory information stabilizes the scene on the retina via the vestibulo-ocular (VOR) and optokinetic (OKR) reflexes. While the organization of neuronal circuits underlying VOR is well-described across vertebrates, less is known about the contribution and evolution of the OKR and the basic structures allowing visuo-vestibular integration. To analyze these neuronal pathways underlying visuo-vestibular integration, we developed a setup using a lamprey eye-brain-labyrinth preparation, which allowed coordinating electrophysiological recordings, vestibular stimulation with a moving platform, and visual stimulation via screens. Lampreys exhibit robust visuo-vestibular integration, with optokinetic information processed in the pretectum that can be downregulated from tectum. Visual and vestibular inputs are integrated at several subcortical levels. Additionally, saccades are present in the form of nystagmus. Thus, all basic components of the visuo-vestibular control of gaze were present already at the dawn of vertebrate evolution.


Conflict of interest statement

The authors declare no competing interests.

Figures
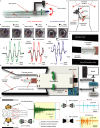
Fig. 1
Fig. 1. A platform to perform electrophysiological recordings coordinated with visual and vestibular stimuli.
a Schematic showing the setup used to monitor VOR eye movements. b–d (Top) Representative frames before (left) and at the peak of stimulation (right) in response to rotations in the roll (a), yaw (b), and pitch (c) planes (Scale bars = 1 mm). The red dotted line indicates eye position before stimulation, and the green dotted line its position at the peak of vestibular stimulation. The colored dots in the images represent the labels used for the tracking system to calculate the eye trajectory. (Bottom) Traces representing the eye position (black) respect to the head position during several rotations in the roll (green), yaw (red), and pitch (blue) planes. e–g Schematic illustrations of the lamprey tilting platform. The system is controlled through Matlab, allowing for synchronized visual and vestibular stimulations through an Arduino controller board, which also engages a digitizer for electrophysiological recordings. The platform is moved with a servo-engine, controlled by another Arduino board, that rotates the transparent chamber containing the preparation together with the recording electrodes. A transparent chamber (containing an eye-labyrinth-brain preparation) connected to a tilting platform is placed between two screens as seen from the front (e) and side (f). An overall representation of the platform is shown in g. h Schematic showing the preparation used for recording activity in the eye muscles or different brain areas. The red squares indicate the location of the otic capsules, where the vestibular organs are located. A representative trace showing the activity evoked in response to a 22.7° tilting of the platform with angular speed of 112.94°/s, combined with coordinated visual stimulation, is shown to the left. To the right are similar recordings brought on by optokinetic stimulation of 48.71°/s (top), and vestibular stimulation in darkness of the same velocity at an amplitude of 5.8° (bottom). The blue area indicates the duration of the roll movement, yellow the duration of static tilt, and the dotted rectangle signifies ongoing optokinetic stimulation. Abbreviations: RR Rostral rectus, DR Dorsal Rectus, CR Caudal rectus, aCSF artificial cerebrospinal fluid.
Fig. 2
Fig. 2. Lamprey optokinetic responses.
a Graphical illustration of the normalized EMG amplitudes (left) and number of spikes (right) of the evoked EMG activity in the dorsal rectus of one animal during optokinetic stimulations in the roll plane across a range of velocities. b Representative traces at three different velocities during roll stimulations. The dotted rectangle indicates the duration of the optokinetic stimulation. c Graphs showing the EMG activity in the dorsal rectus of one animal during optokinetic stimulations in the pitch plane across a range of velocities. d Representative traces at three different velocities during pitch stimulations. e, f Mean EMG amplitudes and spikes reflecting the EMG activity in the dorsal rectus in response to optokinetic stimulation in the roll (e) and pitch (f) planes combining the data from six animals for roll, and five for pitch. A repeated measures ANOVA revealed significant effects of stimulation velocity on EMG amplitudes (F[3, 51] = 7.858, p < 0.001) and spikes (F[3, 51] = 3.366, p = 0.026) in the roll plane, as well as EMG amplitudes (F[4, 56] = 5.057, p = 0.001) in the pitch plane. g Graph showing that EMG activity does not increase in parallel to the speed of optokinetic stimulation in the yaw plane. Representative traces are shown in h. i Reliable optokinetic responses in the roll plane were however observed in animals lacking a yaw plane response. Holm corrections were carried out for all analyses. The shaded areas in the graphs denote error bands. Source data are provided as a Source Data file. Roll plane analysis was carried out on n = 52 independent samples from three animals, while pitch plane analysis was carried out on n = 57 independent samples from three animals.
Fig. 3
Fig. 3. Impact of visual and vestibular stimuli on eye movements.
a A schematic representation of the three experimental paradigms implemented: visual (top), vestibular (middle) and visuovestibular (bottom). Arrows indicate direction of stimuli movement for both visual (green) and vestibular stimulation (black). A recording electrode was placed in the right dorsal rectus muscle. b–e Graphs showing EMG activity in terms of spikes number in response to visual (VIS), vestibular (VES), and visuovestibular (VISVES) stimulations during four different stimulation protocols in terms of amplitude and velocity. Amplitude refers to the peak tilting angle of the platform, and speed to the motion velocity of the platform or the visual stimulus. Significance between modalities is represented by stars in each graph and was retrieved through paired T-tests: Low amplitude low speed (VES to VISVES t(23) = −4.802, p < 0.001; n = 24 recordings from eight animals), Low amplitude high speed (VIS to VES t(36) = −3.346, p = 0.002 p = 0.002 and VES to VISVES t(38) = −2.930, p = 0.006 p = 0.006; n = 37 recordings from 13 animals), High amplitude low speed (VIS to VES t(22) = −11.559, p < 0.001, p < 0.001; n = 24 recordings from eight animals), High amplitude high speed (VIS to VES t(27) = −13.808, p < 0.001; n = 29 recordings from ten animals). f–i Graphs showing EMG activity in terms of maximum amplitudes in response to VIS, VES and VISVES stimulations during four different stimulation protocols ((g) VES to VISVES t(38) = −2.475, p = 0.018, n = 37 recordings from 13 animals; (h) VIS to VES t(23) = −6.315, p < 0.001, n = 24 recordings from eight animals; VES to VISVES t(22) = −2.614, p = 0.016, and (i) VIS to VES t(28) = −15.457, p < 0.001, n = 29 recordings from ten animals). j, k Representative responses for the lowest (j) and the highest intensity (k). The blue area indicates the duration of the roll movement, yellow the duration of static tilt, and the red dotted rectangle signifies ongoing optokinetic stimulation. All T-tests were two-tailed with no corrections. Throughout the figure, data are presented as mean values ± SD. Source data are provided as a Source Data file.
Fig. 4
Fig. 4. Temporal dynamics of visuo-vestibular integration.
a–d Graphs showing the average time taken to reach the peak EMG amplitude for each modality during the different paradigms. Paired T-tests yielded significance results for: Low amplitude low speed (VIS to VES t(16) = 5.506, p < 0.001, n = 17 recordings from eight animals), Low amplitude high speed (VIS to VES t(23) = 10.871, p < 0.001, n = 24 recordings from eleven animals and VES to VISVES t(30) = −3.411, p = 0.002, n = 31 recordings from eleven animals), High amplitude high speed (VES to VISVES t(28) = 2.818, p = 0.009, n = 29 recordings from twelve animals). e Heat maps illustrating spiking activity during for four different paradigms for one representative animal. Values have been normalized to the highest density cluster, and dark blue signifies no spiking while yellow shows the greatest number of spikes. Each segment shows the spiking activity in a 100 ms windows, combining the averaged data from three different trials. All T-tests were two-tailed with no corrections. Throughout the figure, data are presented as mean values ± SD. Source data are provided as a Source Data file.
Fig. 5
Fig. 5. Visual and vestibular sources to the oculomotor nucleus.
a Neurobiotin was injected in the oculomotor nucleus (inset), which showed ipsilateral projections from thalamus. b Numerous retrogradely labeled cells were found in pretectum forming a population projecting to the ipsilateral oculomotor nucleus. c Retrogradely neurons in the region of the nMLF. Some retrogradely labeled neurons were also observed in the SNc (arrows). d, e Projections were also found from the two other cranial nerve nuclei responsible for extraocular muscle innervation, illustrated here by a cell population in the trochlear nucleus (d) and contralateral abducens nucleus (e). Retrogradely labeled neurons were also found in the ventral part of the isthmic region, nearby the thick axons labeled from the AON. (d arrows). f a strong projection was confirmed, from the AON, and retrogradely labeled neurons were also found in dorsal aspects of the OLA. Abbreviations: Th Thalamus, Hyp Hypothalamus, pc posterior commissure, PT Pretectum, ot Optic Tract, nMLF Nucleus of the Medial Longitudinal Fasciculus, SNc, Substantia Nigra Pars Compacta, nIV Trochlear Motor Nucleus, AON Anterior Octavomotor Nucleus, OLA Octavolateral Area, ION Intermediate Octavomotor Nucleus, nVI Abducens Motor Nucleus. Scale bar = 250 µm in a (and inset) and e; 100 µm in b and c; 150 µm in d and f.
Fig. 6
Fig. 6. Optokinetic responses are mediated by pretectum and downregulated by tectum.
a EMG responses in the dorsal rectus to optokinetic stimulation in an intact brain (black trace) and after precise inactivation of the visual input to tectum (red trace) and pretectum (blue trace). b EMG responses in the dorsal rectus to a visual stimulus in an intact brain (black trace) and after precise pharmacological inactivation with kynurenic acid of pretectum leading to the abolishment of the optokinetic reflex (red trace), which returned after a washout (green trace). The red dotted rectangle indicates the duration of the visual stimulation. c graph showing the significant reduction in dorsal rectus activity in response to optokinetic stimulation after pretectal inactivation with kynurenic acid (KA; t(6) = 2.633, p = 0.039, n = 7 recordings from three animals), and the significant recovery after washout (t(3) = −3.703, p = 0.034, n = 4 recordings from three animals). The shaded area denotes error bands. d Graphs showing the normalized EMG amplitudes (left) and spikes (right) to visual (VIS), vestibular (VES), and visuovestibular (VISVES) stimulations in the roll plane after tectal inactivation. Paired T-tests revealed significant differences in the number of evoked spikes between VIS to VES (t(13) = −3.277, p = 0.006, n = 14 recordings from five animals) and VES to VISVES (t(14) = −2.740, p = 0.016, n = 15 recordings from 5 animals), as well as in maximum EMG amplitudes (VIS to VES t(14) = −3.717, p = 0.002; and VES to VISVES t(14) = −2.917, p = 0.011; n = 15 recordings from five animals for both). e Lamprey eye movement responses to VIS, VES, and VISVES stimulations in the roll plane during tectal inactivation as reflected by representative EMG recordings in the dorsal rectus. f VISVES responses were significantly larger after tectal inactivation for both amplitudes (t(14) = −3.005, p = 0.009, n = 15 recordings from five animals) and spikes (t(13) = −2.469, p = 0.028, n = 14 recordings from five animals). All T-tests were t-tailed with no corrections. Data are presented as mean values ± SD. Source data are provided as a Source Data file.
Fig. 7
Fig. 7. Visual inputs to the vestibular nucleus.
a (left) Recordings in the AON in response to optokynetic stimulation during normal conditions (black trace) and after tectal lesioning (red trace). The red dotted rectangle indicates the duration of the visual stimulation. b Anterogradely labeled fibers terminating in the contralateral nIII, after a neurobiotin injection into AON (inset). Labeled fibers also course more caudally towards the nMLF (dashed oval; see e). c Retrogradely labeled cells were found in the ipsilateral thalamus d Retrogradely labeled cells can be seen in pretectum (right) with dendrites reaching into the optic tract. e Terminals in the ipsilateral nMLF. f Contralateral projections at the level of the injection site, revealing significant cross-talk between vestibular areas. g A schematic showing the thick section of the lamprey brain used for intracellular patch-clamp recordings, maintaining the pretectum and exposing AON for whole-cell recordings. A tracer injection was previously made in the tract from the AON to the nIII, at the level of the isthmus, allowing for visualizing projection neurons in the AON for whole-cell recordings. h Excitatory (bottom, red trace) responses of a representative cell in a prelabelled AON neuron during a four pulses stimulation (10 Hz). No cessation of spikes, indicative of inhibitory inputs, was observed when neurons where depolarized (top, blue trace). i Voltage responses to hyperpolarizing and depolarizing 500 ms current steps of 10 pA per step, elicited from rest at −68 mV, showing threshold (blue trace) and suprathreshold response (red trace). j Quantification of excitatory postsynaptic potential (EPSP) amplitudes in AON cells projecting to nIII evoked by sustained stimulation (10 pulses at 10 Hz) of the pretectum/optic tract recorded in current-clamp mode. Values are normalized to the first EPSP. Data are presented as mean values ± SD. Abbreviations: AON Anterior Octavomotor Nucleus, nIII Oculomotor nucleus, Th Thalamus, pc posterior commissure, PT Pretectum, ot Optic Tract, nMLF Nucleus of the Medial Longitudinal Fasciculus, SNc Substantia Nigra Pars Compacta, OLA Octavolateral Area. Scale bar = 150 µm in b; 250 µm in b-inset; 100 µm in cf. Source data are provided as a Source Data file.
Fig. 8
Fig. 8. VOR nystagmus.
a Our in-lab built platform allowed for controlled rotations of intact lampreys in the yaw plane. Animals were encased in a transparent plastic tube filled with cold fresh water. The diameter of the cylinder allowed for breathing while limiting the animal’s freedom of movement. A camera was attached to the platform so that one eye could be filmed during the stimulation, which consisted in 180° rotations at different speeds. b Lamprey eye positions were quantified using DeepLabCut, which allowed for identifying movements of the pupil (four labels were used to average, indicated in orange, blue, purple and pink) in reference to the head (yellow). The red dotted line represents eye position at the start of the yaw stimulation (static position), while the green line indicates the end position of the slow (compensatory) phase result of a movement in opposite direction to that of the head. The blue line indicates the end position of the eye after the following quick phase (resetting) eye movement in the same direction as the head movement. c Using the eye-tracker previously outlined, the eye position could be translated into angular degrees over time, revealing a clear sawtooth-pattern indicating a VOR with nystagmus. d The durations of eye movement slow-phases (black) and quick-phases (red) were plotted for the duration of the rotational yaw movement. Durations were calculated based on frame-by-frame analysis of the video recording. (27.4, 68.5, 137°/s). As indicated in the graph, the quick-phase eye movements (red) were consistently of the same general duration across trials as compared to slow-phases (black), which also showed higher variability among different trials at the same speed, as reflected in their larger standard deviations as compared to quick-phase eye movements. Data are presented as mean values ± SD. The shaded areas denote error bands. Source data are provided as a Source Data file.
Fig. 9
Fig. 9. Locomotion evoked eye movements.
a Schematic showing the semi-intact lamprey preparation used to monitor body and eye movements. The rostral segment up to the spinal cord is dissected according to the same principles as the ex vivo preparation, exposing the brain and the eyes. The remainder of the body and tail were kept intact in order to allow locomotion. A video camera was placed coupled to a microscope to film the preparation from above. b Either spontaneous or tactilely induced locomotion (by gently pinching the tail) was recorded, and eye and body movements were analyzed over time. Eye movements synchronized with swimming activity were observed. Images show two different positions of the eyes and the tail during a swimming episode. c Trajectories of the tail (black) and eyes (green, right eye; purple, left eye) showing that coordinated movements of both eyes occur together with tail movements. d Although these movements were less consistent, they were preserved after visual and vestibular inactivation. e Graph showing the positive correlation (Pearson’s correlation analysis, r (1166) = 0.707, p < 0.001) between the right and left eyes, indicating their synchronization. f, g Graphs showing that tail and eye movements are correlated both before (f; Pearson’s correlation analysis, r (1160) = −0.553, p < 0.001), and after (g) visuovestibular inactivation (r (1582) = −0.450, p < 0.001), indicating that the observed coupled eye movements are generated by locomotion corollary discharges. Source data are provided as a Source Data file.
Fig. 10
Fig. 10. Subcortical pathways controlling gaze-stabilization.
a A schematic showing the flow of visual (from the eye) and vestibular (from the labyrinth) information when producing gaze-stabilizing eye movements (shadowed in yellow) and the likely pathway underlying goal-oriented eye movements (shadowed in red). Brain areas that process only visual information are highlighted in orange, vestibular in blue, and visuovestibular in green. Note that, as in mammals, visual information already impacts vestibular inputs as soon as they enter the brain, and that all visuovestibular regions can be activated by visual or vestibular inputs independently. The motoneurons of the oculomotor nuclei initiate the VOR/OKR through recruiting the relevant extraocular muscles during the final step of the sensorimotor integration. b A phylogenetic tree featuring the seven main classes of vertebrates and the eye movements available to them,. Note that this diagram denotes the presence of an eye movement type within each class, meaning that not all member species are necessarily in possession of it. Smooth-tracking eye movements (in red) are present only in primates. The branches of the tree are not to scale. Abbreviations: PT pretectum, OT optic tectum nMLF nucleus of the medial longitudinal fasciculus, VA vestibular area.

Similar articles

Cited by

References

    1. Land MF. Eye movements of vertebrates and their relation to eye form and function. J. Comp. Physiol. A. Neuroethol. Sens. Neural Behav. Physiol. 2015;201:195–214. doi: 10.1007/s00359-014-0964-5. - DOI - PubMed
    1. Baker R. From genes to behavior in the vestibular system. Otolaryngol. Head. Neck Surg. 1998;119:263–275. doi: 10.1016/S0194-5998(98)70061-0. - DOI - PubMed
    1. Hardcastle BJ, Krapp HG. Evolution of biological image stabilization. Curr. Biol. 2016;26:R1010–R1021. doi: 10.1016/j.cub.2016.08.059. - DOI - PubMed
    1. Straka H, Fritzsch B, Glover JC. Connecting ears to eye muscles: evolution of a ‘simple’ reflex arc. Brain Behav. Evol. 2014;83:162–175. doi: 10.1159/000357833. - DOI - PubMed
    1. Angelaki DE, Cullen KE. Vestibular system: the many facets of a multimodal sense. Annu. Rev. Neurosci. 2008;31:125–150. doi: 10.1146/annurev.neuro.31.060407.125555. - DOI - PubMed

Publication types