. 2022 Aug 10;13(1):4682.
doi: 10.1038/s41467-022-32420-y.

Local molecular and global connectomic contributions to cross-disorder cortical abnormalities

Affiliations

Local molecular and global connectomic contributions to cross-disorder cortical abnormalities

Justine Y Hansen et al. Nat Commun. .

Abstract

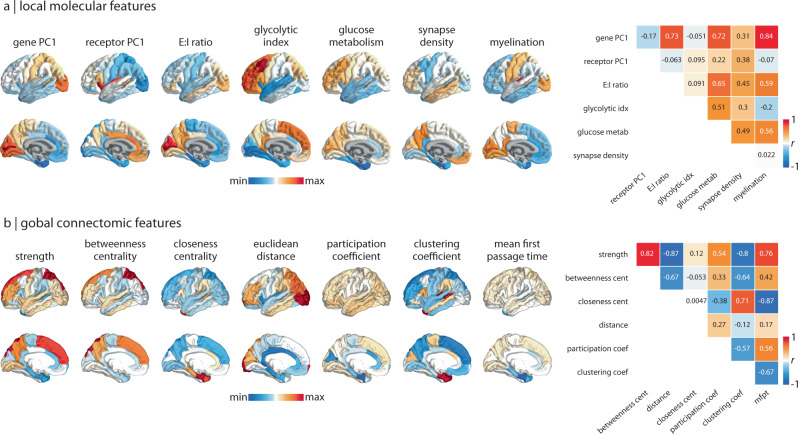
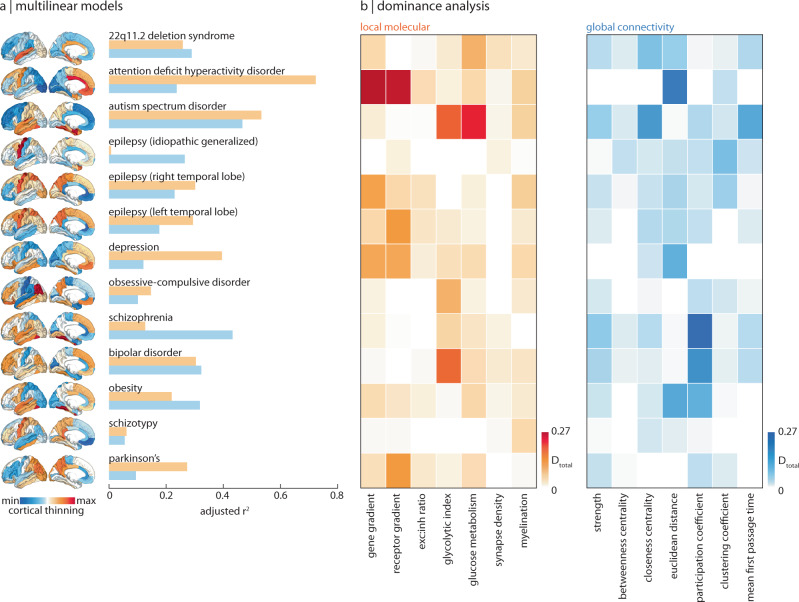
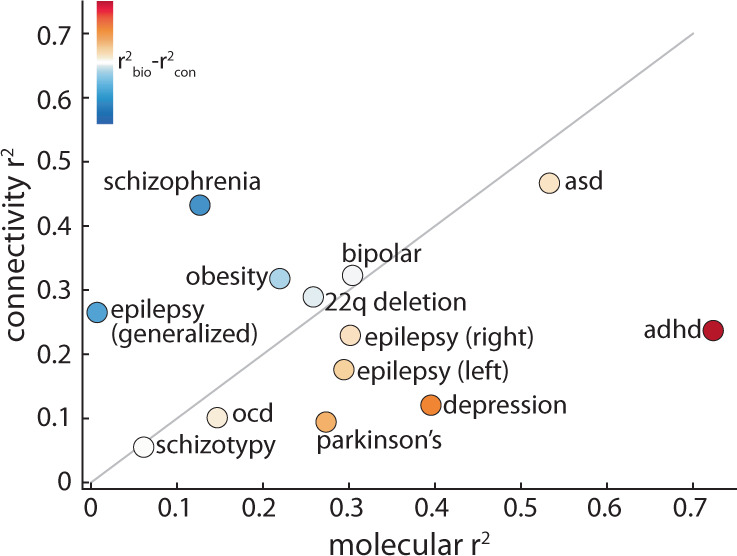
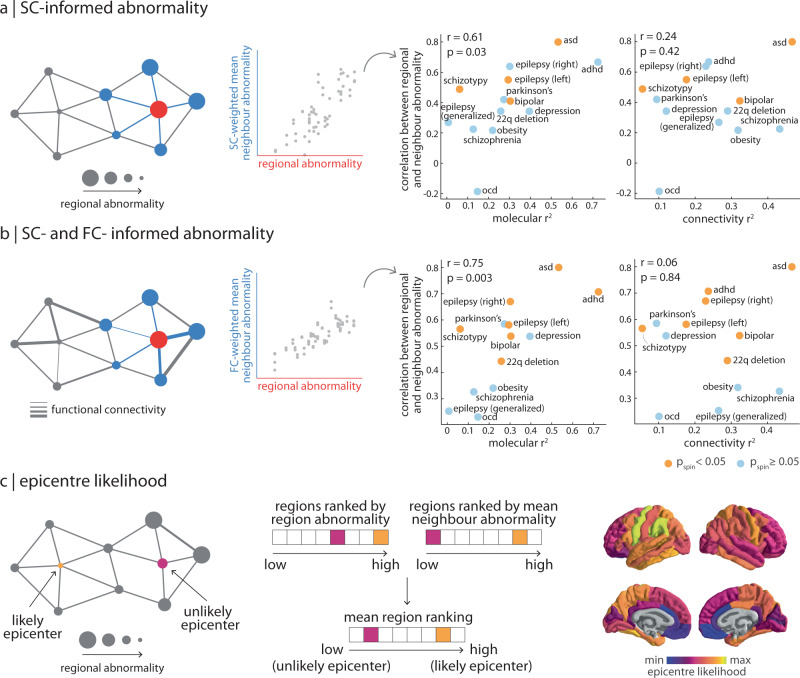
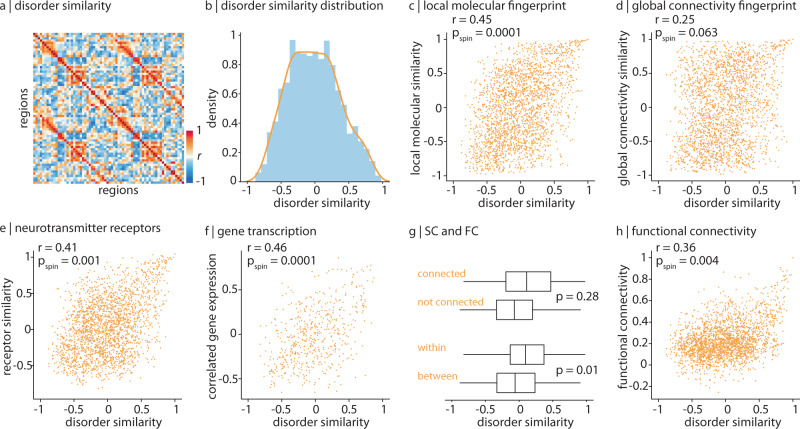
Numerous brain disorders demonstrate structural brain abnormalities, which are thought to arise from molecular perturbations or connectome miswiring. The unique and shared contributions of these molecular and connectomic vulnerabilities to brain disorders remain unknown, and has yet to be studied in a single multi-disorder framework. Using MRI morphometry from the ENIGMA consortium, we construct maps of cortical abnormalities for thirteen neurodevelopmental, neurological, and psychiatric disorders from N = 21,000 participants and N = 26,000 controls, collected using a harmonised processing protocol. We systematically compare cortical maps to multiple micro-architectural measures, including gene expression, neurotransmitter density, metabolism, and myelination (molecular vulnerability), as well as global connectomic measures including number of connections, centrality, and connection diversity (connectomic vulnerability). We find a relationship between molecular vulnerability and white-matter architecture that drives cortical disorder profiles. Local attributes, particularly neurotransmitter receptor profiles, constitute the best predictors of both disorder-specific cortical morphology and cross-disorder similarity. Finally, we find that cross-disorder abnormalities are consistently subtended by a small subset of network epicentres in bilateral sensory-motor, inferior temporal lobe, precuneus, and superior parietal cortex. Collectively, our results highlight how local molecular attributes and global connectivity jointly shape cross-disorder cortical abnormalities.


Conflict of interest statement

C.R.K.C., N.J., P.M.T. received partial research support from Biogen, Inc., for research unrelated to this manuscript. J.B. has been in the past 3 years a consultant to/member of advisory board of/and/or speaker for Takeda/Shire, Roche, Medice, Angelini, Janssen, and Servier. He is not an employee of any of these companies, and not a stock shareholder of any of these companies. He has no other financial or material support, including expert testimony, patents, royalties. B.F. has received educational speaking fees from Medice GmbH. D.J.S. has received research grants and/or consultancy honoraria from Lundbeck and Sun. The remaining authors declare no competing interests.

Figures

Fig. 1
Fig. 1. Molecular and connectomic cortical profiles.
a, b Brain surfaces show the z-scored molecular (a) and connectomic (b) predictors used in the multilinear regression models. Heatmaps on the right show Pearson's correlation coefficients between pairs of features. See Methods for details on how each feature was derived. Molecular predictors: gene PC1 = first component of 11 560 genes' expression; receptor PC1 = first component of 18 PET-derived receptor/transporter density; E:I ratio = excitatory:inhibitory receptor density ratio; glycolytic index = amount of aerobic glycolysis; glucose metabolism =18F-labelled fluorodeoxyglucose (FDG) PET image; synapse density = synaptic vesicle glycoprotein 2A (SV2A)-binding 11CUCB-J PET tracer; myelination = T1w/T2w ratio. Connectivity predictors: strength = sum of weighted connections; betweenness = fraction of all shortest paths traversing region i; closeness = mean shortest path length between region i and all other regions; Euclidean distance = mean Euclidean distance between region i and all other regions; participation coefficient = diversity of connections from region i to the seven Yeo-Krienen resting-state networks; clustering = fraction of triangles including region i; mean first passage time = average time for a random walker to travel from region i to any other region.
Fig. 2
Fig. 2. Local and global contributions to disorder-specific cortical morphology.
a A total of twenty-six multilinear models were fit between local molecular and global connectome predictors to cortical abnormality maps of thirteen different disorders (surface plots, left). Adjusted R2 is shown in the bar plot (orange: molecular; blue: connectivity). b Dominance analysis was applied to assess the contribution of each input variable (done separately for molecular (orange) and connectivity (blue) predictors) to the fit of the model.
Fig. 3
Fig. 3. Comparing molecular and connectomic contributions to disorder-specific cortical differences.
The local molecular Radj2 of each disorder is plotted against the global connectivity Radj2. The grey line indicates the identity line and circle colour represents the difference between molecular and connectomic Radj2, such that warm colours represent disorders that are better predicted by molecular predictors, and cool colours represent disorders that are better predicted by connectomic predictors.
Fig. 4
Fig. 4. Interactions between molecular and connectomic vulnerability.
a Left: schematic of structural connectivity informing disorder-related cortical changes. The correlation between SC-weighted mean neighbour abnormality and region abnormality represents the extent to which a disorder demonstrates network-spreading disorder-specific cortical morphology. Right: this correlation coefficient was then correlated (Pearson’s r, two-sided) to both local molecular (left) and global connectivity (right) Radj2. Yellow points refer to disorders where the correlation between region abnormality and SC-weighted mean neighbour abnormality is significant (pspin < 0.05). b Left: likewise, mean neighbour abnormality can be additionally weighted by functional connectivity between regions. Right: correlation (Pearson’s r, two-sided) between the extent to which a disorder demonstrates SC- and FC-informed network-spreading cortical morphology and local molecular (left) and global connectivity (right) Radj2. Yellow points refer to disorders where the correlation between region abnormality and SC- and FC-weighted mean neighbour abnormality is significant (pspin < 0.05). c Left: a region with high abnormality that is also connected to regions with high abnormality is considered a likely disorder epicentre. Middle: epicentre likelihood was calculated as the mean rank of region and neighbour abnormality (see Supplementary Fig. 7 for individual epicentre likelihoods). Right: median epicentre likelihood was calculated for the disorders that show a significant correlation between regional and neighbour abnormality. To limit biasing cross-disorder epicentre likelihood towards epilepsy epicentre likelihood, left and right temporal lobe epilepsy epicentre likelihood was merged into a single mean epicentre likelihood map, prior to calculating the median. For completeness, Supplementary Fig. 8 shows cross-disorder epicentre likelihood when calculated using alternative statistics.
Fig. 5
Fig. 5. Brain regions with similar molecular annotations are similarly affected across disorders.
a Disorder similarity was computed as the pairwise correlation of regional cortical abnormality across all thirteen disorders such that pairs of regions with high disorder similarity are similarly affected across disorders. b A histogram depicting the upper triangle of the disorder similarity matrix. c Disorder similarity is significantly correlated to molecular attribute similarity (Pearson's r(2276) = 0.45, pspin = 0.0001, CI = [0.42, 0.49], two-tailed). d Disorder similarity is not significantly correlated with connectomic similarity (Pearson's r(2276) = 0.25, pspin = 0.063, CI = [0.21, 0.29], two-tailed). e Disorder similarity is significantly correlated to neurotransmitter receptor similarity (Pearson's r(2276) = 0.41, pspin = 0.001, CI = [0.38, 0.45], two-tailed). f Left hemisphere disorder similarity is significantly correlated to correlated gene expression (Pearson's r(559) = 0.46, pspin = 0.0001, CI = [0.40, 0.53], two-tailed). g Disorder similarity is significantly greater within intrinsic functional networks than between networks, against the spin-test (p = 0.01; bottom). Disorder similarity is non-significantly greater between structurally connected regions than regions that are not connected, against a degree- and edge-length-preserving null model (p = 0.028). Bounds of the box represent the 1st (25%) and 3rd (75%) quartiles, the centre line represents the median, and whiskers represent the minima and maxima of the distribution. Nconnected = 592 edges, Nnotconnected = 1686. Nwithin = 388, Nbetween = 1890. h Disorder similarity is significantly correlated to functional connectivity (Pearson's r(2276) = 0.36, pspin = 0.004, CI = [0.33, 0.40], two-tailed).

References

    1. Crossley NA, et al. The hubs of the human connectome are generally implicated in the anatomy of brain disorders. Brain. 2014;137:2382–2395. doi: 10.1093/brain/awu132. - DOI - PMC - PubMed
    1. van den Heuvel MP, Sporns O. Network hubs in the human brain. Trend. Cogn. Sci. 2013;17:683–696. doi: 10.1016/j.tics.2013.09.012. - DOI - PubMed
    1. de Lange SC, et al. Shared vulnerability for connectome alterations across psychiatric and neurological brain disorders. Nat. Human Behav. 2019;3:988–998. doi: 10.1038/s41562-019-0659-6. - DOI - PubMed
    1. Warren JD, et al. Molecular nexopathies: a new paradigm of neurodegenerative disease. Trend. Neurosci. 2013;36:561–569. doi: 10.1016/j.tins.2013.06.007. - DOI - PMC - PubMed
    1. Raj A, Kuceyeski A, Weiner M. A network diffusion model of disease progression in dementia. Neuron. 2012;73:1204–1215. doi: 10.1016/j.neuron.2011.12.040. - DOI - PMC - PubMed

Publication types