

Characterization of gene expression profiles in the mouse brain after 35 days of spaceflight mission
- PMID: 35948598
- PMCID: PMC9365836
- DOI: 10.1038/s41526-022-00217-4
Characterization of gene expression profiles in the mouse brain after 35 days of spaceflight mission
Abstract
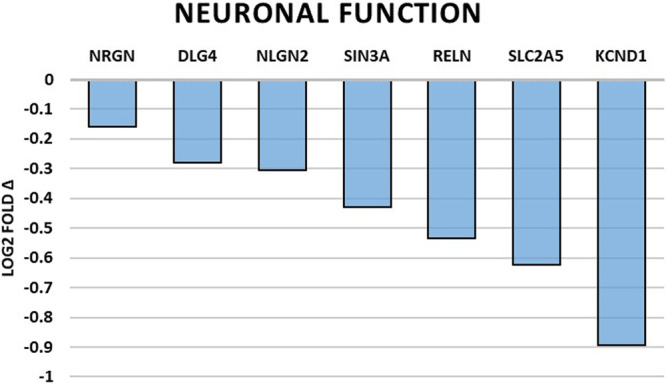
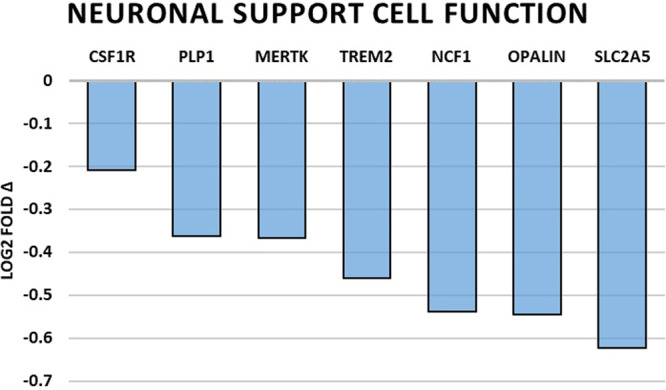
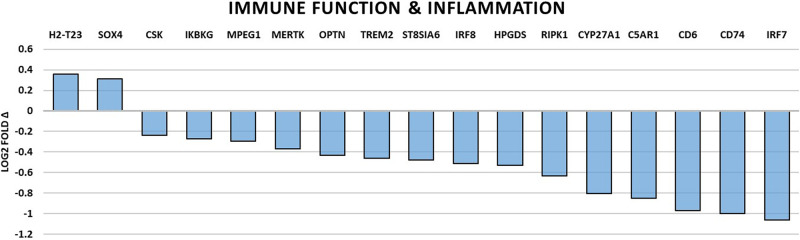
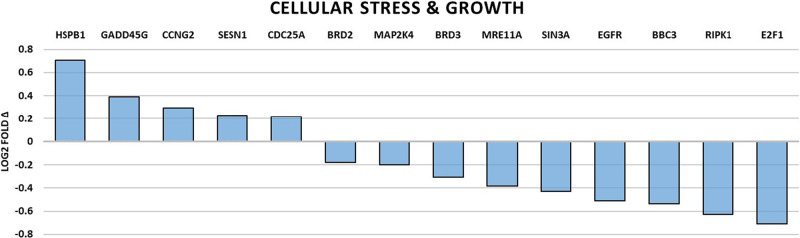
It has been proposed that neuroinflammatory response plays an important role in the neurovascular remodeling in the brain after stress. The goal of the present study was to characterize changes in the gene expression profiles associated with neuroinflammation, neuronal function, metabolism and stress in mouse brain tissue. Ten-week old male C57BL/6 mice were launched to the International Space Station (ISS) on SpaceX-12 for a 35-day mission. Within 38 ± 4 h of splashdown, mice were returned to Earth alive. Brain tissues were collected for analysis. A novel digital color-coded barcode counting technology (NanoStringTM) was used to evaluate gene expression profiles in the spaceflight mouse brain. A set of 54 differently expressed genes (p < 0.05) significantly segregates the habitat ground control (GC) group from flight (FLT) group. Many pathways associated with cellular stress, inflammation, apoptosis, and metabolism were significantly altered by flight conditions. A decrease in the expression of genes important for oligodendrocyte differentiation and myelin sheath maintenance was observed. Moreover, mRNA expression of many genes related to anti-viral signaling, reactive oxygen species (ROS) generation, and bacterial immune response were significantly downregulated. Here we report that significantly altered immune reactions may be closely associated with spaceflight-induced stress responses and have an impact on the neuronal function.
© 2022. The Author(s).
Conflict of interest statement
The authors declare no competing interests.
Figures
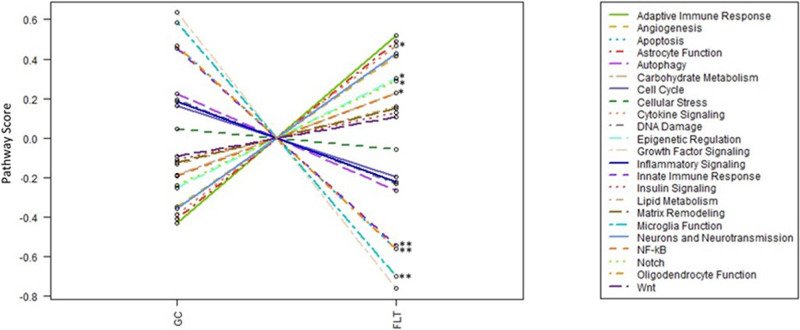
 cytokine signaling,
  Angiogenesis,
  Epigenetic regulation, and
  Notch. **Significantly (p < 0.05) or strong trend (p = 0.07) downregulated pathways, include:
  Oligodendrocyte function,
  Innate immune response, and
  Microglia function. p values are by one-way ANOVA and Tukey’s post hoc test. Source data are provided as a Source Data file.
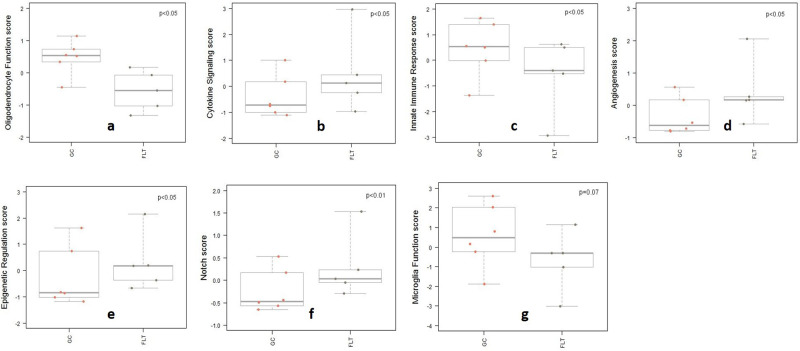
References
LinkOut - more resources
Full Text Sources
Molecular Biology Databases
Miscellaneous
