. 2022 Aug;608(7924):724-732.
doi: 10.1038/s41586-022-05072-7. Epub 2022 Aug 10.

Diverse mutational landscapes in human lymphocytes

Affiliations

Diverse mutational landscapes in human lymphocytes

Heather E Machado et al. Nature. 2022 Aug.

Abstract

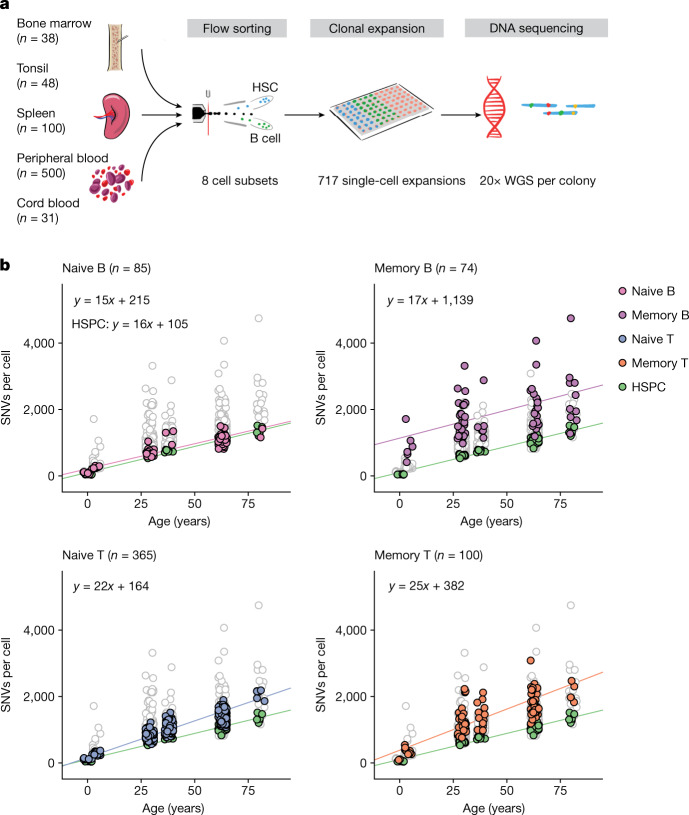
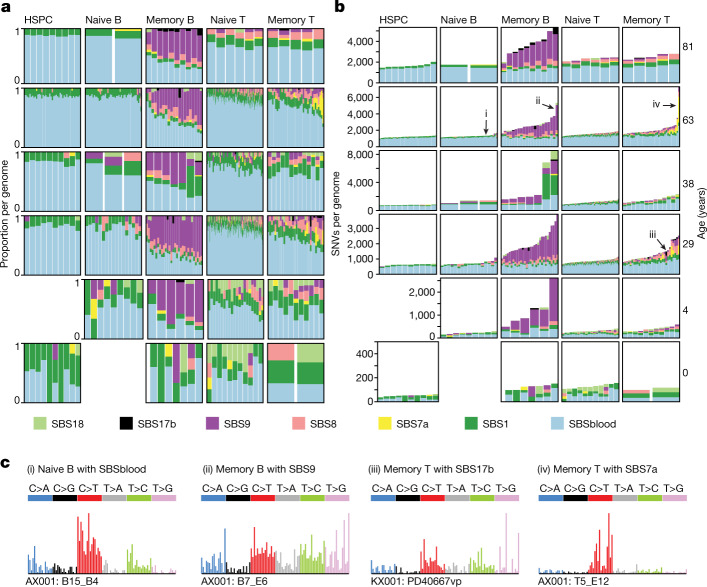
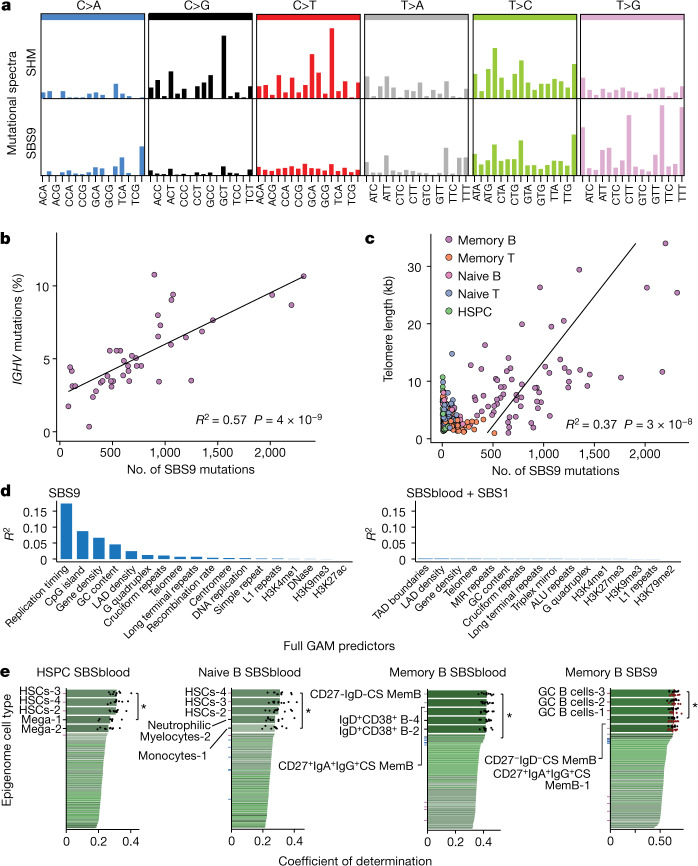
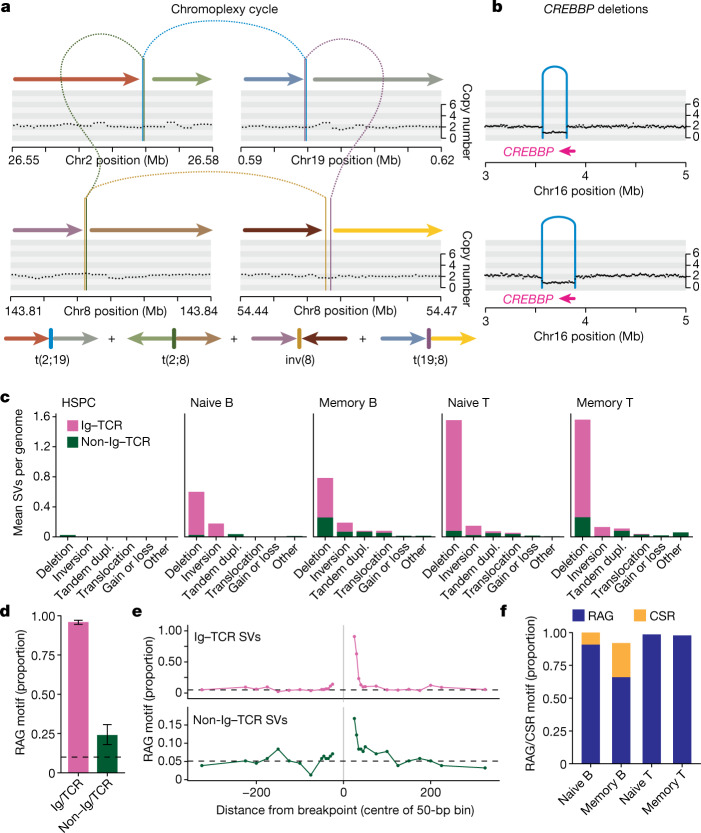
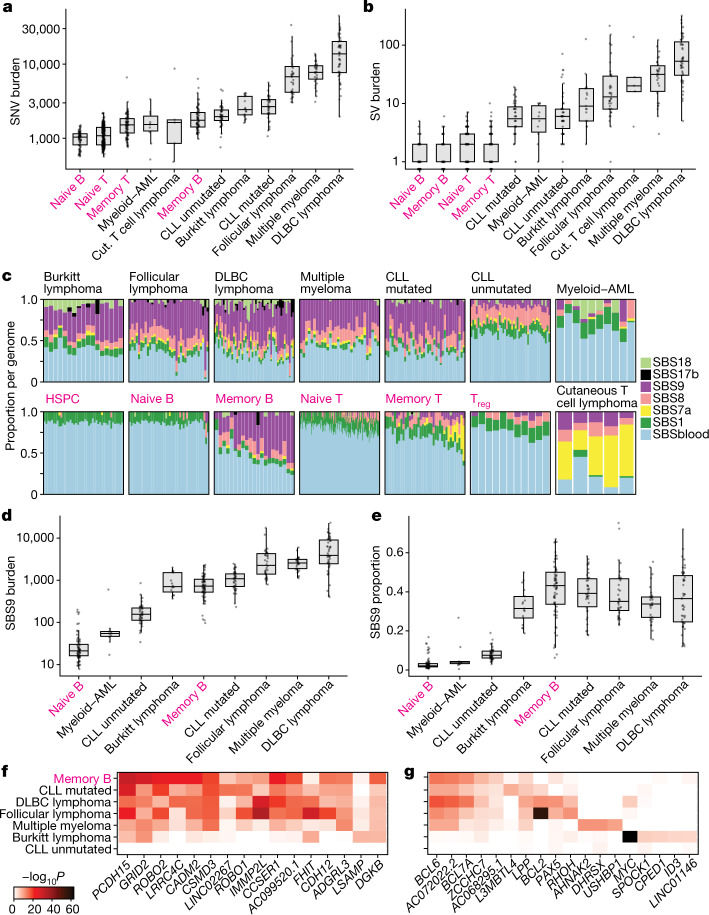
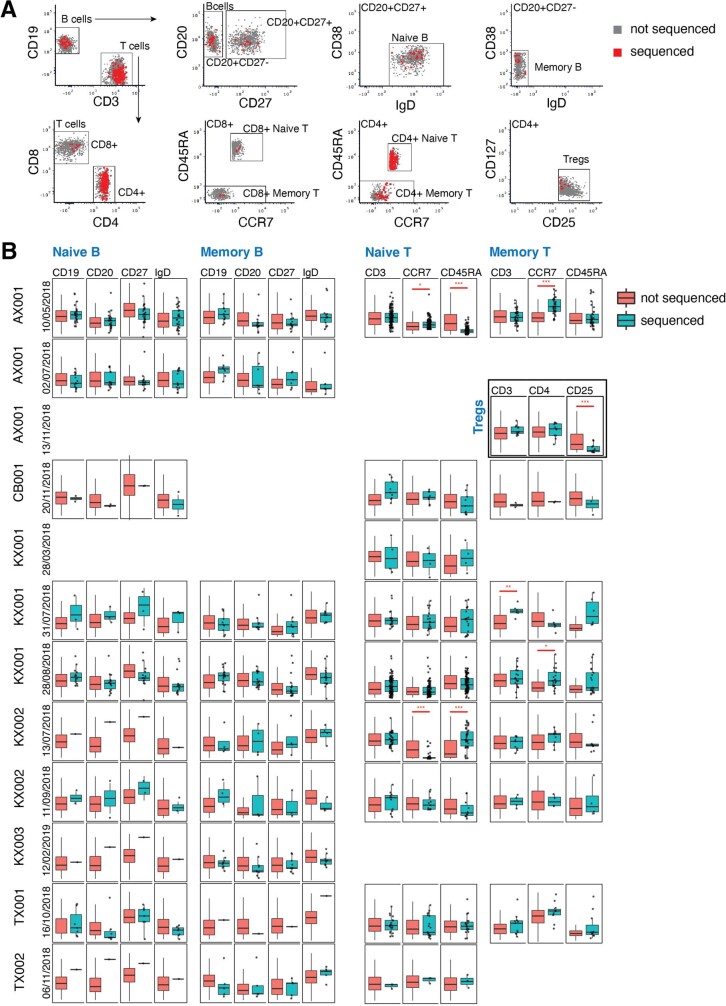
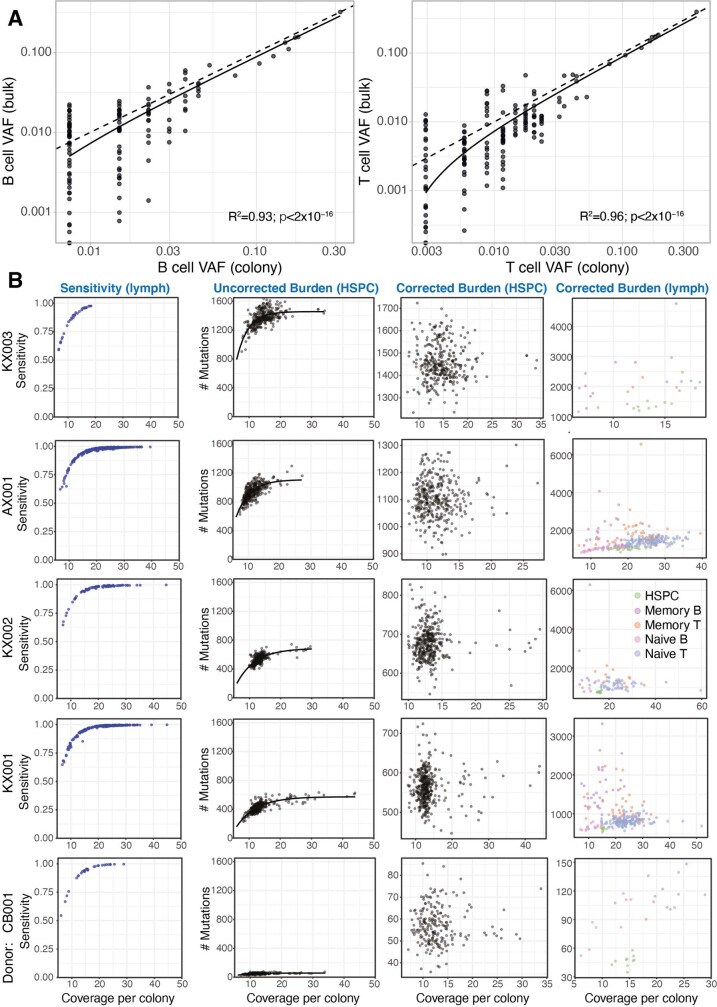
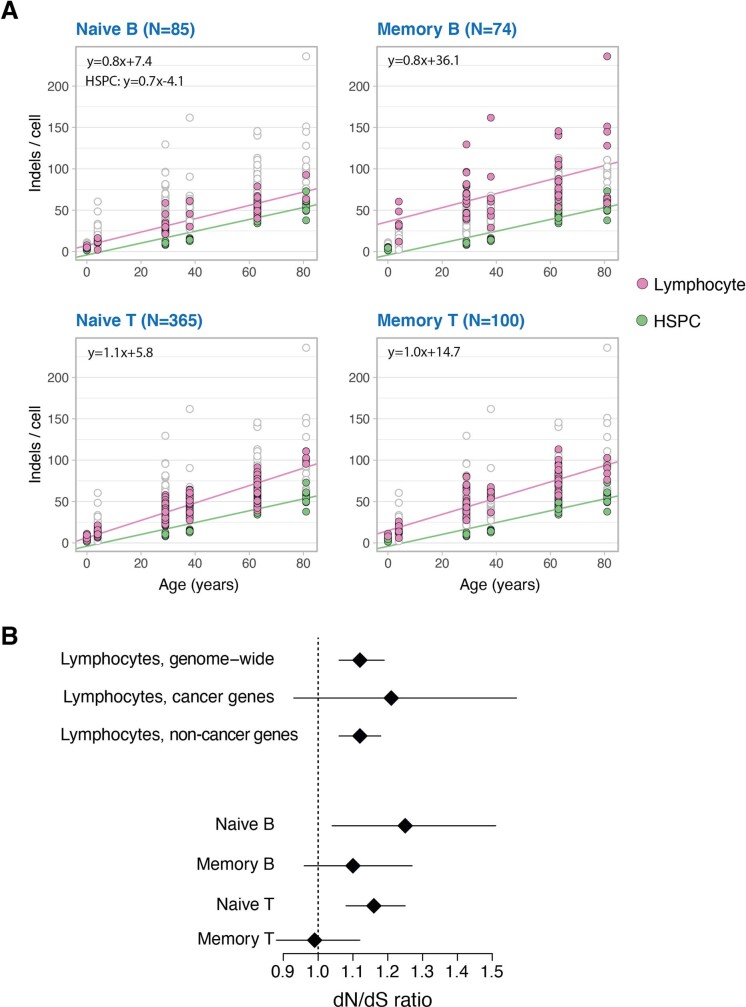
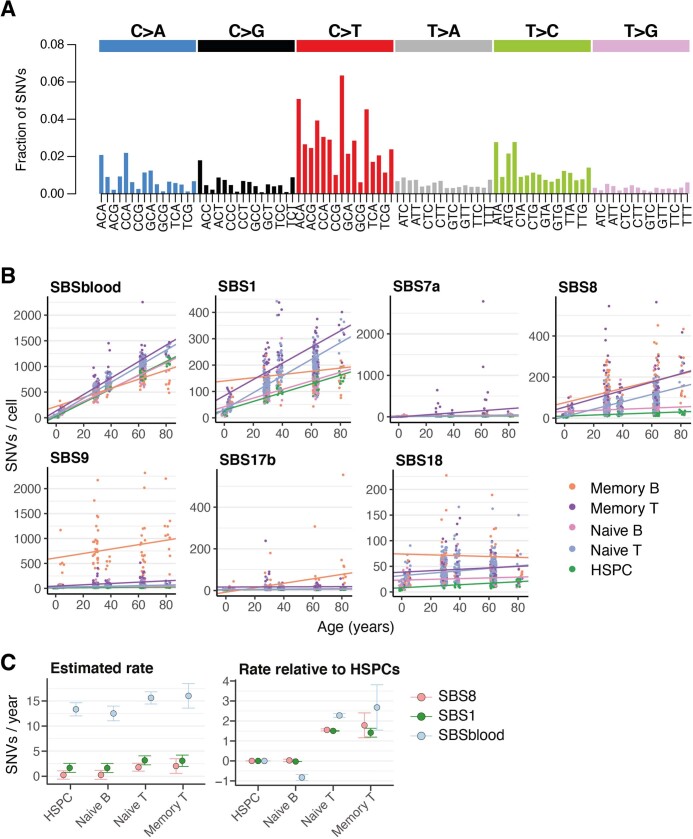
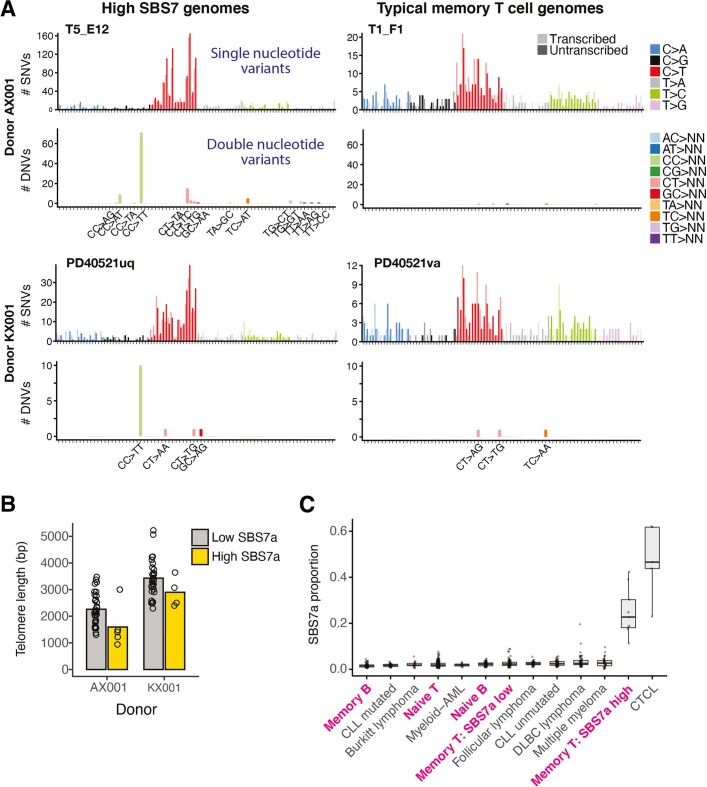
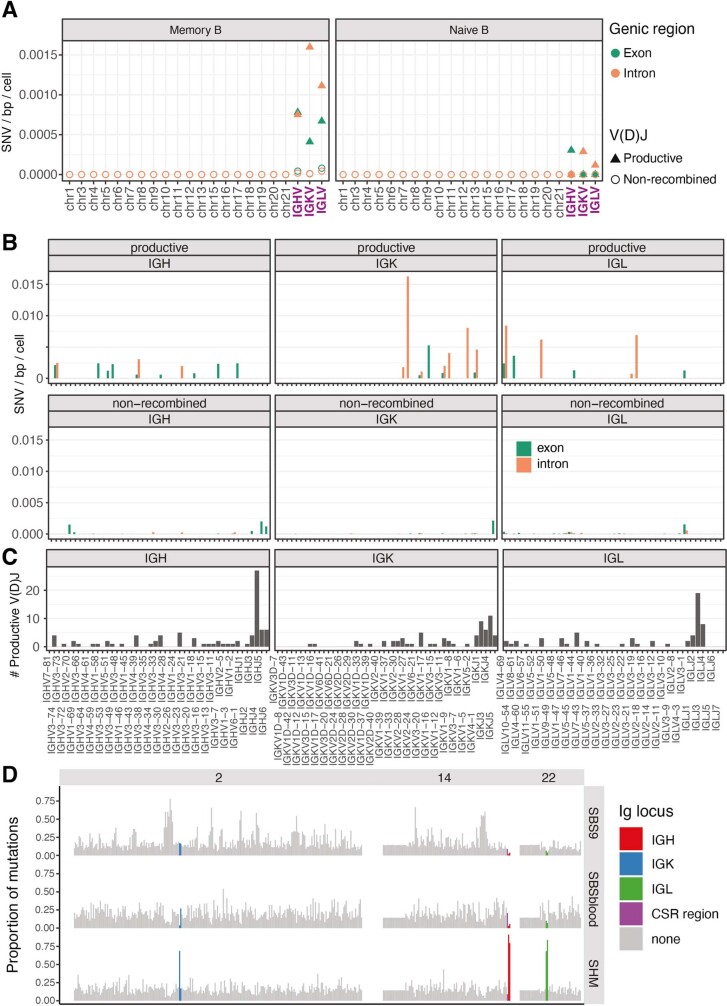
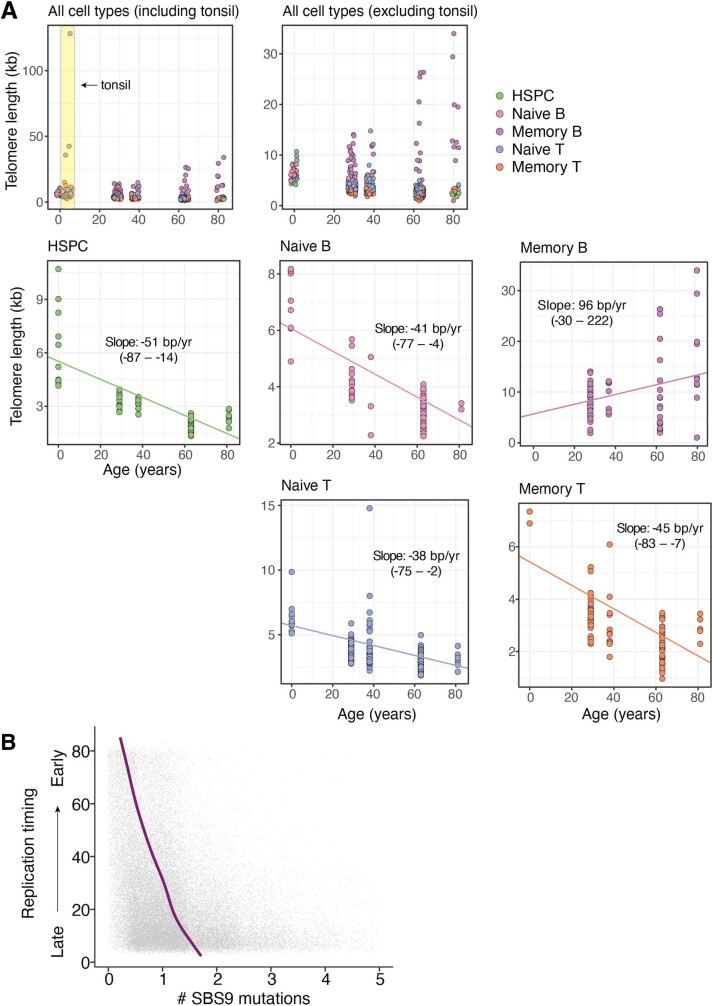
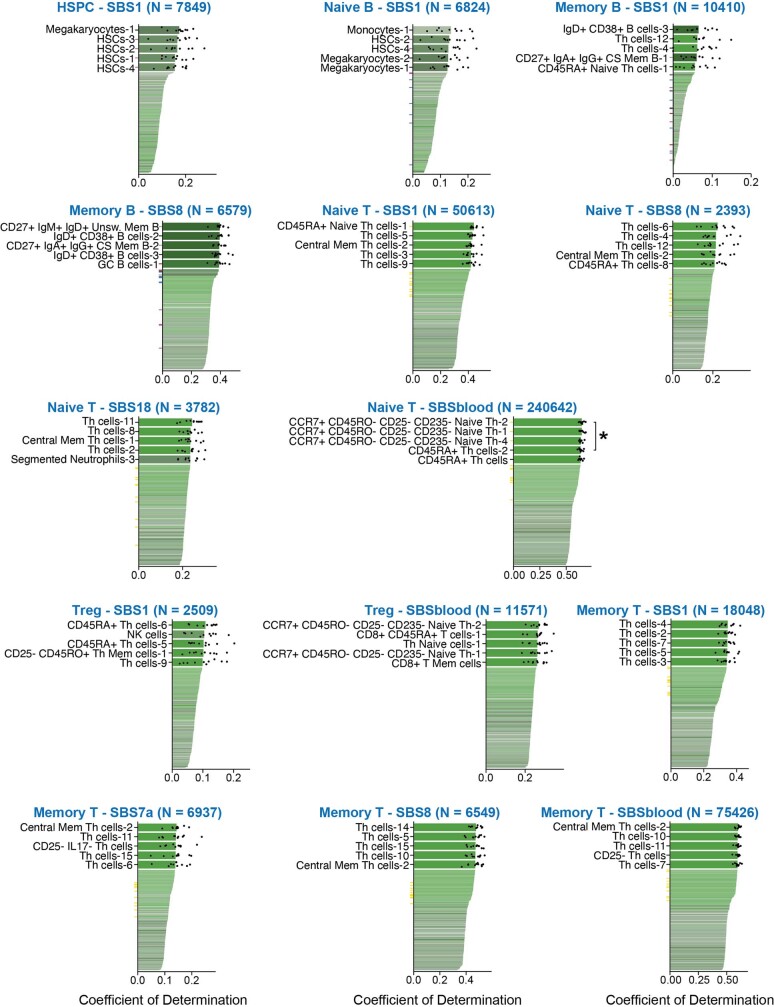
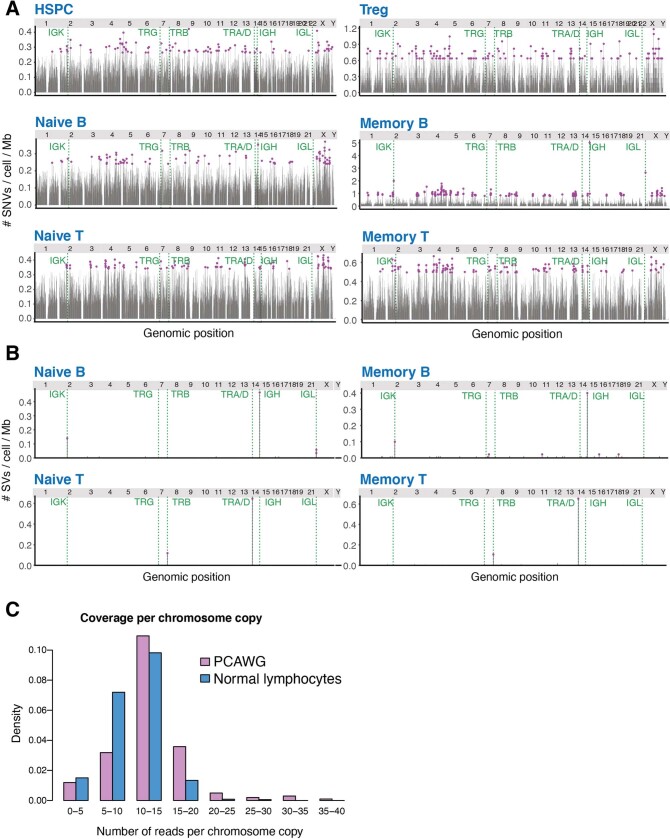
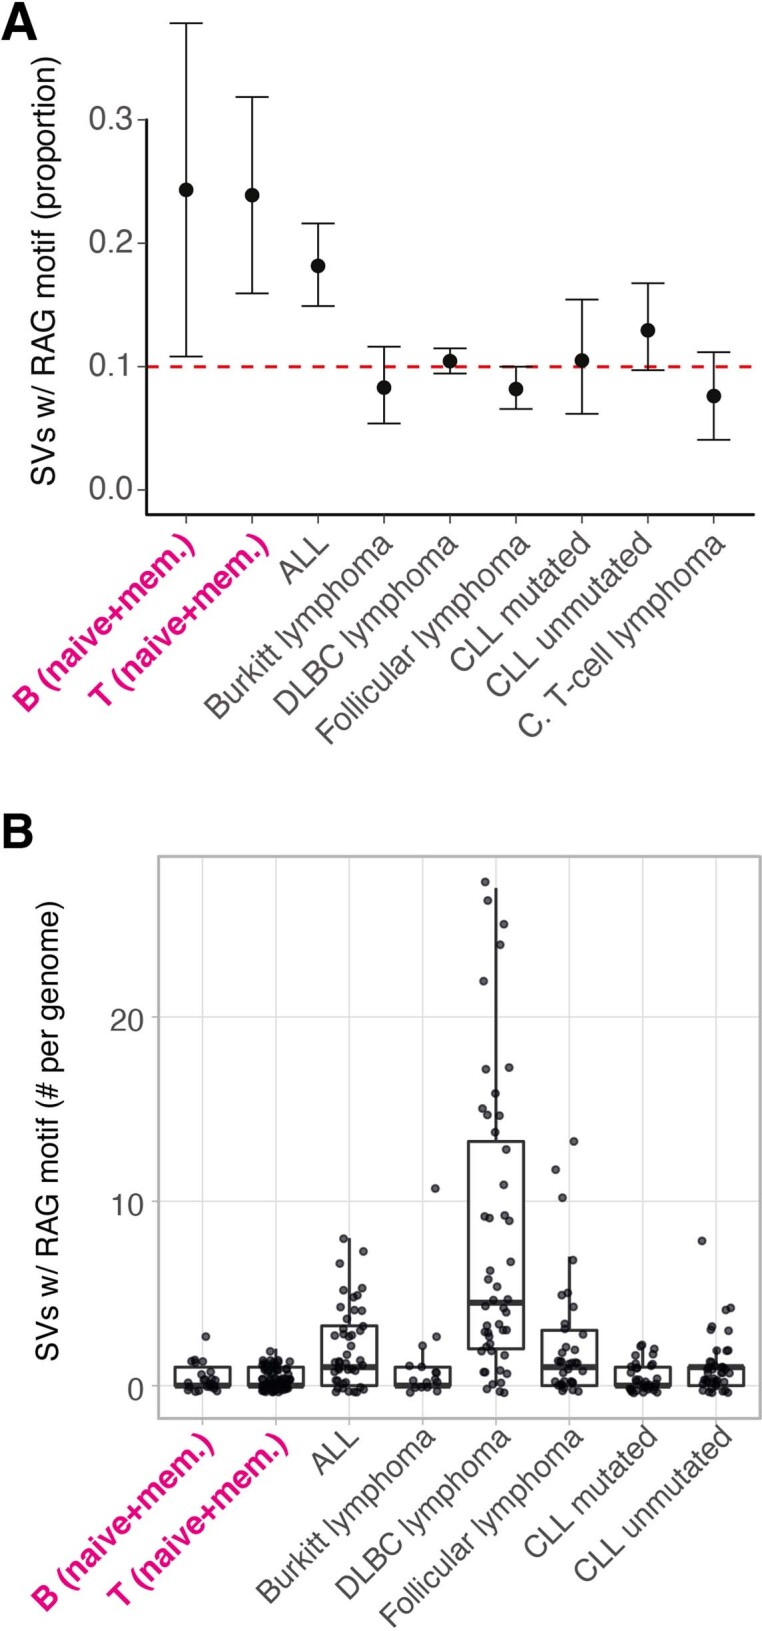
The lymphocyte genome is prone to many threats, including programmed mutation during differentiation1, antigen-driven proliferation and residency in diverse microenvironments. Here, after developing protocols for expansion of single-cell lymphocyte cultures, we sequenced whole genomes from 717 normal naive and memory B and T cells and haematopoietic stem cells. All lymphocyte subsets carried more point mutations and structural variants than haematopoietic stem cells, with higher burdens in memory cells than in naive cells, and with T cells accumulating mutations at a higher rate throughout life. Off-target effects of immunological diversification accounted for approximately half of the additional differentiation-associated mutations in lymphocytes. Memory B cells acquired, on average, 18 off-target mutations genome-wide for every on-target IGHV mutation during the germinal centre reaction. Structural variation was 16-fold higher in lymphocytes than in stem cells, with around 15% of deletions being attributable to off-target recombinase-activating gene activity. DNA damage from ultraviolet light exposure and other sporadic mutational processes generated hundreds to thousands of mutations in some memory cells. The mutation burden and signatures of normal B cells were broadly similar to those seen in many B-cell cancers, suggesting that malignant transformation of lymphocytes arises from the same mutational processes that are active across normal ontogeny. The mutational landscape of normal lymphocytes chronicles the off-target effects of programmed genome engineering during immunological diversification and the consequences of differentiation, proliferation and residency in diverse microenvironments.


Conflict of interest statement

G.G. receives research funds from Pharmacyclics and IBM. G.G. is an inventor on multiple patents related to bioinformatics methods (MuTect, MutSig, ABSOLUTE, MSMutSig, MSMuTect, POLYSOLVER and TensorQTL). G.G. is a founder, consultant and holds privately held equity in Scorpion Therapeutics. D.J.H. receives research funding from AstraZeneca and D.G.K. receives research funding from STRM.bio. All other authors declare no competing interests.

Figures

Fig. 1
Fig. 1. Experimental design and lymphocyte mutation burden with age.
a, Schematic of the experimental design. WGS, whole-genome sequencing. b, SNV mutation burden per genome for the four main lymphocyte subsets, compared with HSPCs (green points). Each panel shows data for HSPCs and the indicated cell type in colour, with the other three lymphocyte subsets plotted in white with grey outline. The lines show the fit for the indicated cell type using linear mixed-effects models.
Fig. 2
Fig. 2. Mutational processes in lymphocytes.
a,b, The proportion of SNVs (a) and SNV burden (b) per mutational signature in the different cell types. Each column represents one genome. For each genome, signatures with a 90% posterior interval lower bound of less than 1% are excluded. c, Mutational spectra of genomes of colonies derived from single cells enriched in the specified mutational signature. The specific genome plotted is numbered in b. Trinucleotide contexts on the x-axis represent 16 bars within each substitution class, divided into 4 sets of 4 bars, grouped by the nucleotide 5′ to the mutated base, and within each group by the 3′ nucleotide (in the order A, C, G, T).
Fig. 3
Fig. 3. Correlation of SBS9 with genomic attributes and timing of mutational processes.
a, Mutational spectra of the SBS9 and SHM signatures. Trinucleotide contexts on the x-axis represent 16 bars within each substitution class, divided into 4 sets of 4 bars, grouped by the nucleotide 5′ to the mutated base, and within each group by the 3′ nucleotide. The y-axis shows the number of mutations in each class. b, The number of SBS9 mutations genome-wide and the percentage of bases in IGHV that are mutated in the productive rearrangement of memory B cells. The line represents the linear regression estimate of the correlation. c, Number of SBS9 mutations versus telomere length per genome, coloured by cell type. The regression line is for memory B cells. d, Explanatory power of each significant genomic feature in the generalized additive model (GAM), expressed as the R2 of the individual GAM for predicting number of SBS9 mutations (left) or number of SBSblood or SBS1 mutations (right) per 10-kb window. LAD, lamina-associated domain. e, Performance of prediction of genome-wide mutational distribution attributable to particular mutational signatures from histone marks of 149 epigenomes representing distinct blood cell types and different phases of development (numbers after cell types on y-axis indicate replicates); ticks are coloured according to the epigenetic cell type (purple, HSC; blue, naive B cell; grey, memory B cell; maroon, GC B cell); black points depict values from tenfold cross-validation; P-values for comparison of the tenfold cross-validation values by two-sided Wilcoxon test. CS, class switched; GC, germinal centre; HSC, hematopoietic stem cell; Mem, memory; Mega, megakaryocyte.
Fig. 4
Fig. 4. Structural variation burden and off-target RAG-mediated deletion.
a, Top, chromoplexy cycle (sample PD40667sl, donor KX002). Black points represent the corrected read depth along the chromosome and arcs denote structural variants. Bottom, the final genomic configuration of the four derivative chromosomes is shown as coloured arrows. b, CREBBP deletions (samples PD40521po, donor KX001 and BMH1_PlateB1_E2, donor AX001). c, Burden of structural variants per cell type. Dupl., duplication. d, The proportion of deletions with an RSS (RAG) motif within 50 bp of the breakpoint for Ig–TCR (0.96) and non-Ig–TCR (0.24) regions. The black dashed line represents the genomic background rate of RAG motifs. Error bars represent 95% bootstrap confidence intervals. n = 889 Ig–TCR structural variants and 253 non-Ig–TCR structural variants. e, Proportion of deletions with an RSS (RAG) motif as a function of distance from the breakpoint, with a positive distance representing bases interior to the deletion, and a negative value representing bases exterior to the breakpoint. The black dashed line represents the genomic background rate of RAG motifs. f, The proportion of deletions with an RSS (RAG) or switch (CSR) motif.
Fig. 5
Fig. 5. Comparison of mutational patterns with malignancy.
a,b, SNV (a) and structural variation (SV) burden (b) by normal cell type or malignancy. The box shows the interquartile range and the centre line shows the median. Whiskers extend to the minimum of either the range or 1.5× the interquartile range. Normal lymphocytes (magenta) exclude paediatric samples. AML, acute myeloid leukaemia; CLL, chronic lymphocytic leukaemia; Cut, cutaneous; DLBC, diffuse large B cell. c, The proportion of mutational signatures per genome. For each genome, signatures with a 90% confidence interval lower bound of less than 1% are excluded. Normal lymphocytes (labelled in magenta) are from donor AX001. Treg, T regulatory cells. d,e, SBS9 burden (d) and proportion (e) by cell type or malignancy. The box shows the interquartile range and the centre line shows the median. Whiskers extend to the minimum of either the range or 1.5× the interquartile range. f,g, Heat map showing the level of enrichment of SBS9 (f) and SHM (g) signatures near frequently mutated genes for that signature compared with the whole genome. Number of structural variants per group: B cell: 145, T cell: 841, ALL: 523, Burkitt lymphoma: 305, CLL mutated: 252, CLL unmutated: 440, cutaneous T cell lymphoma: 204, DLBC lymphoma: 3,754, follicular lymphoma: 1,095. a,b,d,e, Number of genomes per group: naive B: 68, memory B: 68, naive T: 332, memory T: 87, Burkitt lymphoma: 17, CLL mutated: 38, CLL unmutated: 45, cutaneous T cell lymphoma: 5, DLBC lymphoma: 47, follicular lymphoma: 36, multiple myeloma: 30, myeloid–AML: 10.
Extended Data Fig. 1
Extended Data Fig. 1. Assessment of culture bias by index flow-sorting.
(A) Representative scatterplots of cell surface marker fluorescence intensity measured by flow cytometry (sort AX001 10/05/2018; AX001 13/11/2018 for Treg gate). Cells that successfully seeded colonies are coloured red; cells that did not form colonies are coloured grey. (B) Box-and-whisker plots showing fluorescence intensity for different cell surface markers in the various lymphocyte populations (columns) across different patients and days of flow-sorting (rows). Cells that successfully seeded colonies are shown in teal; cells that did not form colonies in orange. Boxes show the interquartile range and the centre horizontal lines show the median. Whiskers extend to the minimum of either the range or 1.5× the interquartile range. Red asterisks show a statistically significant difference between the fluorescence values of colony forming versus non-colony forming cells (two-sided t-test, false-discovery rate *q < 0.05, **q < 0.01, ***q < 0.001, P-values in Table S10). The number of colony and non-colony forming cells per sort per subset can be found in Table S1.
Extended Data Fig. 2
Extended Data Fig. 2. Clonal bias and sensitivity correction.
(A) To assess clone-to-clone biases in successfully seeded colonies, we reanalysed deep targeted resequencing data of bulk B and T cell lymphocytes from AX001. The figure shows scatterplots of the fraction of lymphocyte colonies reporting a given somatic mutation (x-axis; log scale) with the variant allele fraction of that mutation in the bulk resequencing data (y-axis; log scale). Dashed lines are x = y equality and solid lines show the linear regression fit (B cells, R2 = 0.47, P = 1x10⁻¹⁸; T cells, R2 = 0.59, P = 2x10⁻³¹). (B) Estimates of sensitivity for mutation calling as a function of depth for each colony (points in left panels) from each donor (rows; the 5 donors with the highest numbers of colonies are shown). The second column of panels shows uncorrected estimates of mutation burden for HSPCs in each donor, while the third column shows mutation burden estimates after correction for sequencing depth by asymptotic regression. The fourth column shows the corrected mutation burdens for lymphocyte colonies.
Extended Data Fig. 3
Extended Data Fig. 3. Indels and selection pressure.
(A) Indel mutation burden per genome for the four main lymphocyte subsets (pink points), compared with HSPCs (green points). Each panel has all genomes plotted underneath in white with grey outline. The lines show the fit by linear mixed effects models for the respective populations. (B) Plots of the estimated dN/dS ratio for mutations genome-wide (excluding immunoglobulin genes) for all lymphocytes, and for the various individual lymphocyte populations. The second row shows the estimated dN/dS ratio for known cancer genes in all lymphocytes. The diamond shows the point estimates, and the lines the 95% confidence intervals. The point estimates / number of variants included in each analysis are as follows: lymphocytes, genome-wide = 1.12 / 7555; lymphocytes, cancer genes = 1.21 / 352; naive B = 1.25 / 671; memory B = 1.10 / 1132; naive T = 1.16 / 4162; memory T = 0.99 / 1414.
Extended Data Fig. 4
Extended Data Fig. 4. Mutational signatures by age.
(A) SBSblood signature identified using HSPC genomes and the program sigfit. Trinucleotide contexts on the x-axis represent 16 bars within each substitution class, divided into 4 sets of 4 bars, grouped by the nucleotide 5′ to the mutated base, and within each group by the 3′ nucleotide. (B) SNV mutation burden per genome, shown separately for each mutational signature. The lines show the fit by linear mixed effects models for the respective populations. Two outlier cells (PD40667vu and PD40667rx) are excluded from plotting. (C) The rate of mutation accumulation per year (slopes in B) for signatures with strong age effects. Error bars represent the 95% confidence intervals on the slope from the linear mixed effects models.
Extended Data Fig. 5
Extended Data Fig. 5. Ultraviolet light mutational signature (SBS7a) in lymphocytes.
(A) Raw mutational spectra shown for all mutation calls from four lymphocyte colonies, two with high contribution of SBS7a (left) and two with a more typical T-cell spectrum (right) from two different donors (rows). For each cell, the top panel shows the SNV spectrum, with trinucleotide contexts on the x-axis representing 16 bars within each substitution class, divided into 4 sets of 4 bars, grouped by the nucleotide 5′ to the mutated base, and within each group by the 3′ nucleotide. The bottom panel shows frequency of dinucleotide substitutions. (B) Telomere lengths for memory T cells with (yellow) and without (grey) high SBS7a signature. A memory T cell with high UV signature is defined as having greater than 9.5% (2 standard deviations above the mean) of its mutations attributable to SBS7a. (C) Proportion of mutations attributable to SBS7a across normal lymphocytes (paediatric samples excluded) and lymphoid malignancies. Boxes show the interquartile range and the centre horizontal lines show the median. Whiskers extend to the minimum of either the range or 1.5× the interquartile range. Number of genomes included per group: naive B: 68, memory B: 68, naive T: 332, memory T SBS7a low: 78, memory T SBS7a high: 9, Burkitt lymphoma: 17, CLL (chronic lymphocytic leukaemia) mutated: 38, CLL unmutated: 45, C. (cutaneous) T-cell lymphoma: 5, DLBC (Diffuse Large B-cell) lymphoma: 47, follicular lymphoma: 36, multiple myeloma: 30, myeloid-AML (acute myeloid leukaemia): 10.
Extended Data Fig. 6
Extended Data Fig. 6. Distribution of mutational signatures across the genome.
(A) Estimates of the mutation rate across non-Ig chromosomes and Ig regions for memory (left) and naive B (right) cells. Rates for the Ig regions are calculated separately for the productive (triangles) and non-recombined alleles (circles) and exons (green) versus introns (orange). (B) Estimated mutation rates across different variable segments of the Ig genes for exons (green) versus introns (orange). (C) Number of productive V(D)J rearrangements affecting each variable segment in the dataset. (D) Proportion of mutations across chromosomes 2, 14 and 22 in each 1Mb window attributed to signatures SBS9, SBSblood and the canonical somatic hypermutation (SHM) signature (rows). Windows spanning the relevant immunoglobulin regions are coloured according to the key.
Extended Data Fig. 7
Extended Data Fig. 7. Telomere lengths and SBS9 versus replication timing.
(A) The top left panel includes the tonsil-derived genomes, which have an exceptionally high variance in telomere length. The remaining panels exclude these genomes, and show the estimated telomere lengths (y-axis) for each cell as a function of age (x-axis). Lines show the estimated fit by linear mixed effects models for each cell type, with the slope and 95% confidence intervals quoted in text. (B) Replication timing and number of SBS9 mutations per 10kb window. The line represents the GAM regression prediction. The x-axis is truncated at 5, excluding 0.3% of the data, and points have random noise (−0.5 to 0.5) to facilitate visualization.
Extended Data Fig. 8
Extended Data Fig. 8. Relationships of signatures to epigenetic marks across haematopoietic cell types.
Performance of prediction of genome-wide mutational profiles attributable to particular mutational signatures from histone marks of 149 epigenomes representing distinct blood cell types and different phases of development (subscripts indicate replicates); ticks are coloured according to the epigenetic cell type (purple, HSC; blue, naive B cell; grey, memory B cell; maroon, GC B cell); black points depict values from ten-fold cross validation; P-values were obtained for the comparison of the 10-fold cross validation values using the two-sided Wilcoxon test (CS, class switched; GC, germinal centre; HSC, hematopoietic stem cell; Mem, memory).
Extended Data Fig. 9
Extended Data Fig. 9. SV density and patterns in normal and malignant lymphocytes.
(A-B) Mutation rates per 1Mb bin across the genome for SNVs (A) and structural variants (B) split by cell type, with chromosomes labelled in the top strip, and Ig/TCR regions marked. Circles (purple) denote bins with more mutations than 2 standard deviations above the mean. (C) Histogram showing the distribution of estimated number of reads per informative chromosome copy for the normal lymphocytes (blue) and lymphoid malignancies from PCAWG (purple). For cancer genomes, purity and ploidy were estimated from the copy number patterns; for lymphocyte colonies, the purity was 1 and ploidy was 2.
Extended Data Fig. 10
Extended Data Fig. 10. RAG-mediated SVs in normal versus malignant lymphocytes.
(A) Point estimates and 95% confidence intervals for the proportion of SVs with RSS (RAG) motifs within 50bp of a breakpoint. (B) Number of SVs with RSS (RAG) motifs within 50bp of a breakpoint. Boxes show the interquartile range and the centre horizontal lines show the median. Whiskers extend to the minimum of either the range or 1.5× the interquartile range. Paediatric samples were excluded. Number of SVs per group: B = 145, T = 841, ALL = 523, Burkitt lymphoma = 305, CLL mutated = 252, CLL unmutated = 440, C. T-cell lymphoma = 204, DLBC lymphoma = 3754, follicular lymphoma = 1095.

References

    1. Tarlinton D, Good-Jacobson K. Diversity among memory B cells: origin, consequences, and utility. Science. 2013;341:1205–1212. doi: 10.1126/science.1241146. - DOI - PubMed
    1. Mullighan CG, et al. Genomic analysis of the clonal origins of relapsed acute lymphoblastic leukemia. Science. 2008;322:1377–1380. doi: 10.1126/science.1164266. - DOI - PMC - PubMed
    1. Papaemmanuil E, et al. RAG-mediated recombination is the predominant driver of oncogenic rearrangement in ETV6–RUNX1 acute lymphoblastic leukemia. Nat. Genet. 2014;46:116–125. doi: 10.1038/ng.2874. - DOI - PMC - PubMed
    1. Pasqualucci L, et al. Hypermutation of multiple proto-oncogenes in B-cell diffuse large-cell lymphomas. Nature. 2001;412:341–346. doi: 10.1038/35085588. - DOI - PubMed
    1. Kasar S, et al. Whole-genome sequencing reveals activation-induced cytidine deaminase signatures during indolent chronic lymphocytic leukaemia evolution. Nat. Commun. 2015;6:8866. doi: 10.1038/ncomms9866. - DOI - PMC - PubMed

MeSH terms