Clinical Trial
. 2022 Aug;608(7923):609-617.
doi: 10.1038/s41586-022-05066-5. Epub 2022 Aug 10.

Truncated FGFR2 is a clinically actionable oncogene in multiple cancers

Affiliations
Clinical Trial

Truncated FGFR2 is a clinically actionable oncogene in multiple cancers

Daniel Zingg et al. Nature. 2022 Aug.

Erratum in

  • Publisher Correction: Truncated FGFR2 is a clinically actionable oncogene in multiple cancers.
    Zingg D, Bhin J, Yemelyanenko J, Kas SM, Rolfs F, Lutz C, Lee JK, Klarenbeek S, Silverman IM, Annunziato S, Chan CS, Piersma SR, Eijkman T, Badoux M, Gogola E, Siteur B, Sprengers J, de Klein B, de Goeij-de Haas RR, Riedlinger GM, Ke H, Madison R, Drenth AP, van der Burg E, Schut E, Henneman L, van Miltenburg MH, Proost N, Zhen H, Wientjens E, de Bruijn R, de Ruiter JR, Boon U, de Korte-Grimmerink R, van Gerwen B, Féliz L, Abou-Alfa GK, Ross JS, van de Ven M, Rottenberg S, Cuppen E, Chessex AV, Ali SM, Burn TC, Jimenez CR, Ganesan S, Wessels LFA, Jonkers J. Zingg D, et al. Nature. 2022 Sep;609(7929):E13. doi: 10.1038/s41586-022-05287-8. Nature. 2022. PMID: 36050473 Free PMC article. No abstract available.

Abstract

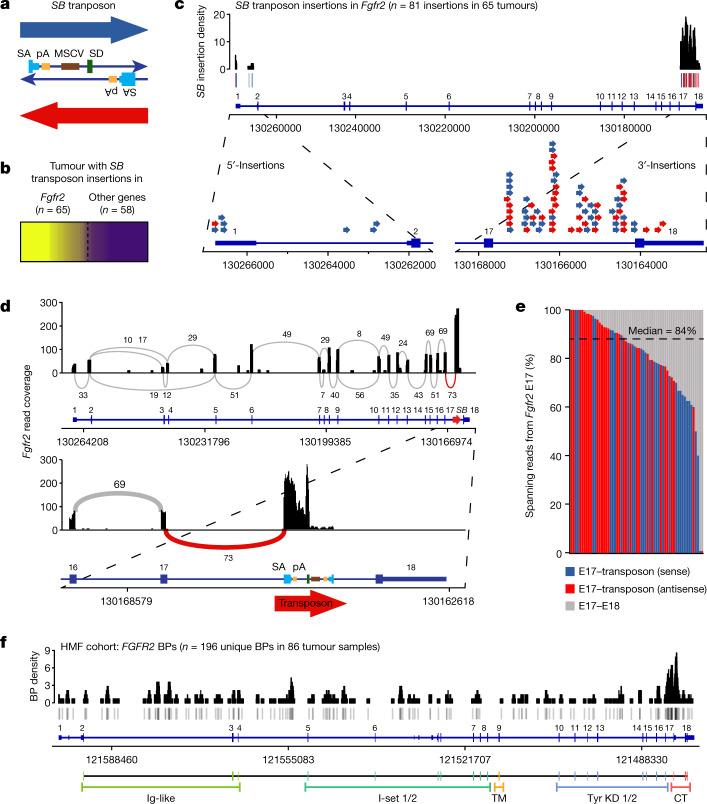
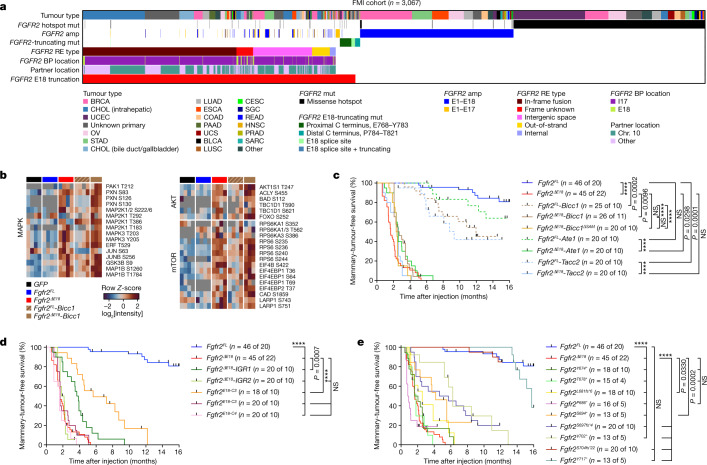
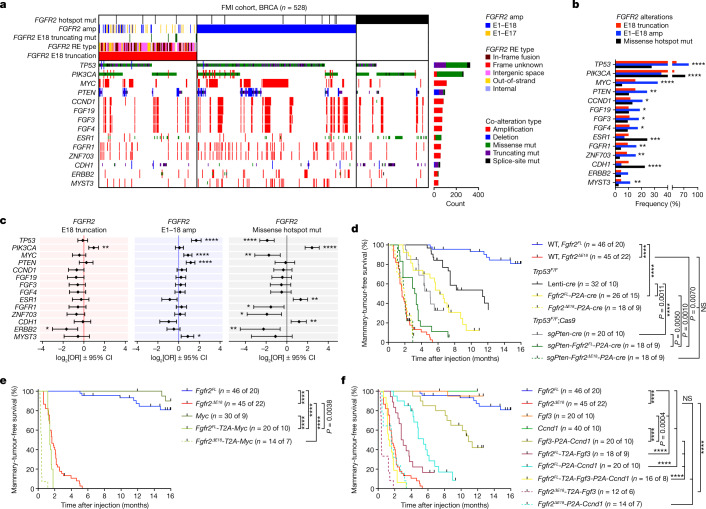
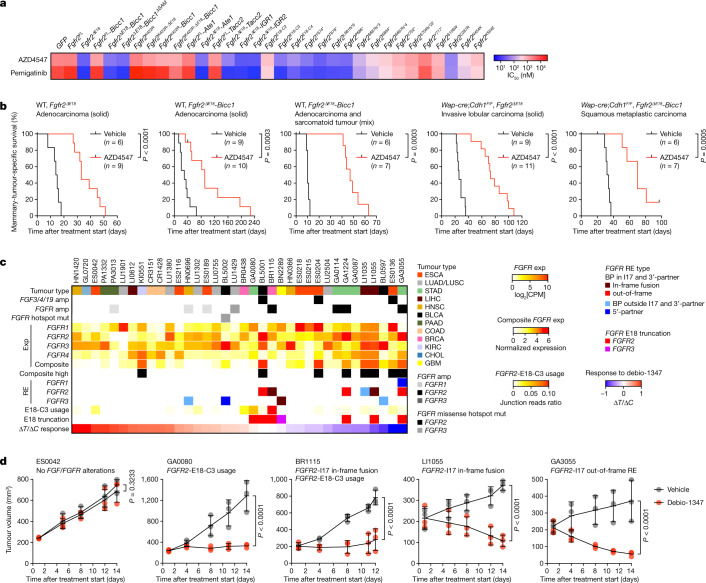
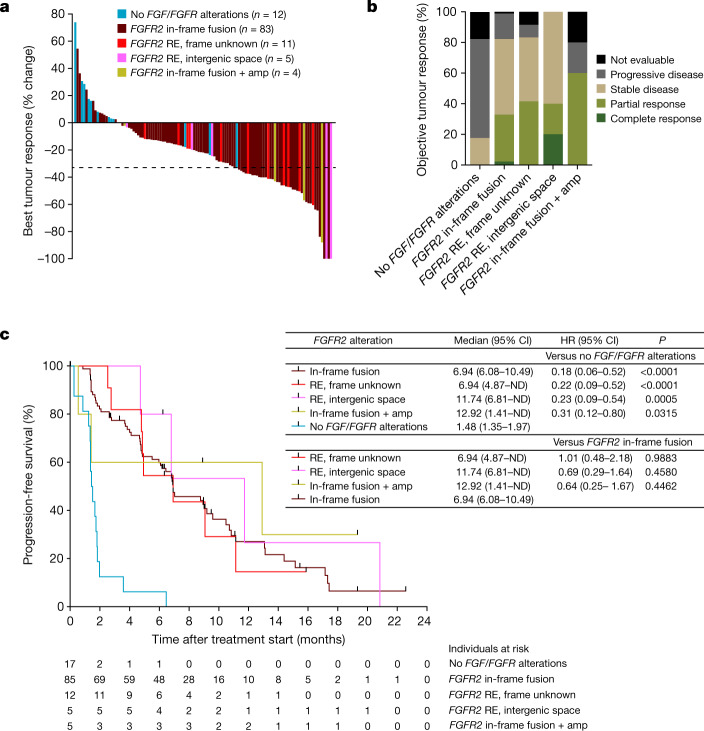
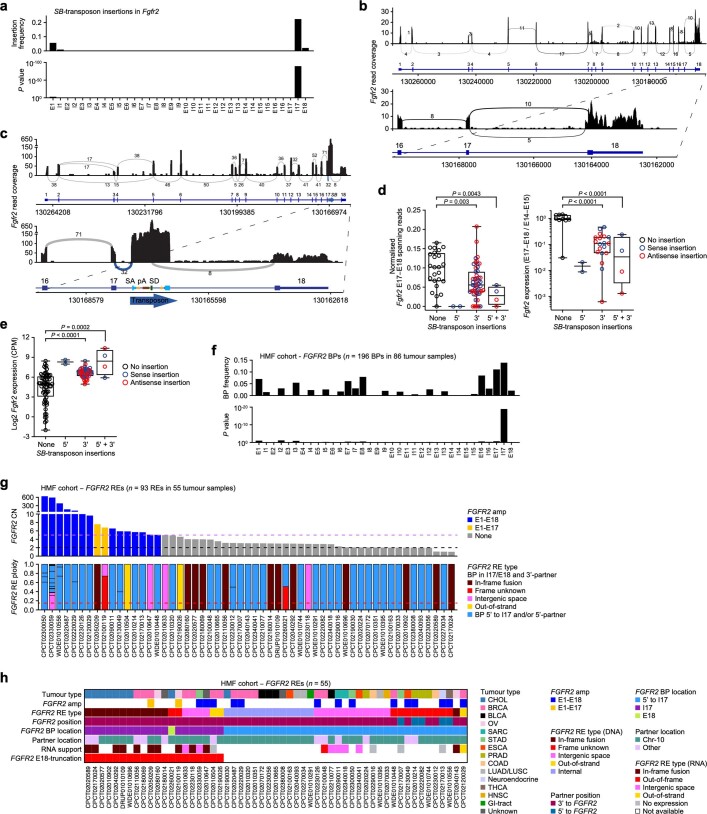
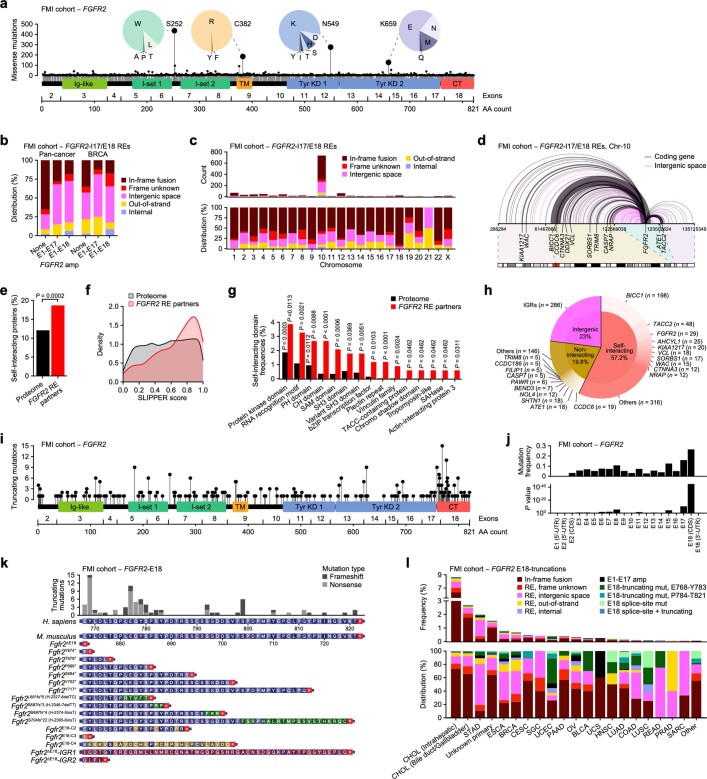
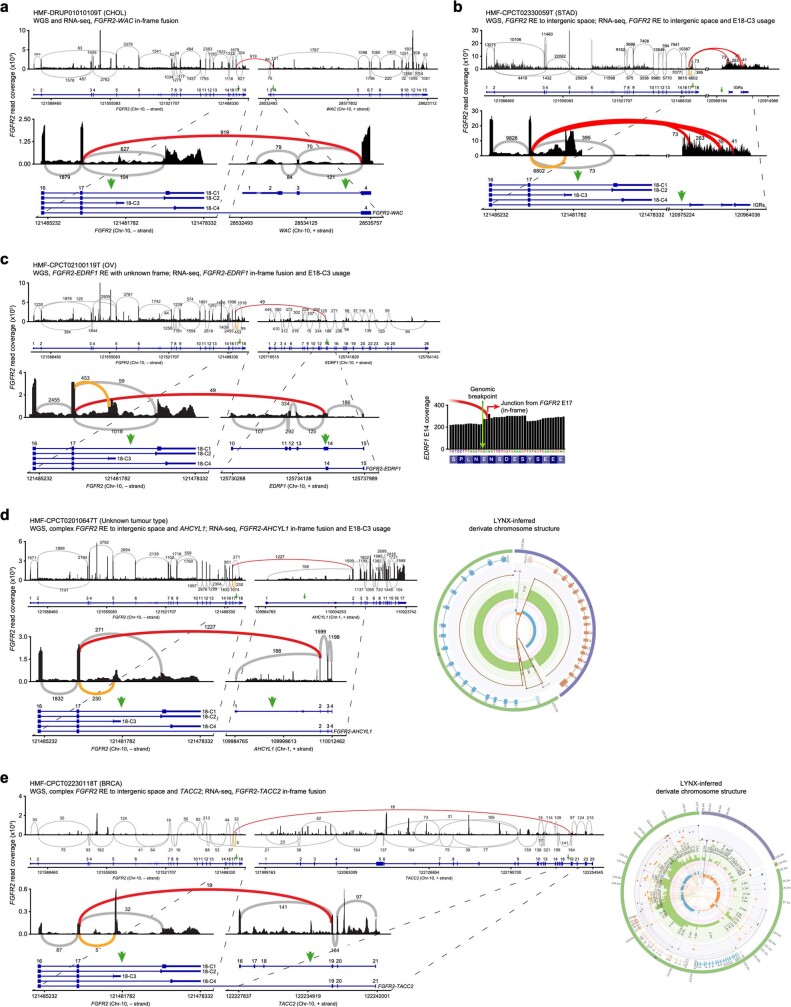
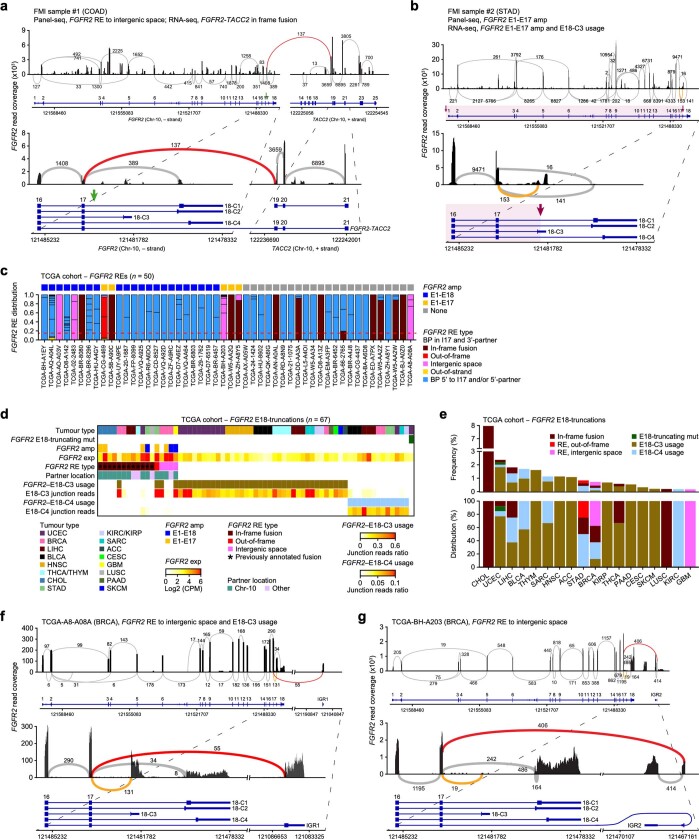
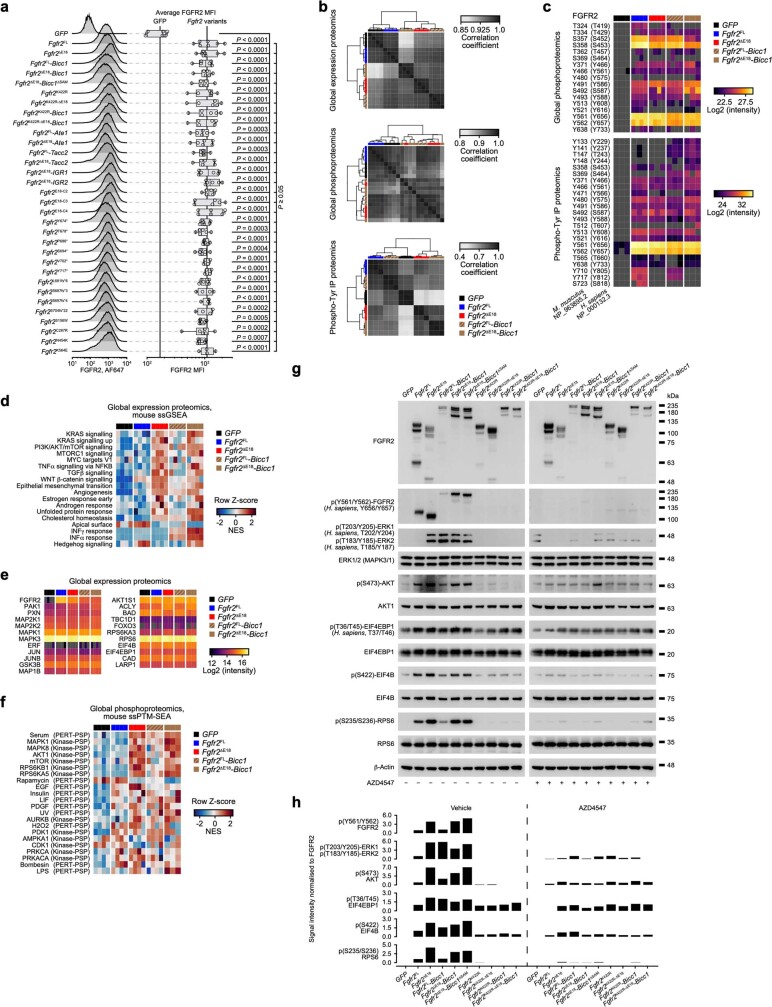
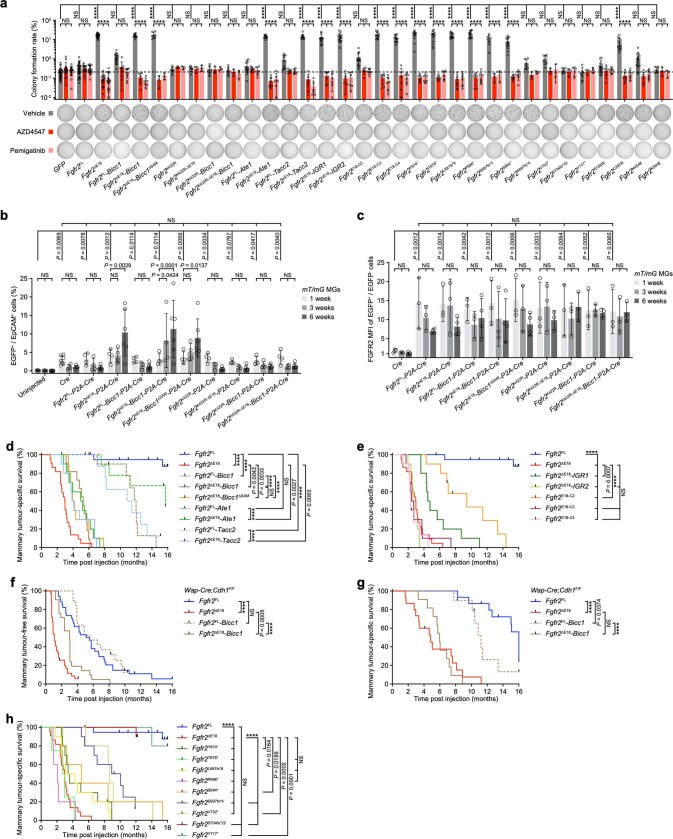
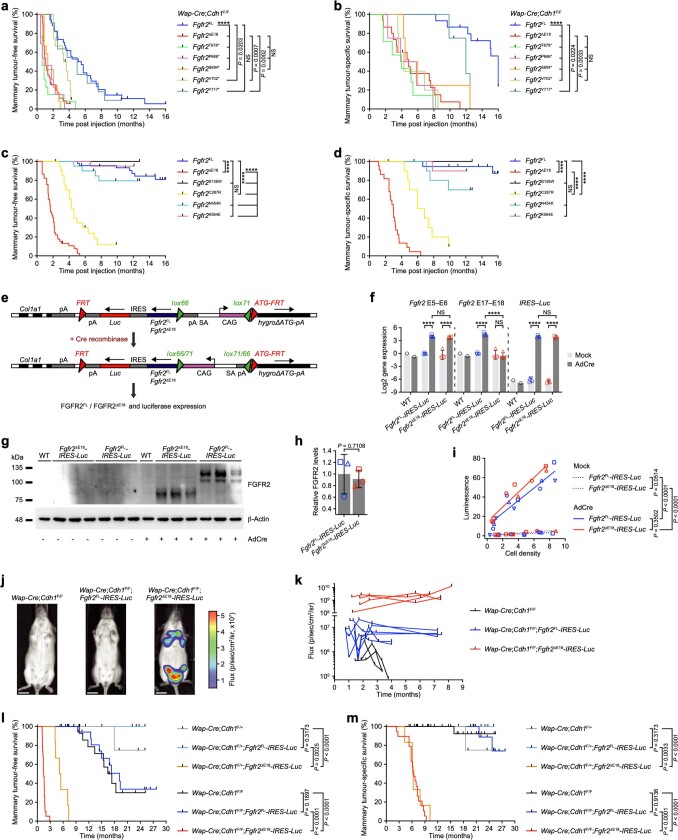
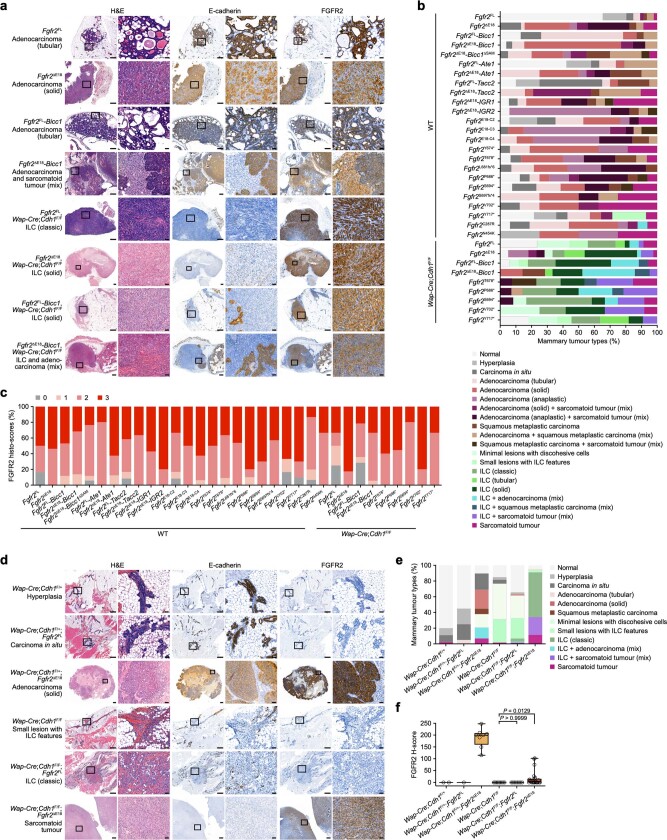
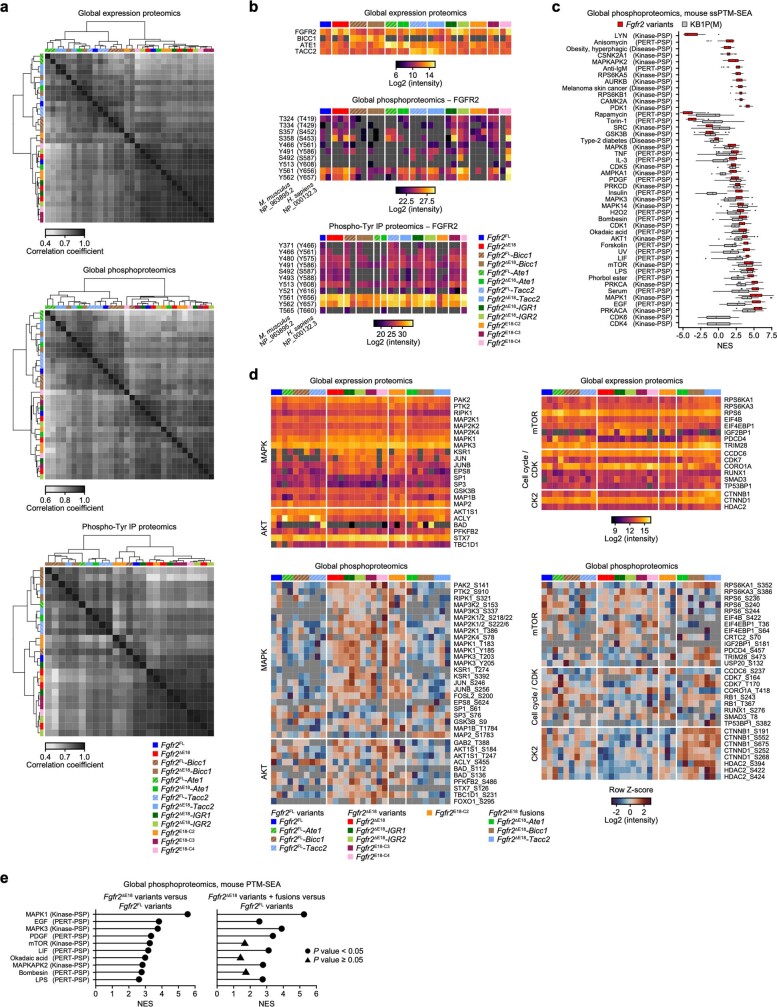
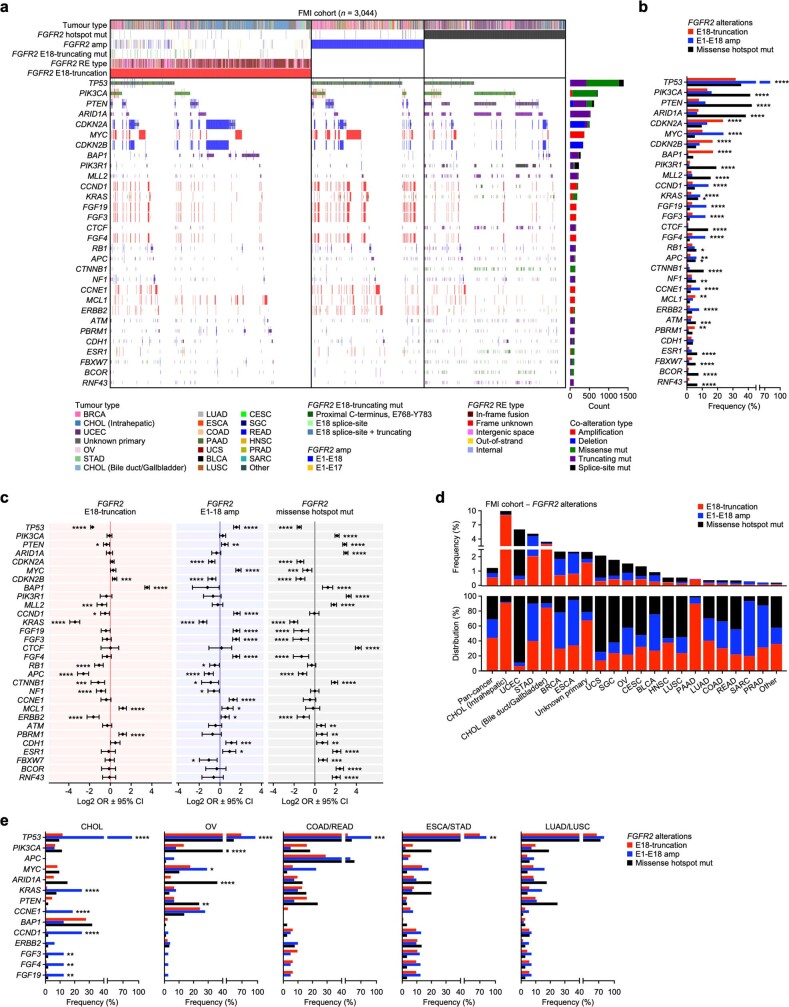
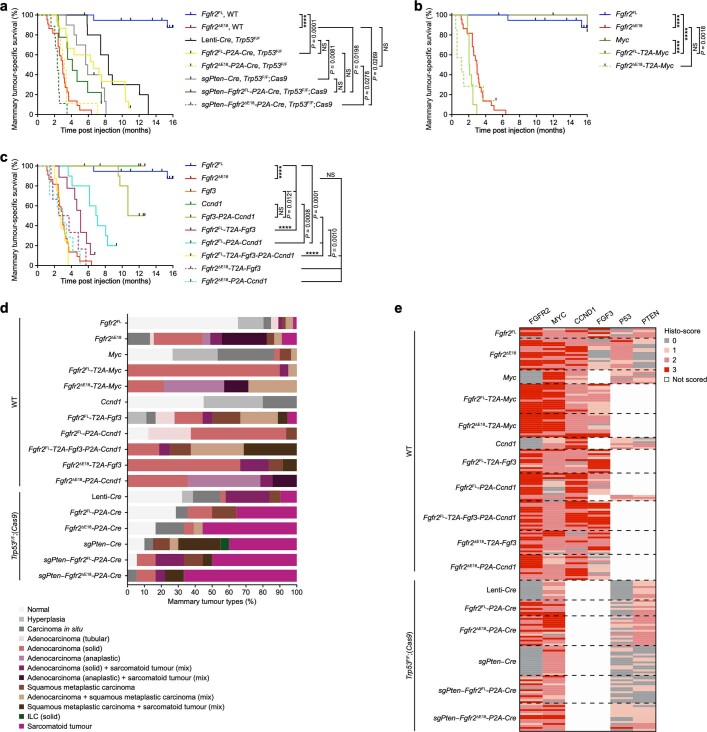
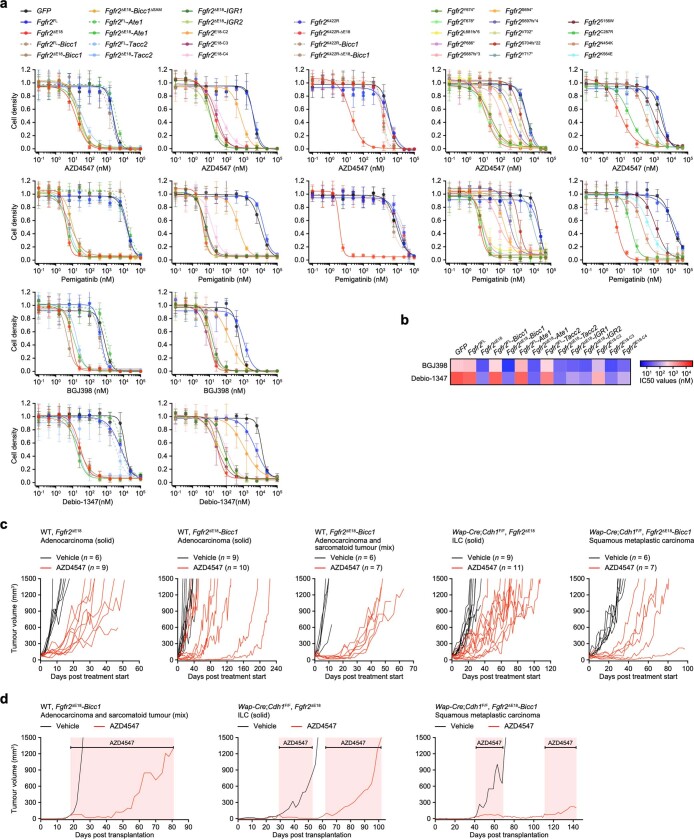
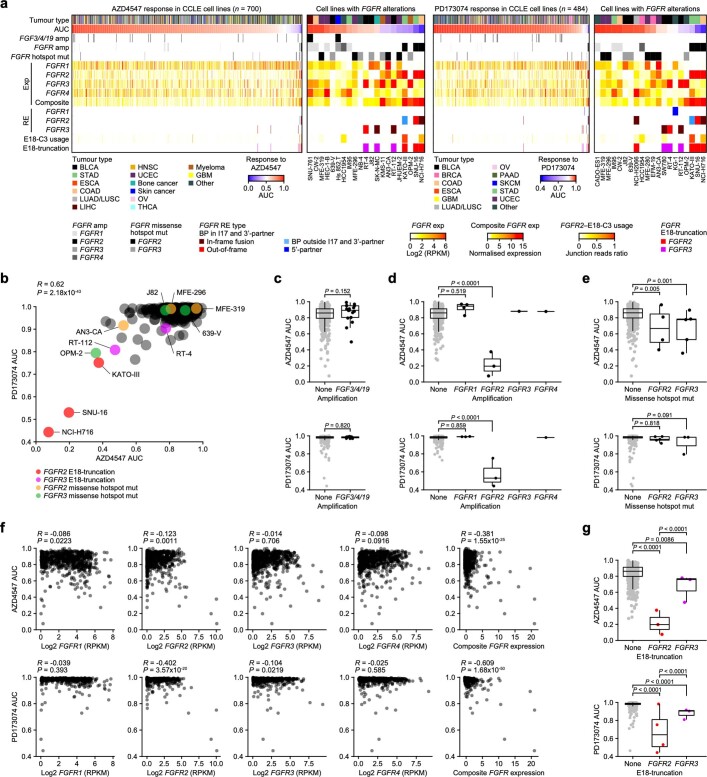
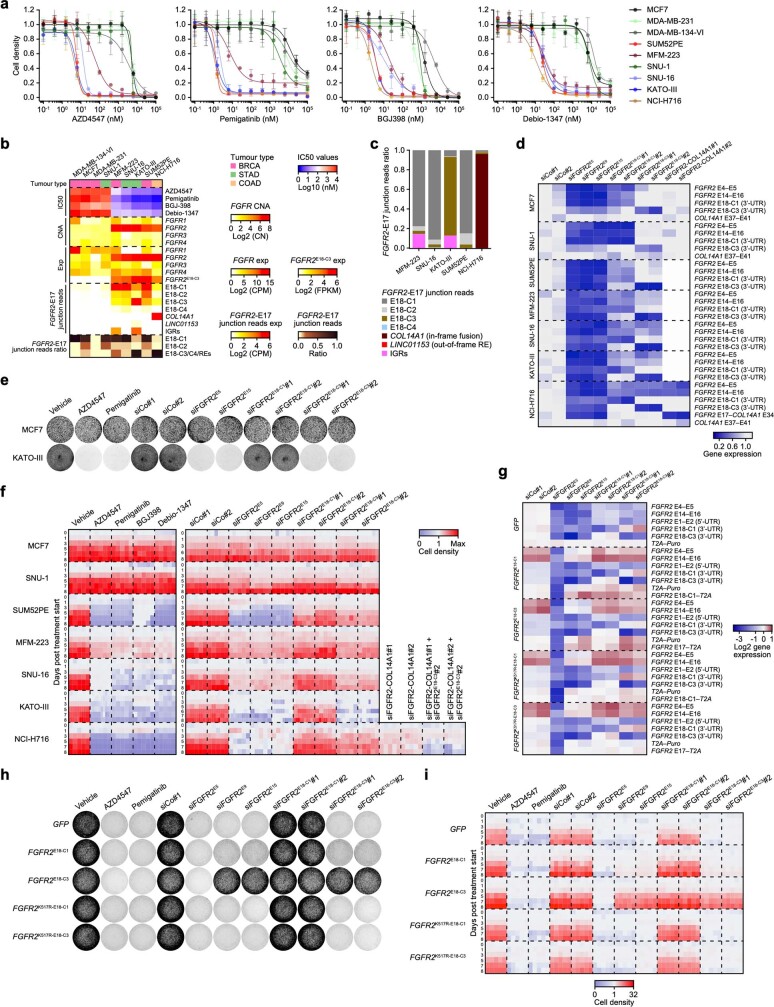
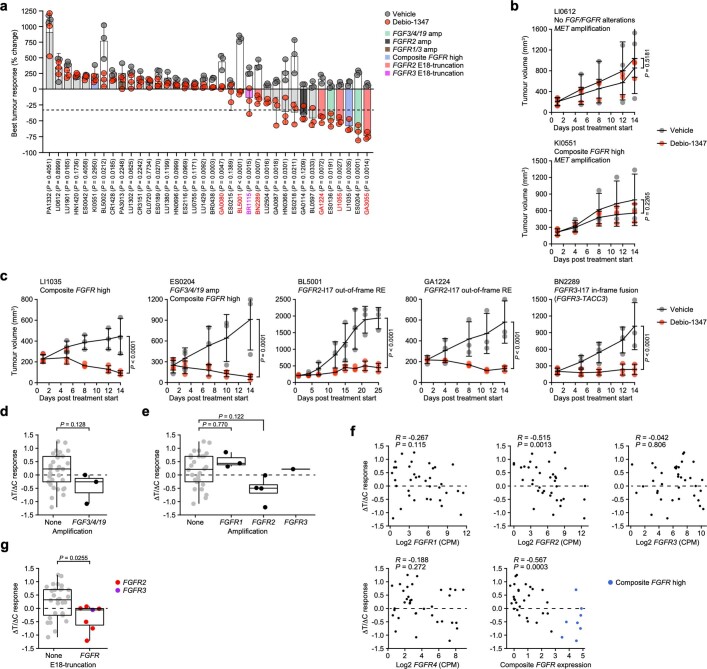
Somatic hotspot mutations and structural amplifications and fusions that affect fibroblast growth factor receptor 2 (encoded by FGFR2) occur in multiple types of cancer1. However, clinical responses to FGFR inhibitors have remained variable1-9, emphasizing the need to better understand which FGFR2 alterations are oncogenic and therapeutically targetable. Here we apply transposon-based screening10,11 and tumour modelling in mice12,13, and find that the truncation of exon 18 (E18) of Fgfr2 is a potent driver mutation. Human oncogenomic datasets revealed a diverse set of FGFR2 alterations, including rearrangements, E1-E17 partial amplifications, and E18 nonsense and frameshift mutations, each causing the transcription of E18-truncated FGFR2 (FGFR2ΔE18). Functional in vitro and in vivo examination of a compendium of FGFR2ΔE18 and full-length variants pinpointed FGFR2-E18 truncation as single-driver alteration in cancer. By contrast, the oncogenic competence of FGFR2 full-length amplifications depended on a distinct landscape of cooperating driver genes. This suggests that genomic alterations that generate stable FGFR2ΔE18 variants are actionable therapeutic targets, which we confirmed in preclinical mouse and human tumour models, and in a clinical trial. We propose that cancers containing any FGFR2 variant with a truncated E18 should be considered for FGFR-targeted therapies.


Conflict of interest statement

J.K.L. and R.M are employees of Foundation Medicine and have equity in Roche. I.M.S., H.Z., L.F. and T.C.B. are employees of and have equity in Incyte. G.K.A.-A. has performed research for ActaBiologica, Agios, Astra Zeneca, Bayer, Beigene, Berry Genomics, BMS, Casi, Celgene, Exelixis, Genentech/Roche, Halozyme, Incyte, Mabvax, Puma, QED, Sillajen and Yiviva, and has consulted for Agios, Astra Zeneca, Autem, Bayer, Beigene, Berry Genomics, Celgene, CytomX, Debio, Eisai, Eli Lilly, Exelixis, Flatiron, Genentech/Roche, Gilead, Helio, Incyte, Ipsen, Loxo, Merck, MINA, Polaris, QED, Redhill, Silenseed, Sillajen, Sobi, Therabionics, Twoxar, Vector and Yiviva. J.S.R. is an employee of Foundation Medicine, has equity in Roche and is a board member of Celsius Therapeutics. A.V.C. is an employee of Debiopharm International. S.M.A. is an employee of and has equity in EQRX, is a former employee of Foundation Medicine, is a scientific advisory board member of iN Therapeutics and has consulted for Takeda. S.G. has received research funding from M2Gen, has equity in Inspirata and Silagene, and has consulted for Foghorn Therapeutics, Foundation Medicine, Inspirata, Merck, Novartis, Roche and Silagene; his spouse is an employee of and has equity in Merck. The other authors declare no competing interests.

Figures

Fig. 1
Fig. 1. SB transposon screen and WGS analysis identifies recurrent FGFR2 E18 truncation.
a, Schematic of the SB transposon, which encodes splice acceptors (SA) followed by polyadenylation (pA) signals on both strands and a murine stem cell virus (MSCV) promoter followed by a splice donor (SD) on the plus strand. b, Mammary tumours with SB transposon insertions in Fgfr2 as identified in an insertional mutagenesis screen. The relative clonality of SB insertions in Fgfr2 is shown by a colour gradient (yellow to purple, clonality of 1 to 0). SB insertions in Fgfr2 were called for tumours with a Fgfr2 relative insertion clonality of ≥0.25. c, The SB transposon insertions found in Fgfr2 (chromosome 7). The SB insertion density was calculated using a 500 bp sliding window. The blue bars/arrows show sense SB insertions; the red bars/arrows show antisense SB insertions. d, Sashimi plot showing Fgfr2 read coverage and junction reads plotted as arcs with the indicated junction read counts of a tumour with an I17 antisense SB insertion. e, The ratio of spanning reads from Fgfr2-E17 to E18 versus SB transposon in tumours with I17 SB insertions. n = 31 (sense) and n = 30 (antisense). f, BPs generating FGFR2 (chromosome 10) genomic REs identified in 86 out of 2,112 analysed WGS profiles from the HMF cohort on metastatic solid tumours. n = 266 (total) and n = 196 (unique) BPs. BP density was calculated using a 500 bp sliding window. The grey bars show BPs. Corresponding protein domains are indicated. CT, C terminus; TM, transmembrane; Tyr KD, tyrosine kinase domain. Source data
Fig. 2
Fig. 2. Human FGFR2 E18-truncating alterations are oncogenic drivers in mice.
a, Analysis of 3,067 samples (1.23% incidence) containing FGFR2-I17/E18 in-frame fusions (n = 757, 0.30% incidence), frame unknown REs (n = 82, 0.03% incidence), intergenic space REs (n = 291, 0.12% incidence), out-of-strand REs (n = 88, 0.04% incidence), internal REs (n = 29, 0.01% incidence), FGFR2-E18 splice-site mutations (mut; n = 21, 0.01% incidence), E18-truncating nonsense and frameshift mutations (proximal, n = 59, 0.02% incidence; distal, n = 23, 0.01% incidence), FGFR2-E1–E17 partial amplifications (amp; n = 73, 0.03% incidence), E1–E18 full-length amplifications (n = 838, 0.34% incidence), and/or FGFR2 missense hotspot mutations affecting Ser252, Cys382, Asn549 or Lys659 (n = 978, 0.39% incidence) found in 249,570 pan-cancer diagnostic panel-seq profiles from FMI. BLCA, bladder urothelial carcinoma; BRCA, breast invasive carcinoma; CESC, cervical squamous cell carcinoma and endocervical adenocarcinoma; CHOL, cholangiocarcinoma; chr, chromosome; COAD, colon adenocarcinoma; ESCA, oesophageal carcinoma; HNSC, head and neck squamous cell carcinoma; LUAD, lung adenocarcinoma; LUSC, lung squamous cell carcinoma; OV, ovarian serous cystadenocarcinoma; PAAD, pancreatic adenocarcinoma; PRAD, prostate adenocarcinoma; READ, rectum adenocarcinoma; SARC, sarcoma; SGC, salivary gland carcinoma; STAD, stomach adenocarcinoma; UCEC, uterine corpus endometrial carcinoma; UCS, uterus carcinosarcoma. b, Global phosphoproteomic analysis of NMuMG cells expressing GFP or the indicated Fgfr2 variants. Groups were compared in a pairwise manner using the robust kinase activity inference (RoKAI) tool, including two-tailed hypothesis testing on Z-scores and false-discovery rate (FDR) multiple-testing correction using the Benjamini–Hochberg method. Group-comparison fold change (FC) values of −1.5 ≥ FC ≥ 1.5 and P < 0.05 were considered. The heatmaps show phosphosites subselected from the RoKAI output and grouped into the indicated signalling pathways guided by RoKAI as colour-coded row Z-scores calculated from log2-transformed intensity values. ce, Kaplan–Meier curves showing mammary-tumour-free survival of female mice intraductally injected with lentiviruses encoding the indicated Fgfr2 variants. Cohort counts (n) are injected mammary glands (MGs) per number of mice. The Fgfr2FL and Fgfr2ΔE18 curves in c are duplicated in d and e. P values were calculated using log-rank (Mantel–Cox) tests; ****P < 0.0001; NS, not significant (P ≥ 0.05). Source data
Fig. 3
Fig. 3. The oncogenic competence of FGFR2 alterations depends on co-occurring drivers.
a, Analysis of 528 breast cancer samples classified as either FGFR2 E18-truncated (n = 157, 29.7% of total, 0.70% incidence), E1–E18 amplified (n = 256, 48.5% of total, 1.14% incidence) or missense hotspot mutant (n = 115, 21.8% of total, 0.51% incidence), and the top co-enriched tumour driver alterations found in 22,380 breast cancer profiles from FMI. b, Enrichment of the top tumour driver co-alterations in the indicated FGFR2 alteration categories in the FMI breast cancer cohort. c, The odds ratios (ORs) of the top tumour driver co-alterations in the indicated FGFR2 alteration categories (E18 truncation, n = 157; E1–E18 amplification, n = 256; missense hotspot mutation, n = 115) versus FGFR2 WT samples (n = 22,307) of the FMI breast cancer cohort. Data are represented as log2-transformed OR ± 95% confidence interval (CI). Co-occurrence, OR > 1; mutual exclusivity, OR < 1. P values were calculated using one-tailed proportion Z-tests (b) or two-tailed Fisher’s exact tests (c) with FDR multiple-testing corrections using the Benjamini–Hochberg method (b and c). Sample sizes and statistical details for b and c are shown in Supplementary Table 2. df, Kaplan–Meier analysis of the mammary-tumour-free survival of Trp53F/F and Trp53F/F;Rosa26-Cas9 (d) or WT (e,f) female mice that were intraductally injected with lentiviruses encoding the indicated variants. Cohort counts (n) represent injected mammary glands (MGs) per number of mice. The Fgfr2FL and Fgfr2ΔE18 curves in df are duplicates from Fig. 2c. P values were calculated using log-rank (Mantel–Cox) tests. *P< 0.05; **P< 0.01; ***P < 0.001; ****P< 0.0001. Source data
Fig. 4
Fig. 4. Human and mouse FGFR2 alteration cancer models are sensitive to FGFRi.
a, Half-maximum inhibitory concentration (IC50) value quantifications of 2D-grown NMuMG cells expressing GFP or the indicated Fgfr2 variants and treated with AZD4547 or pemigatinib for 4 days. Data are the mean of 5 independent experiments (GFP, Fgfr2FL, Fgfr2ΔE18) or 1 experiment (other Fgfr2 variants). b, Kaplan–Meier analysis of mammary-tumour-specific survival of female syngeneic WT mice bearing mammary fat pad transplants derived from the indicated tumour donors and treated daily orally with vehicle or 12.5 mg per kg AZD4547 using an intermittent dosing regimen. P values were calculated using log-rank (Mantel–Cox) tests. c, Collection of PDX models (n = 36) rank-ordered according to debio-1347 ΔTC response ratios. FGF/FGFR copy number alteration and mutation data and RNA-seq profiles to analyse FGF/FGFR expression (exp) were obtained from CrownBio-HuPrime, and had been generated from non-treated PDXs. Composite FGFR expression was defined as high if normalized expression > 3. FGFR2-E18-C3 use and FGFR RE types were identified in RNA-seq profiles. GBM, glioblastoma multiforme; KIRC, kidney renal clear cell carcinoma; LIHC, liver hepatocellular carcinoma. d, Growth curves of the indicated PDXs engrafted in female BALB/c nude mice and treated daily orally with vehicle or debio-1347 (BR1115 and LI1050, 60 mg per kg; ES0042, GA0080 and GA3055, 80 mg per kg). n = 3 mice per PDX model and treatment group. Data are mean ± s.d. P values were calculated using one-tailed two-way analysis of variance with FDR multiple-testing corrections using the two-stage step-up method from Benjamini, Krieger and Yekutieli. Source data
Fig. 5
Fig. 5. Patients with cholangiocarcinoma respond to FGFR-targeted therapy irrespective of FGFR2 RE type.
a, Centrally assessed best percentage change from the baseline in target lesion size of 115 (92%) of 125 individual patients with cholangiocarcinoma treated with pemigatinib, who had post-baseline scans. Data are from the FIGHT-202 study and the coloured bars indicate FGFR2-I17/E18 RE types and FGFR2 amplification status as diagnosed by FoundationOne. b, Objective tumour responses observed in the FIGHT-202 study assessed according to the Response Evaluation Criteria in Solid Tumours v.1.1 (RECIST 1.1) and grouped according to FGFR2 RE types/amplification status. No FGF/FGFR alterations (n = 17), FGFR2 in-frame fusion (n = 85), frame unknown RE (n = 12), intergenic space RE (n = 5), in-frame fusion + amplification (n = 5). ‘Not evaluable’ indicates that the patient was not evaluable for response using RECIST. c, Kaplan–Meier analysis of the progression-free survival of patients with cholangiocarcinoma treated with pemigatinib from the FIGHT-202 study and grouped according to FGFR2 RE types/amplification status. Data are median ± 95% CI for each cohort, and log-rank hazard ratios (HR) ± 95% CI for the indicated comparisons are shown. P values were calculated using log-rank (Mantel–Cox) tests. ND, not defined. Source data
Extended Data Fig. 1
Extended Data Fig. 1. SB-insertions in Fgfr2 and FGFR2 REs found in the FMI cohort.
a, Normalized frequency (top panel) and enrichment significance (P values, bottom panel) of Sleeping Beauty (SB) transposon insertions (n = 81 insertions in 65 tumours) in each Fgfr2 exon (E) and intron (I) as identified in mammary tumours from a SB-transposon in vivo screen. SB insertion frequency was normalized by the kilobase of feature (exon/intron) length and total number of SB-insertions. b, c, Sashimi plots showing Fgfr2 read coverage and junction reads plotted as arcs with indicated junction read counts of tumours with no SB-insertion (b) and an I17 sense SB insertion (c) in Fgfr2. SA, splice acceptor; SD, splice donor; pA, polyadenylation signal. d, Left panel, counts of Fgfr2-E17–E18 spanning reads (counts per million, CPM) normalized to Fgfr2 expression (CPM) in SB tumour RNA sequencing (RNA-seq) profiles (none, n = 24; 5′-sense, n = 2; 3′-sense, n = 22; 3′-antisense, n = 27; 5′ + 3′-sense, n = 2; 5′ + 3′-antisense, n = 2); right panel, RT-qPCR to quantify Fgfr2-E17–E18 over Fgfr2-E14–E15 expression in SB-tumours (none, n = 10; 5′-sense, n = 2; 3′-sense, n = 8; 3′-antisense, n = 11; 5′ + 3′-sense, n = 2; 5’ + 3′-antisense, n = 2; individual dots represent mean of 3 independent measurements). e, Expression of Fgfr2 (CPM) in SB tumour RNA-seq profiles (none, n = 64; 5′-sense, n = 2; 3′-sense, n = 30; 3′-antisense, n = 28; 5′ + 3′-sense, n = 2; 5′ + 3′-antisense, n = 2). f, Normalized frequency (top panel) and enrichment significance (P values, bottom panel) of FGFR2 genomic rearrangement (RE) breakpoints (BPs) identified in 2,112 whole-genome sequencing (WGS) profiles from the Hartwig Medical Foundation (HMF) cohort in each exon/intron. BP frequency was normalized by the kilobase of feature (exon/intron) length and total number of BPs. g, FGFR2 copy numbers (CN, top panel) and RE ploidy frequencies (bottom panel) in samples with FGFR2 REs. FGFR2 BPs resulting in unresolved REs were excluded generating a refined list of REs (n = 93 REs in 55 tumour samples). Dotted lines, black, normal CN; purple, amplified CN (> 5); red, RE ploidy frequency threshold (> 0.15) to call samples with E18-truncating FGFR2 REs (E18-truncating, n = 20; others, n = 35). Amp, amplification. h, FGFR2 RE types found in WGS profiles from HMF. RNA support indicates evidence for FGFR2 REs in matching RNA-seq profiles. Empty fields, no RNA-seq data available. BLCA, bladder urothelial carcinoma; BRCA, breast invasive carcinoma; CHOL, cholangiocarcinoma; chr, chromosome; COAD, colon adenocarcinoma; ESCA, oesophageal carcinoma; GI, gastro-intestinal; HNSC, head and neck squamous cell carcinoma; LUAD, lung adenocarcinoma; LUSC, lung squamous cell carcinoma; OV, ovarian serous cystadenocarcinoma; PRAD, prostate adenocarcinoma; SARC, sarcoma; STAD, stomach adenocarcinoma; THCA, thyroid carcinoma. Data in d, e are represented as median (centre line) ± interquartile range (IQR, 25th to 75th percentile, box) and ± full range (minimum to maximum, whiskers). P values were calculated with one-tailed binomial tests (a, f) or one-tailed one-way analysis of variance (ANOVA) and Tukey’s multiple-testing corrections (d, e). Source data
Extended Data Fig. 2
Extended Data Fig. 2. FGFR2 alterations found in the HMF cohort.
a, Lollipop plot of FGFR2 missense mutations identified in the Foundation Medicine (FMI) pan-cancer cohort (249,570 diagnostic hybrid-capture panel-seq profiles). The top four recurrent mutations (Ser 252, Cys 382, Asn 549, Lys 659) are referred to as hotspots in this study. b, Distribution of FGFR2-I17/E18 RE types in FMI samples with FGFR2 normal CN, E1-E17 amp, and E1-E18 amp. c, Total numbers and distributions of FGFR2-I17/E18 RE types across chromosomes according to RE partner location. d, Linear chr-10 map depicting intrachromosomal FGFR2-I17/E18 REs. Thickness of arcs is proportional to the recurrence of the corresponding RE partners. Light / dark grey and red bars denote ideogram and centromere of chr-10. e, Percentage of unique proteins with self-interacting capacity among FGFR2 RE partners (n = 337) versus the human proteome (n = 20,385). Based on the SLIPPER Golden Standard Dataset of self-interactors. f, Distribution of self-interaction scores among FGFR2 RE partners using the SLIPPER algorithm. g, Enrichment of self-interacting protein domains among FGFR2 RE partners using DAVID. h, Recurrence of FGFR2 RE partners grouped by presence of self-interacting domains. Full list of RE partners is disclosed in Supplementary Table 2. IGRs, intergenic regions. i, j, Lollipop plot (i) and normalized frequency (top panel) and enrichment significance (P values, bottom panel) (j) of FGFR2-truncating mutations identified in the FMI cohort. Mutation frequency was normalized by the kilobase of feature (exon/intron) length and total number of mutations. AA, amino acid; CDS, coding sequence; CT, C terminus; TM, trans-membrane; UTR, untranslated region. k, Distribution of FGFR2-E18-truncating mutations identified in the FMI cohort and corresponding cloned mouse Fgfr2 variants representing most frequent human (H) FGFR2-E18 nonsense and frameshift (fs) mutations. C terminus sequences of cloned noncanonical E18-truncated Fgfr2 (Fgfr2ΔE18) variants are also displayed. IGR1 and IGR2 are based on TCGA-A8-A08A and TCGA-BH-A203 in Extended Data Fig. 5f, g. l, Frequencies (top panel) and distributions (bottom panel) per tumour type of E18-truncating FGFR2 alterations found in the FMI cohort. CESC, cervical squamous cell carcinoma and endocervical adenocarcinoma; mut, mutation; PAAD, pancreatic adenocarcinoma; READ, rectum adenocarcinoma; SGC, salivary gland carcinoma; UCEC, uterine corpus endometrial carcinoma; UCS, uterus carcinosarcoma. P values were calculated with a one-tailed proportion z-test (e), one-tailed Fisher’s exact tests (g), or one-tailed binomial tests (j). Source data
Extended Data Fig. 3
Extended Data Fig. 3. Expression of E18-truncating FGFR2 variants in HMF samples.
a, Sashimi plot showing FGFR2 read coverage and junction reads of the HMF sample DRUP01010109T (CHOL). FGFR2-WAC in-frame fusion identified with WGS and FGFR2-E17 to WAC-E4 junction confirmed with RNA-seq. b, Sashimi plot showing FGFR2 read coverage and junction reads of the HMF sample CPCT02330059T (STAD). FGFR2-I17 RE to intergenic space identified with WGS and FGFR2-E17 to intergenic region (IGR) junctions and FGFR2-E18-C3 usage found with RNA-seq. c, Sashimi plot showing FGFR2 read coverage and junction reads of the HMF sample CPCT02100119T (OV). FGFR2-EDRF1 frame unknown RE identified with WGS and FGFR2-E17 to EDRF1-E14 in-frame junction and FGFR2–E18-C3 usage found with RNA-seq. d, Sashimi plot showing FGFR2 read coverage and junction reads of the HMF sample CPCT02010647T (unknown tumour type). FGFR2-I17 RE to intergenic space identified with WGS and discordant FGFR2-AHCYL1 in-frame fusion with FGFR2-E17 to AHCYL1-E2 junction and FGFR2-E18-C3 usage found with RNA-seq. e, Sashimi plot showing FGFR2 read coverage and junction reads of the HMF sample CPCT02230118T (BRCA). FGFR2-I17 RE to intergenic space identified with WGS and discordant FGFR2-TACC2 in-frame fusion with FGFR2-E17 to TACC2-E19 junction found with RNA-seq. Reconstructed derivate chromosomes using LINX are displayed for CPCT02010647T (d) and CPCT02230118T (e) and depict complex FGFR2 REs involving intergenic space and ultimately resolving to AHCYL1-E2 (d) and TACC2-E19 (e). Green arrows indicate BPs identified with WGS. E18-C1, canonical E18 of FGFR2FL; E18-C2/C3/C4, alternative FGFR2-E18.
Extended Data Fig. 4
Extended Data Fig. 4. Expression of E18-truncating FGFR2 variants in FMI and TCGA samples.
a, Sashimi plot showing FGFR2 read coverage and junction reads of the FMI sample #1 (COAD). FGFR2-I17 RE to intergenic space was diagnosed by FMI, and discordant FGFR2-TACC2 in-frame fusion with FGFR2-E17 to TACC2-E19 junction was found with hybrid-capture RNA-seq. Green arrows indicate FGFR2 BP identified with panel-seq. b, Sashimi plot showing FGFR2 read coverage and junction reads of the FMI sample #2 (STAD). FGFR2-E1–E17 partial amp was diagnosed by FMI, and high FGFR2 expression with few E17–E18 junction reads but E18-C3 usage was found with hybrid-capture RNA-seq. Purple arrows indicate partially amplified FGFR2 region identified with panel-seq. c, FGFR2 amp status and RE type distribution in samples with FGFR2 REs (n = 50) found in the pan-cancer cohort from The Cancer Genome Atlas (TCGA, n = 10,344 samples). Dotted red line, RE read frequency threshold (> 0.15) to call samples expressing FGFR2ΔE18 REs (n = 17). d, 67 samples (0.65% incidence) containing FGFR2ΔE18 in-frame fusions (n = 12, 0.12% incidence), FGFR2ΔE18 non-canonical REs (n = 5, 0.05% incidence), proximal FGFR2-E18-truncating mutations (n = 1, 0.01% incidence), and cases with significant FGFR2-E18-C3 (n = 40; E18-C3 usage only, n = 36, 90% of total, 0.35% incidence; E18-C3 usage + RE, n = 4, 10% of total, 0.05% incidence) and/or E18-C4 (n = 13, 0.13% incidence) usage found in TCGA cohort. Asterisks mark previously annotated FGFR2 in-frame fusions. exp, expression; GBM, glioblastoma multiforme; KIRC, kidney renal clear cell carcinoma; KIRP, kidney renal papillary cell carcinoma; LIHC, liver hepatocellular carcinoma; SKCM, skin cutaneous melanoma; THYM, thymoma. e, Frequencies (top panel) and distributions (bottom panel) per tumour type of expressed FGFR2ΔE18 alterations found in TCGA cohort. f, g, Sashimi plots showing FGFR2 read coverage and junction reads of TCGA-BRCA samples A8-A08A (f) and BH-A203 (g) with identified FGFR2-I17 REs to intergenic space and FGFR2-E18-C3 usage. Source data
Extended Data Fig. 5
Extended Data Fig. 5. (Phospho)-proteomic analyses of NMuMG cells expressing Fgfr2 variants.
a, Fluorescence-activated cell sorting (FACS) to analyse FGFR2 mean fluorescence intensity (MFI) in NMuMG cells expressing GFP or indicated Fgfr2 variants. Fgfr2FL, full-length (FL) Fgfr2. Ate1, Bicc1, and Tacc2 correspond to the top-recurrent ATE1, BICC1, and TACC2 fusion partner genes in Extended Data Fig. 2h. Bicc1ΔSAM encodes BICC1 lacking its SAM oligomerisation domain. Fgfr2K422R variants encode tyrosine kinase domain (KD)-dead FGFR2 variants. Truncated or alternative C-termini encoded by IGR1/IGR2, E18-C2/C3/C4, Fgfr2Y674*, Fgfr2T678*, Fgfr2P686*, Fgfr2S694*, Fgfr2V702*, Fgfr2Y717*, Fgfr2L681fs*6, Fgfr2S687fs*3, Fgfr2S697fs*4, and Fgfr2S704fs*22 are displayed in Extended Data Fig. 2k. Fgfr2S156W, Fgfr2C287R, Fgfr2N454K, and Fgfr2K564E correspond to the human FGFR2S252W, FGFR2C382R, FGFR2N549K, and FGFR2K659E missense hotspot mutations in Extended Data Fig. 2a. Validation of overexpression of Fgfr2 variants using RT-qPCR is in Supplementary Table 4. Data are represented as median (centre line) ± IQR (25th to 75th percentile, box) and ± full range (minimum to maximum, whiskers) of GFP, n = 6; Fgfr2FL, Fgfr2ΔE18, n = 7; Fgfr2V702*, Fgfr2Y717*, Fgfr2S687fs*3, Fgfr2S697fs*4, Fgfr2S704fs*22, Fgfr2K564En = 4; other Fgfr2 variants, n = 6 independent replica. P values were calculated with one-tailed one-way ANOVA and false discovery rate (FDR) multiple-testing correction using the two-stage step-up method from Benjamini, Krieger, and Yekutieli. For FACS gating strategy, see Supplementary Fig. 2a. b, Mass spectrometry-based proteomic data showing correlation of NMuMG cells expressing GFP or indicated Fgfr2 variants for global protein expression, global phosphoproteomic analysis after enrichment with IMAC, and phospho-Tyr immunoprecipitation (IP)-enriched samples. Pearson’s R correlation coefficients are depicted and heatmaps were clustered unsupervised. c, Heatmaps visualizing FGFR2 phosphosites identified in (b). d, Single-sample gene set enrichment analysis (ssGSEA) based on hallmark gene sets from MSigDB and the global protein expression dataset. Significant single-sample normalized enrichment scores (NES) were calculated using GSEA standard settings,. NES are visualised as colour-coded row Z-scores and depicted terms are based on Fgfr2ΔE18 versus Fgfr2FL two-group comparisons using two-tailed unpaired Student’s t-tests. Significant terms are shown (P < 0.05). e, Relative candidate protein expression levels corresponding to MAPK, AKT, and mTOR substrates displayed in Fig. 2b and based on the global protein expression. f, Single-sample phosphosite signature enrichment analysis (ssPTM-SEA) based on murine kinase/pathway definitions of PTMsigDB and the global phosphoproteomic dataset. Significant single-sample NES were calculated using gene permutation (n = 1,000) and one-tailed permutation testing with FDR multiple-testing correction using the Benjamini-Hochberg method by applying PTM-SEA standard settings. NES are visualised as colour-coded row Z-scores and depicted terms are based on Fgfr2ΔE18 versus GFP, Fgfr2ΔE18 versus Fgfr2FL, and/or Fgfr2FL versus GFP two-group comparisons using two-tailed unpaired Student’s t-tests. Terms significant for either of the three two-group comparisons are shown (P < 0.05). g, Western blots showing expression and phosphorylation of indicated proteins in NMuMG cells expressing GFP or indicated Fgfr2 variants and treated for 3 h with vehicle or 100 nM AZD4547. β-Actin was run on separate gels as sample processing control, and each blot was stained with Ponceau S to ensure equal loading of total protein. Blots stained with the same antibody were developed and recorded in parallel and subjected to equal post-imaging processing. For gel source data, see Supplementary Fig. 1a–g. h, Quantifications of relative phosphoprotein band intensities in (g) normalized to β-actin, corresponding total protein, and FGFR2 band intensities. Data in g, h represent 1 replica of 2 independent experiments. Source data
Extended Data Fig. 6
Extended Data Fig. 6. In vitro and in vivo oncogenic capacities of Fgfr2 variants.
a, Representative images of 12-well plate wells and quantification of 3D soft agar colony formation assay using NMuMG cells expressing GFP or indicated Fgfr2 variants and treated with vehicle, 100 nM AZD4547, or 100 nM pemigatinib for 15 days. Data are represented as mean ± standard deviation (s.d.) of GFP, Fgfr2FL, Fgfr2ΔE18, vehicle, n = 33; AZD4547, pemigatinib, n = 18 independent replica from 4 individual experiments. Fgfr2FL-Bicc1, vehicle, n = 18; AZD4547, pemigatinib, n = 9 independent replica from 3 individual experiments. Fgfr2ΔE18-Bicc1, Fgfr2FL-Ate1, Fgfr2ΔE18-Ate1, Fgfr2FL-Tacc2, Fgfr2ΔE18-Tacc2, Fgfr2ΔE18-IGR1, Fgfr2ΔE18-IGR2, Fgfr2E18-C2, Fgfr2E18-C3, Fgfr2E18-C4, Fgfr2Y674*, Fgfr2T678*, Fgfr2L681fs*6, Fgfr2P686*, Fgfr2S694*, Fgfr2S156W, Fgfr2C287R, Fgfr2N454K, vehicle, n = 12; AZD4547, pemigatinib, n = 6 independent replica from 2 individual experiments. Fgfr2ΔE18-Bicc1ΔSAM, Fgfr2K422R, Fgfr2K422R-ΔE18, Fgfr2K422R-Bicc1, Fgfr2K422R-ΔE18-Bicc1, Fgfr2S687fs*3, Fgfr2S697fs*4, Fgfr2V702*, Fgfr2S704fs*22, Fgfr2Y717*, Fgfr2K564E, n = 6; AZD4547, pemigatinib, n = 3 independent replica from 1 experiment. b, c, FACS to quantify traced EGFP+ EpCAM+ epithelial cells (b) and their FGFR2 MFI (c). Rosa26-mT/mG female reporter mice were intraductally injected with lentiviruses encoding Cre or indicated Fgfr2-P2A-Cre variants resulting in Cre-mediated mT/mG allele switching, thus cell membrane-localized tdTomato (mT) expression was replaced by membrane-localized EGFP (mG) expression. Mammary glands (MGs) were subjected to FACS analysis at indicated timepoints post injection. Data are represented as mean ± s.d. and each data point represents a MG pool of an individual mouse. Analyses were done in batches of 1–2 mice of each Fgfr2 variant and one timepoint. In (b), 1 week, uninjected MGs, n = 5; Cre, n = 7; other Fgfr2 variants, n = 4; 3 weeks, all groups, n = 4; 6 weeks, uninjected MGs, Cre, Fgfr2K422R-P2A-Cre, Fgfr2K422R-ΔE18-P2A-Cre, Fgfr2K422R-Bicc1-P2A-Cre, Fgfr2K422R-ΔE18-Bicc1-P2A-Cre, n = 5; other Fgfr2 variants, n = 6 mice. In (c), 1 week and 3 weeks, all groups, n = 3; 6 weeks, Cre, Fgfr2FL-P2A-Cre, Fgfr2ΔE18-P2A-Cre, Fgfr2FL-Bicc1-P2A-Cre, Fgfr2ΔE18-Bicc1-P2A-Cre, Fgfr2ΔE18-Bicc1ΔSAM-P2A-Cre, n = 4; other Fgfr2 variants, n = 3 mice. For FACS gating strategy, see Supplementary Fig. 2b. d, e, Kaplan-Meier curves showing mammary tumour-specific survival of female wild-type (WT) mice intraductally injected with lentiviruses encoding indicated Fgfr2 variants. Fgfr2FL, n = 20; Fgfr2ΔE18, n = 22; Fgfr2FL-Bicc1, Fgfr2ΔE18-Bicc1ΔSAM, Fgfr2FL-Ate1, Fgfr2ΔE18-Ate1, Fgfr2FL-Tacc2, Fgfr2ΔE18-Tacc2, Fgfr2ΔE18-IGR1, Fgfr2ΔE18-IGR2, Fgfr2E18-C2, Fgfr2E18-C3, Fgfr2E18-C4, n = 10; Fgfr2ΔE18-Bicc1, n = 11 mice. Fgfr2FL and Fgfr2ΔE18 curves in a are duplicated in d, h. f, g, Kaplan-Meier curves showing mammary tumour-free (c) and -specific (d) survival of female Wap-Cre;Cdh1F/F mice intraductally injected with lentiviruses encoding indicated Fgfr2 variants. Fgfr2FL, n = 34 of 15; Fgfr2ΔE18, n = 39 of 15; Fgfr2FL-Bicc1, n = 19 of 10; Fgfr2ΔE18-Bicc1, n = 21 injected MGs of 11 mice. h, Kaplan-Meier curves showing mammary tumour-specific survival of female wild-type (WT) mice intraductally injected with lentiviruses encoding indicated Fgfr2 variants. Fgfr2Y674*, Fgfr2L681fs*6, Fgfr2S697fs*4, Fgfr2S704fs*22, n = 10; Fgfr2T678*, n = 4; Fgfr2P686*, Fgfr2S694*, Fgfr2V702*, Fgfr2Y717*, n = 5 mice. P values were calculated with one-tailed two-way ANOVA and FDR multiple-testing corrections using the two-stage step-up method from Benjamini, Krieger, and Yekutieli (a, c), one-tailed Kruskal-Wallis tests and Dunn’s multiple-testing corrections (b), or log rank (Mantel-Cox) tests (bh). ****P < 0.0001; NS, not significant (P ≥ 0.05). Source data
Extended Data Fig. 7
Extended Data Fig. 7. In vivo oncogenic capacities of Fgfr2 variants in somatic models and GEMMs.
a, b, Kaplan-Meier curves showing mammary tumour-free (a) and -specific (b) survival of female Wap-Cre;Cdh1F/F mice intraductally injected with lentiviruses encoding indicated Fgfr2 variants. Fgfr2T678*, n = 13 of 7; Fgfr2P686*, n = 13 of 4; Fgfr2S694*, n = 12 of 4; Fgfr2V702*, n = 12 of 5; Fgfr2Y717*, n = 11 injected MGs of 4 mice. Fgfr2FL and Fgfr2ΔE18 curves in a, b are duplicates from Extended Data Fig. 6f, g. c, d, Kaplan-Meier curves showing mammary tumour-free (c) and -specific (d) survival of female WT mice intraductally injected with lentiviruses encoding indicated Fgfr2 variants. Fgfr2S156W, Fgfr2C287R, Fgfr2N454K, Fgfr2K564E, n = 20 injected MGs of 10 mice. Fgfr2FL and Fgfr2ΔE18 curves in c, d are duplicates from Fig. 2c and Extended Data Fig. 6d. e, Schematic representation of the engineered Fgfr2FL and Fgfr2ΔE18 alleles. Frt-invCAG-Fgfr2FL-IRES-Luc and Frt-invCAG-Fgfr2ΔE18-IRES-Luc were inserted into the Col1a1 locus using the genetically engineered mouse model – embryonic stem cell (GEMM-ESC) methodology. Cre activity inverts the CAG promoter resulting in coherent FGFR2 and luciferase (Luc) expression. IRES, internal ribosome entry site. f, RT-qPCR quantification of Fgfr2 and Luc expression in mouse mammary epithelial cells (MMECs) isolated from pooled MGs of 10-week-old WT control, Fgfr2FL-IRES-Luc, and Fgfr2ΔE18-IRES-Luc female mice and mock-treated or treated with adenoviral Ad5CMVCre (AdCre) to switch Fgfr2 alleles in vitro. Data are represented as mean ± s.d. of WT, n = 1; Fgfr2FL-IRES-Luc, Fgfr2ΔE18-IRES-Luc, n = 4 MMEC cultures each from MG pools of individual mice. g, h, Western blot showing FGFR2 expression of mock- or AdCre-treated MMEC cultures (g) and quantification of relative FGFR2 intensities normalized to β-actin (h). β-Actin was run on a separate gel as sample processing control, and membranes were stained with Ponceau S to ensure equal loading of total protein. For gel source data, see Supplementary Fig. 1h, i. In h, data are represented as mean ± s.d. of WT, n = 1; Fgfr2FL-IRES-Luc, Fgfr2ΔE18-IRES-Luc, n = 3 MMEC cultures each from MG pools of individial mice. i, Luciferase activity measured using luciferin and bioluminescence imaging on mock- or AdCre-treated MMEC cultures. Data are represented as simple linear regressions across Fgfr2FL-IRES-Luc, n = 4; Fgfr2ΔE18-IRES-Luc, n = 3 MMEC cultures (each from MG pools of individual mice) at indicated cell densities. j, Representative in vivo bioluminescence images showing luciferase activity following luciferin administration measured as photon flux in 10-week-old Wap-Cre;Cdh1F/F, Wap-Cre;Cdh1F/F;Fgfr2FL-IRES-Luc, and Wap-Cre;Cdh1F/F;Fgfr2ΔE18-IRES-Luc female mice. Scale bars, 1 cm. k, Quantification of luciferase activity using recurrent bioluminescence imaging in indicated GEMMs. Wap-Cre;Cdh1F/F female mice show background luminescence. Wap-Cre;Cdh1F/F, n = 3; Wap-Cre;Cdh1F/F;Fgfr2FL-IRES-Luc, n = 6; Wap-Cre;Cdh1F/F;Fgfr2ΔE18-IRES-Luc, n = 4 mice. l, m, Kaplan-Meier curves showing mammary tumour-free (l) and -specific (m) survival of indicated GEMMs. Wap-Cre;Cdh1F/+, n = 12; Wap-Cre;Cdh1F/+;Fgfr2FL-IRES-Luc, n = 5; Wap-Cre;Cdh1F/+;Fgfr2ΔE18-IRES-Luc, n = 6; Wap-Cre;Cdh1F/F, n = 16; Wap-Cre;Cdh1F/F;Fgfr2FL-IRES-Luc, Wap-Cre;Cdh1F/F;Fgfr2ΔE18-IRES-Luc, n = 19 mice. P values were calculated with log rank (Mantel-Cox) tests (ad, l, m), one-tailed two-way ANOVA and FDR multiple-testing corrections using the two-stage step-up method from Benjamini, Krieger, and Yekutieli (f), a two-tailed unpaired Student’s t-test (h), or one-way analysis of covariance (ANCOVA) to compare linear regression slopes (i). ****P < 0.0001. Source data
Extended Data Fig. 8
Extended Data Fig. 8. Mammary tumour types observed in Fgfr2 mouse models.
a, Representative hematoxylin and eosin (H&E) histochemistry and FGFR2 and E-cadherin immunohistochemistry (IHC) stains on mammary tissue sections from indicated Fgfr2 somatic mouse models. Per MG one tissue section was stained and quantified for each of the indicated stains acquired in multiple independent randomized batches across all Fgfr2 variants. Numbers of stained and quantified MGs are in (b, c). ILC, invasive lobular carcinoma. b, Mammary tumour type classifications of Fgfr2 somatic mouse models based on H&Es and E-cadherin IHC stains. WT, Fgfr2FL, n = 46 of 20; Fgfr2ΔE18, n = 45 of 22; Fgfr2FL-Bicc1, n = 23 of 10; Fgfr2ΔE18-Bicc1, n = 26 of 11; Fgfr2ΔE18-Bicc1ΔSAM, Fgfr2ΔE18-Ate1, Fgfr2FL-Tacc2, Fgfr2E18-C3, n = 20 of 10; Fgfr2FL-Ate1, Fgfr2ΔE18-Tacc2, Fgfr2E18-C4, n = 19 of 10; Fgfr2ΔE18-IGR1, n = 18 of 9; Fgfr2ΔE18-IGR2, Fgfr2E18-C2, n = 17 of 10; Fgfr2Y674*, Fgfr2C287R, n = 16 of 8; Fgfr2T678*, n = 15 of 4; Fgfr2L681fs*6, n = 14 of 7; Fgfr2P686*, n = 16 of 5; Fgfr2S694*, n = 13 of 5; Fgfr2S697fs*4, n = 8 of 4; Fgfr2V702*, n = 8 of 3; Fgfr2Y717*, n = 14 of 5; Fgfr2N454K, n = 4 injected MGs of 2 mice. Wap-Cre;Cdh1F/F, Fgfr2FL, n = 34 of 15; Fgfr2ΔE18, n = 39 of 15; Fgfr2FL-Bicc1, n = 17 of 9; Fgfr2ΔE18-Bicc1, n = 21 of 11; Fgfr2T678*, n = 13 of 7; Fgfr2P686*, n = 14 of 4; Fgfr2S694*, n = 12 of 4; Fgfr2V702*, n = 12 of 5; Fgfr2Y717*, n = 11 injected MGs of 4 mice. c, Histo-scoring of FGFR2 IHC stains on mammary tumours from Fgfr2 somatic mouse models. WT, Fgfr2FL, n = 6 of 5; Fgfr2ΔE18, n = 39 of 22; Fgfr2FL-Bicc1, n = 17 of 10; Fgfr2ΔE18-Bicc1, n = 22 of 11; Fgfr2ΔE18-Bicc1ΔSAM, n = 17 of 9; Fgfr2FL-Ate1, n = 5 of 5; Fgfr2ΔE18-Ate1, Fgfr2E18-C4, n = 16 of 9; Fgfr2FL-Tacc2, n = 12 of 8; Fgfr2ΔE18-Tacc2, n = 11 of 8; Fgfr2ΔE18-IGR1, Fgfr2E18-C3, n = 14 of 9; Fgfr2ΔE18-IGR2, n = 15 of 10; Fgfr2E18-C2, n = 12 of 9; Fgfr2Y674*, n = 14 of 8; Fgfr2T678*, n = 11 of 4; Fgfr2L681fs*6, n = 13 of 8; Fgfr2P686*, Fgfr2S694*, n = 10 of 5; Fgfr2S697fs*4, n = 7 of 4; Fgfr2V702*, n = 6 of 3; Fgfr2Y717*, n = 10 of 4; Fgfr2C287R, n = 15 of 8; Fgfr2N454K, n = 3 tumours of 2 mice. Wap-Cre;Cdh1F/F, Fgfr2FL, n = 12 of 8; Fgfr2ΔE18, n = 23 of 9; Fgfr2FL-Bicc1, n = 14 of 7; Fgfr2ΔE18-Bicc1, n = 18 of 10; Fgfr2T678*, Fgfr2V702*, n = 10 of 5; Fgfr2P686*, n = 9 of 4; Fgfr2S694*, n = 10 of 4; Fgfr2Y717*, n = 6 tumours of 3 mice. d, Representative H&E histochemistry and E-cadherin and FGFR2 IHC stains on mammary tissue sections from indicated GEMMs. Per MG one tissue section was stained and quantified for each of the indicated stains acquired in two independent randomized batches across all genotypes. Numbers of stained and quantified MGs are in (e, f). e, Mammary tumour type classifications of GEMMs based on H&Es and E-cadherin IHC stains. Wap-Cre;Cdh1F/+, n = 45 of 12; Wap-Cre;Cdh1F/+;Fgfr2FL, n = 20 of 5; Wap-Cre;Cdh1F/+;Fgfr2ΔE18, n = 29 of 6; Wap-Cre;Cdh1F/F, n = 60 of 16; Wap-Cre;Cdh1F/F;Fgfr2FL, n = 73 of 19; Wap-Cre;Cdh1F/F;Fgfr2ΔE18, n = 79 MGs of 19 mice. f, Histo (H)-score quantifications of FGFR2 IHC stains on mammary tumours from GEMMs. Wap-Cre;Cdh1F/+, n = 2 of 2; Wap-Cre;Cdh1F/+;Fgfr2FL, n = 1 of 1; Wap-Cre;Cdh1F/+;Fgfr2ΔE18, n = 8 of 5; Wap-Cre;Cdh1F/F, n = 9 of 8; Wap-Cre;Cdh1F/F;Fgfr2FL, n = 8 of 6; Wap-Cre;Cdh1F/F;Fgfr2ΔE18, n = 24 tumours of 19 mice. Data are represented as median (centre line) ± IQR (25th to 75th percentile, box) and ± full range (minimum to maximum, whiskers) and P values were calculated with one-tailed Kruskal-Wallis tests and Dunn’s multiple-testing corrections. Scale bars, overview, 500 μm; inset, 50 μm. Source data
Extended Data Fig. 9
Extended Data Fig. 9. (Phospho)-proteomic analyses of tumours from Fgfr2 somatic mouse models.
a, Mass spectrometry-based proteomic data showing correlation of indicated Fgfr2 somatic mouse models for global protein expression, global phosphoproteomic analysis after enrichment with IMAC, and phospho-Tyr IP-enriched mammary tumours. Pearson’s R correlation coefficients are depicted and heatmaps were clustered unsupervised. b, Relative protein expression of FGFR2 and its fusion partners BICC1, ATE1, and TACC2 next to FGFR2 phosphosites identified in datasets from a. Heatmaps colour-code relative intensities of protein expression and phosphorylation. c, ssPTM-SEA based on murine kinase/pathway definitions of PTMsigDB and the global phosphoproteomic dataset in a as well as phosphoproteomic data generated from mammary tumours from K14-Cre;BrcaF/F;Trp53F/F (KB1P) and KB1P;Mdr1a/b−/− (KB1PM) GEMMs. Each boxplot represents one ssPTM-SEA term and shows NES of individual Fgfr2 variant tumours or KB1P(M) tumours. ssPTM-SEA terms enriched in the Fgfr2 variant and/or the KB1P(M) tumour cohorts are shown. Significant single-sample NES were calculated using gene permutation (n = 1,000) and permutation-derived P values by applying PTM-SEA standard settings. No further statistical selections were applied. Boxplots are represented as median (centre line) ± IQR (25th to 75th percentile, box) and IQR ± 1.5 x IQR (whiskers). Fgfr2 variants, n = 32; KB1P, n = 14; KB1PM, n = 10 tumours. d, Relative candidate protein expression (top panels) and phosphorylation (bottom panels) levels of MAPK, AKT, mTOR, cell cycle / CDK, and CK2 substrates identified in a. For the phosphoproteomic analysis, samples were grouped into Fgfr2FL variants, Fgfr2ΔE18 variants, and Fgfr2ΔE18 fusion variants and compared pairwise using the robust kinase activity inference (RoKAI) tool at default settings including two-tailed hypothesis testing on Z-scores and FDR multiple-testing correction using the Benjamini-Hochberg method. Group comparison fold change (FC) values of −1.5 ≥ FC ≥ 1.5 and P < 0.05 were considered. The RoKAI output was used to manually curate phosphosites of interest, and phosphosites were manually grouped into indicated signalling pathways guided by RoKAI. The heatmaps depict relative expression intensities (top panels) and Z-scores of phosphosite intensities calculated per row from log2-transformed intensity values (bottom panels). e, PTM-SEA based on murine kinase/pathway definitions of PTMsigDB and performed with global phosphoproteomic data and limma-based two-group comparisons of Fgfr2ΔE18 variants versus Fgfr2FL variants groups (left panel) and Fgfr2ΔE18 variants including fusions versus Fgfr2FL variants groups (right panel). Significant NES were calculated by using gene permutation (n = 1,000) and one-tailed permutation testing without multiple-testing correction by applying PTM-SEA standard settings. Lollipops show NES of terms significantly enriched in either of the two comparisons (P < 0.05). Source data
Extended Data Fig. 10
Extended Data Fig. 10. Top driver genes co-occurring in samples with FGFR2 alterations.
a, 3,044 samples classified as either FGFR2-E18-truncated (n = 1,344, 44.2% of total, 0.54% incidence), amplified (n = 757, 24.8% of total, 0.30% incidence), or missense hotspot mutant (n = 943, 31.0% of total, 0.38% incidence) and top-30 co-enriched tumour driver alterations found in the FMI pan-cancer cohort (n = 249,570). b, Enrichments of top-30 tumour driver co-alterations in the indicated FGFR2 alteration categories in the FMI pan-cancer cohort. c, Odds ratios (OR) of top-30 tumour driver co-alterations in the indicated FGFR2 alteration categories (E18-truncation, n = 1,344; E1-E18 amp, n = 757; missense hotspot mut, n = 943) versus FGFR2 WT samples (n = 224,711) of the FMI pan-cancer cohort. Data are represented as log2-transformed OR ± 95% confidence interval (CI). Co-occurrence, OR > 1; mutual exclusivity, OR < 1. d, Frequencies (top panel) and distributions (bottom panel) per tumour type of the indicated FGFR2 alteration categories in the FMI pan-cancer cohort. e, Enrichment of top tumour driver co-alterations in the indicated FGFR2 alteration categories in the FMI-CHOL, OV, COAD/READ, ESCA/STAD, and LUAD/LUSC cohorts. P values were calculated with one-tailed proportion z-tests (b, e) or two-tailed Fisher’s exact tests (c) and FDR multiple-testing corrections using the Benjamini-Hochberg method (b, c, e). *P < 0.05, **P < 0.01, ***P < 0.001, ****P < 0.0001. Sample sizes and statistical details for b, c, e are in Supplementary Table 2. Source data
Extended Data Fig. 11
Extended Data Fig. 11. Somatic modelling of Fgfr2 variants and co-occurring driver alterations.
a-c, Kaplan-Meier curves showing mammary tumour-specific survival of Trp53F/F and Trp53F/F;Rosa26-Cas9 (a) and WT (b, c) female mice intraductally injected with lentiviruses encoding indicated variants. Trp53F/F;(Rosa26-Cas9), Lenti-Cre, sgPten–Cre, n = 10; Fgfr2FL-P2A-Cre, n = 15; Fgfr2ΔE18-P2A-Cre, sgPten–Fgfr2FL-P2A-Cre, sgPten–Fgfr2ΔE18-P2A-Cre, n = 9 mice. WT, Myc, Fgfr2FL-T2A-Fgf3, n = 9; Fgfr2FL-T2A-Myc, Fgf3, Ccnd1, Fgf3-P2A-Ccnd1, Fgfr2FL-P2A-Ccnd1, n = 10; Fgfr2ΔE18-T2A-Myc, Fgfr2ΔE18-P2A-Ccnd1, n = 7; Fgfr2FL-T2A-Fgf3-P2A-Ccnd1, n = 8; Fgfr2ΔE18-T2A-Fgf3, n = 6 mice. Fgfr2FL and Fgfr2ΔE18 curves are duplicates from Extended Data Fig. 6d. P values were calculated with log rank (Mantel-Cox) tests. ****P < 0.0001. d, Mammary tumour type classifications of somatic mouse models based on H&Es. WT, Myc, n = 30 of 9; Fgfr2FL-T2A-Myc, n = 20 of 10; Fgfr2ΔE18-T2A-Myc, Fgfr2ΔE18-P2A-Ccnd1, n = 14 of 7; Ccnd1, n = 40 of 10; Fgfr2FL-T2A-Fgf3, n = 18 of 9; Fgfr2FL-P2A-Ccnd1, Fgfr2FL-T2A-Fgf3-P2A-Ccnd1, n = 16 of 8; Fgfr2ΔE18-T2A-Fgf3, n = 12 injected MGs of 6 mice. Trp53F/F;(Rosa26-Cas9), Lenti-Cre, n = 31 of 10; Fgfr2FL-P2A-Cre, n = 14 of 7; Fgfr2ΔE18-P2A-Cre, sgPten–Fgfr2FL-P2A-Cre, sgPten–Fgfr2ΔE18-P2A-Cre, n = 18 of 9; sgPten–Cre, n = 20 injected MGs of 10 mice. WT Fgfr2FL and Fgfr2ΔE18 classifications are duplicates from Extended Data Fig. 8b. e, Histo-scoring of indicated IHC stains on mammary tumours from somatic mouse models. WT, Fgfr2FL, n = 5 of 5; Fgfr2ΔE18, n = 16 of 11; Myc, n = 7 of 3; Fgfr2FL-T2A-Myc, n = 15 of 10; Fgfr2ΔE18-T2A-Myc, n = 12 of 6; Ccnd1, n = 6 of 2; Fgfr2FL-T2A-Fgf3, n = 12 of 8; Fgfr2FL-P2A-Ccnd1, n = 14 of 9 ; Fgfr2FL-T2A-Fgf3-P2A-Ccnd1, n = 15 of 8; Fgfr2ΔE18-T2A-Fgf3, n = 12 of 7; Fgfr2ΔE18-P2A-Ccnd1, n = 13 tumours of 7 mice. Trp53F/F;(Rosa26-Cas9), Lenti-Cre, n = 10 of 8; Fgfr2FL-P2A-Cre, n = 8 of 5; Fgfr2ΔE18-P2A-Cre, n = 15 of 10; sgPten–Cre, n = 15 of 9; sgPten–Fgfr2FL-P2A-Cre, n = 14 of 7; sgPten–Fgfr2ΔE18-P2A-Cre, n = 14 tumours of 9 mice. In d, e, one tissue section per MG was stained and quantified for each of the indicated stains acquired in 4 independent randomized batches across all Fgfr2 variants and genotypes. Source data
Extended Data Fig. 12
Extended Data Fig. 12. In vitro and in vivo sensitivity of Fgfr2 variants to FGFRi.
a, Dose-response curves of 2D-grown NMuMG cells expressing GFP or indicated Fgfr2 variants and treated with AZD4547, pemigatinib, BGJ398, or debio-1347 for 4 days. Data are represented as mean ± s.d. of n = 5 replica per group collected across 5 independent experiments. b, Half-maximum inhibitory concentration (IC50) value quantifications of BGJ398 and debio-1347 dose-response curves in a. Data are represented as mean of 3 independent experiments (GFP, Fgfr2FL, Fgfr2ΔE18) or 1 experiment (other Fgfr2 variants). IC50 values for AZD4547 and pemigatinib are displayed in Fig. 4a. c, Individual growth curves of indicated tumour donors transplanted into the mammary fat pad of female syngeneic WT mice and treated daily orally with vehicle or 12.5 mg/kg AZD4547 using a previously established intermittent dosing regimen. d, Selected tumour transplant growth curves of mice in c. Durations of AZD4547 treatments according to intermittent dosing regimen are indicated. Source data
Extended Data Fig. 13
Extended Data Fig. 13. Correlation of FGFR2 alterations to FGFRi sensitivity across CCLE.
a, The Broad Institute Cancer Cell Line Encyclopedia (CCLE) cell lines rank-ordered according to their AZD4547 or PD173074 FGFRi area under the sigmoid-fit concentration-response curve (AUC) values derived from the Cancer Therapeutics Response Portal (CTRP) v2 deposited in the PharmacoDB database (n = 700) and the Genomics of Drug Sensitivity in Cancer (GDSC) database (n = 484), respectively. Data on FGF/FGFR mutations, CN status, REs, and expression and FGFR2–E18-C3 usage was obtained from CCLE. RPKM, reads per kilobase of transcript per million mapped reads. b, Correlation of AZD4547 versus PD173074 AUC values across shared CCLE cell lines (n = 384). c, AZD4547 and PD173074 AUC values in CCLE cell lines with FGF3/4/19 amp (AZD4547, n = 17; PD173074, n = 16) versus unaltered cell lines (AZD4547, n = 658; PD173074, n = 455). d, AZD4547 and PD173074 AUC values in CCLE cell lines with FGFR1 amp (AZD4547, n = 4; PD173074, n = 3), FGFR2 amp (AZD4547, n = 3; PD173074, n = 3), FGFR3 amp (AZD4547, n = 1; PD173074, n = 0), or FGFR4 amp (AZD4547, n = 1; PD173074, n = 1) versus unaltered cell lines (AZD4547, n = 666; PD173074, n = 464). e, AZD4547 and PD173074 AUC values in CCLE cell lines with FGFR2 missense hotspot mut (AZD4547, n = 4; PD173074, n = 5) or FGFR3 missense hotspot mut (AZD4547, n = 5; PD173074, n = 3) versus unaltered cell lines (AZD4547, n = 691; PD173074, n = 476). f, Correlations of FGFR1, FGFR2, FGFR3, FGFR4, or composite FGFR expression versus AZD4547 or PD173074 AUC values across CCLE cell lines. g, AZD4547 or PD173074 AUC values in CCLE cell lines expressing E18-truncated FGFR2 (AZD4547, n = 3; PD173074, n = 4) or FGFR3 (AZD4547, n = 3; PD173074, n = 3) versus no truncation (AZD4547, n = 694; PD173074, n = 477). Data in ce, g are represented as median (centre line) ± IQR (25th to 75th percentile, box) and IQR ± 1.5 x IQR (whiskers) . P values were calculated with two-tailed t-transformations of Pearson’s R correlation coefficients (b, f), two-tailed Wilcoxon rank-sum tests (c), or one-tailed one-way ANOVA and Tukey’s multiple-testing corrections (d, e, g). Source data
Extended Data Fig. 14
Extended Data Fig. 14. Human cancer cell lines depend on FGFR2ΔE18 variants.
a, Dose-response curves of indicated human cancer cell lines treated with AZD4547, pemigatinib, BGJ398, or debio-1347 for 4 days. Data are represented as mean ± s.d. of n = 5 replica per group collected across 2 independent experiments. b, Human cancer cell lines rank-ordered according to IC50 values for indicated FGFRi in (a). FGFR1-4 CNA and expression is based on low-coverage WGS and RNA-seq profiles. FGFR2E18-C3 isoform expression, FGFR2-E17 junction reads expression, and FGFR2 RE types were identified in RNA-seq profiles. FPKM, fragments per kilobase of transcript per million mapped reads. c, Distribution of FGFR2-E17 junction reads to canonical full-length E18-C1 versus noncanonical E18-C2/C3/C4, RE partners, and IGRs in indicated human cancer cell lines. d, Heatmap showing silencing of FGFR2 variants in indicated human cancer cell lines using small interfering (si) RNAs. Cells were transfected with the following siRNAs: non-targeting siRNAs (siCo), siRNAs targeting shared exons among FGFR2 isoforms (siFGFR2E5,E9,E15), siRNAs specifically targeting canonical E18-C1 of FGFR2FL (siFGFR2E18-C1) or E18-C3 of truncated FGFR2E18-C3 (siFGFR2E18-C3), or siRNAs specifically targeting the FGFR2-COL14A1 fusion (siFGFR2-COL14A1). Silencing of specific FGFR2 variants was detected with RT-qPCR using primers spanning indicated cDNA segments. Expression of each cDNA segment is normalized to USF1 expression and cDNA segment expression in siCo condition of each cell line (average of siCo#1 and siCo#2). Data are represented as mean of n = 3 technical replica per group. Data represent 1 replica of 2 independent experiments. e, f, Representative images of 6-well plate wells at 8 days post treatment start (e) and cell density quantifications over 8 days (f) of 2D-grown indicated cell lines treated with vehicle or 100 nM AZD4547, pemigatinib, BGJ398, or debio-1347 or (co)-transfected with siCo, siFGFR2E5, siFGFR2E9, siFGFR2E15, siFGFR2E18-C1, siFGFR2E18-C3, and/or siFGFR2-COL14A1. Data in f represent n = 6 independent replica collected across 1 experiment (MCF7, siRNA treatments), n = 10 independent replica collected across 2 independent experiments (KATO-III vehicle, AZD4547, and siRNA treatments), or n = 5 independent replica collected across 2 independent experiments (other cell lines and/or treatment conditions). g, Heatmap showing silencing of FGFR2 isoforms using indicated siRNAs in KATO-III cells expressing GFP or indicated FGFR2 variants. Validation of overexpression of FGFR2 variants using RT-qPCR is in Supplementary Table 4. FGFR2K517R variants encode KD-dead FGFR2 variants. siFGFR2E5 targets endogenous FGFR2 transcripts and FGFR2 transcripts derived from lentiviral constructs. Other siRNAs specifically target endogenous FGFR2 transcripts. Silencing of specific FGFR2 variants was detected with RT-qPCR using primers spanning indicated cDNA segments. E4–E5 and E14–E16 primers detect endogenous FGFR2 transcripts and FGFR2 transcripts derived from lentiviral constructs. E1–E2 (5′-UTR), E18-C1 (3′-UTR), and E18-C3 (3′-UTR) primers specifically detect endogenous FGFR2 transcripts. E18-C1–T2A, E17–T2A, and T2A–Puro primers specifically detect FGFR2 transcripts derived from lentiviral constructs. Log2-transformed expression of each cDNA segment is normalized to USF1 expression and cDNA segment expression in siCo-treated GFP-expressing cells (average of siCo#1 and siCo#2). Data are are represented as mean of n = 3 technical replica per group of 1 experiment. h, i, Representative images of 6-well plate wells at 8 days post treatment start (h) and cell density quantifications over 8 days (i) of 2D-grown KATO-III cells expressing GFP or indicated FGFR2 variants and treated with vehicle, 100 nM AZD4547, or 100 nM pemigatinib or transfected with siCo, siFGFR2E5, siFGFR2E9, siFGFR2E15, siFGFR2E18-C1, or siFGFR2E18-C3. Data in i represent n = 6 independent replica per group collected across 1 experiment. Source data
Extended Data Fig. 15
Extended Data Fig. 15. PDXs expressing FGFR2ΔE18 variants are sensitive to debio-1347.
a, Best percentage change from baseline tumour volume in patient-derived xenograft (PDX) models (n = 36) engrafted in female NOD-SCID (BL5001, BL5002) or BALB/c Nude (all other PDX models) mice and treated daily orally with vehicle or debio-1347 (n = 3 mice per PDX model and treatment group). Coloured bars indicate identified FGF/FGFR2 alterations detailed in Fig. 4c. b, c, Growth curves of indicated PDXs models engrafted in NOD-SCID or BALB/c Nude mice and treated daily orally with vehicle or debio-1347 (ES0204, Li0612, LI1035, BN2289, 60 mg/kg; GA1224, KI0551, 80 mg/kg; BL5001, day 1-14, 40 mg/kg; day 15-25, 60 mg/kg; n = 3 mice per PDX model and treatment group). d, Debio-1347 ΔT/ΔC response ratios in PDXs with FGF3/4/19 amp (n = 3) versus normal CN (n = 33). e, Debio-1347 ΔT/ΔC response ratios in PDXs with FGFR1 amp (n = 3), FGFR2 amp (n = 4), or FGFR3 amp (n = 1) versus normal CN (n = 28). f, Correlations of FGFR1, FGFR2, FGFR3, FGFR4, or composite FGFR expression versus debio-1347 ΔT/ΔC response ratios across PDXs. Composite FGFR expression was defined as high, if normalized expression > 3. g, Debio-1347 ΔT/ΔC response ratios in PDXs expressing E18-truncated FGFR2 (n = 6) or FGFR3 (n = 1) versus no truncation (n = 29). Data are represented as mean ± s.d. (a, b) or as median (centre line) ± IQR (25th to 75th percentile, box) and IQR ± 1.5 x IQR (whiskers) (d, f). P values were calculated with two-tailed unpaired Student’s t-tests (a), one-tailed two-way ANOVA and FDR multiple-testing corrections using the two-stage step-up method from Benjamini, Krieger, and Yekutieli (b, c), two-tailed Wilcoxon rank-sum tests (d, g), one-tailed one-way ANOVA and Tukey’s multiple-testing corrections (e), or two-tailed t-transformations of Pearson’s R correlation coefficients (f). Source data

Similar articles

Cited by

References

    1. Katoh M. Fibroblast growth factor receptors as treatment targets in clinical oncology. Nat. Rev. Clin. Oncol. 2019;16:105–122. - PubMed
    1. Pearson A, et al. High-level clonal FGFR amplification and response to FGFR inhibition in a translational clinical trial. Cancer Discov. 2016;6:838–851. - PMC - PubMed
    1. Van Cutsem E, et al. A randomized, open-label study of the efficacy and safety of AZD4547 monotherapy versus paclitaxel for the treatment of advanced gastric adenocarcinoma with FGFR2 polysomy or gene amplification. Ann. Oncol. 2017;28:1316–1324. - PubMed
    1. Chae YK, et al. Phase II study of AZD4547 in patients with tumors harboring aberrations in the FGFR pathway: results from the NCI-MATCH trial (EAY131) subprotocol W. J. Clin. Oncol. 2020;38:2407–2417. - PMC - PubMed
    1. Tabernero J, et al. Phase I dose-escalation study of JNJ-42756493, an oral pan–fibroblast growth factor receptor inhibitor, in patients with advanced solid tumors. J. Clin. Oncol. 2015;33:3401–3408. - PubMed

Publication types

MeSH terms

Substances