. 2022 Nov;27(11):4770-4780.
doi: 10.1038/s41380-022-01713-5. Epub 2022 Aug 10.

MEK1/2 inhibition rescues neurodegeneration by TFEB-mediated activation of autophagic lysosomal function in a model of Alzheimer's Disease

Affiliations

MEK1/2 inhibition rescues neurodegeneration by TFEB-mediated activation of autophagic lysosomal function in a model of Alzheimer's Disease

Yoon Sun Chun et al. Mol Psychiatry. 2022 Nov.

Abstract

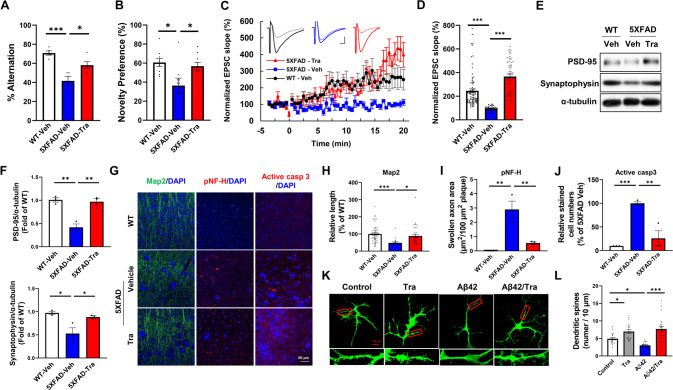
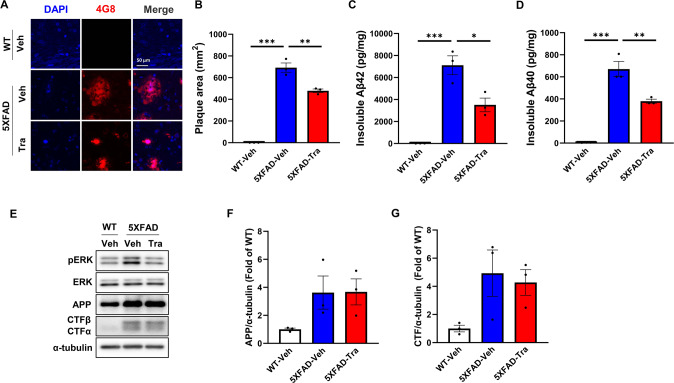
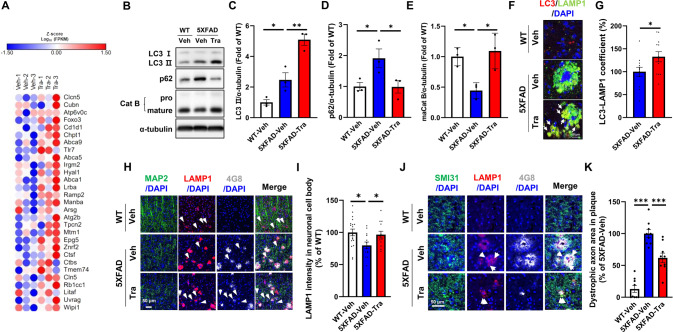
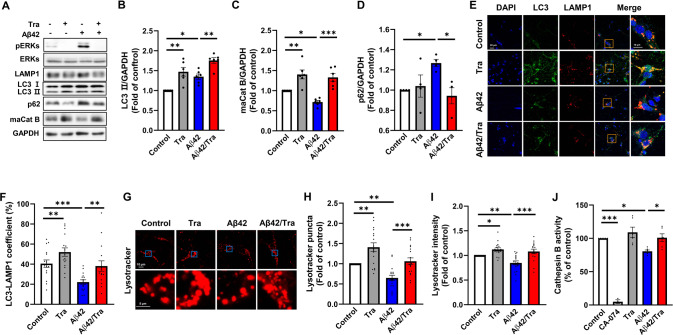
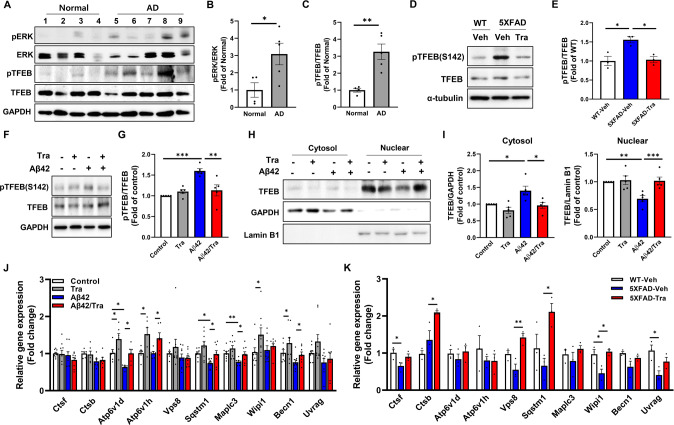
Alzheimer's Disease (AD) is a progressive neurodegenerative disorder, which is characterized by cognitive deficit due to synaptic loss and neuronal death. Extracellular amyloid β plaques are one of the pathological hallmarks of AD. The autophagic lysosomal pathway is the essential mechanism to maintain cellular homeostasis by driving clearance of protein aggregates and is dysfunctional in AD. Here, we showed that inhibiting MEK/ERK signaling using a clinically available MEK1/2 inhibitor, trametinib (GSK1120212, SNR1611), induces the protection of neurons through autophagic lysosomal activation mediated by transcription factor EB (TFEB) in a model of AD. Orally administered trametinib recovered impaired neural structures, cognitive functions, and hippocampal long-term potentiation (LTP) in 5XFAD mice. Trametinib also reduced Aβ deposition via induction of autophagic lysosomal activation. RNA-sequencing analysis revealed upregulation of autophagic lysosomal genes by trametinib administration. In addition, trametinib inhibited TFEB phosphorylation at Ser142 and promoted its nuclear translocation, which in turn induced autophagic lysosomal related genes, indicating that trametinib activates the autophagic lysosomal process through TFEB activation. From these observations, we concluded that MEK inhibition provides neuronal protection from the Aβ burden by increasing autophagic lysosomal activity. Thus, MEK inhibition may be an effective therapeutic strategy for AD.


Conflict of interest statement

MYK and SH are inventors of PCT/KR2017/013444 and its family patent applications regarding the use of trametinib for neurodegenerative disease. MYK, TJH, and SH are stockholders of Genuv Inc. The authors declare no competing interest.

Figures

Fig. 1
Fig. 1. Trametinib rescues cognitive deficits and synaptic function in 5XFAD mice.
A The 5-months 5XFAD transgenic mice were administered vehicle or 0.1 mg/kg of trametinib for 10 weeks by oral gavage once a day. At the end of the administration, Y-maze test was performed and the average ratio for the alternation in 3 min was calculated. Data were presented as the mean ± S.E.M. One-way ANOVA followed by Dunnett’s post hoc analysis (F(2, 11) = 16.5, p = 0.0005; n = 4–5). B Novel object recognition test was performed and the average ratio of the time of investigations in 10 min was calculated. Data were presented as the mean ± S.E.M. One-way ANOVA followed by Dunnett’s post hoc analysis (F(2, 24) = 5.335, p = 0.0121; n = 9). C Normalized EPSC slope in LTP recordings from the CA1 recording electrode. The baseline was stabilized for 3 min before TBS induction (red arrow) and the following 20 min recording in WT-vehicle (black circle; n = 8 slices from 6 mice), 5XFAD-vehicle (blue square; n = 4 slices from 3 mice), and 5XFAD-trametinib (red triangle; n = 6 slices from 3 mice). Representative EPSCs are displayed for each type with baseline (pale color) and response at 20 min (vivid color). Scalebar: 20 ms, 100pA. D Average of normalized EPSC slopes from 15.5 min to 20 min. Data were presented as the mean ± S.E.M. One-way ANOVA followed by Dunnett’s post hoc analysis (F(2, 153) = 36.08, p < 0.001). E Representative western blot analysis of 5XFAD mice brain cortex lysates for PSD-95, and synaptophysin. α-tubulin was used as loading control. F Bars correspond to densitometric analysis of levels of PSD-95 (F(2, 6) = 25.77, p = 0.0011; n = 3) and synaptophysin (F(2, 6) = 9.836, p = 0.0128; n = 3). Normalized to the WT-vehicle group. Data were presented as the mean ± S.E.M. One-way ANOVA followed by Dunnett’s post hoc analysis. G Immunofluorescence staining images of MAP2, pNF-H, active caspase 3 in the cortex layer V of 5XFAD mice. Scale bars, 50 μm. H-J Quantification of neurite length (F(2, 98) = 7.385, p = 0.001) (H), pNF-H-positive bulb-like swollen axon area (F(2, 6) = 20.57, p = 0.0021) (I), and number of apoptotic cells (F(2, 6) = 25.73, p = 0.0011) (J) in the cortex layer V (n = 3 sagittal sections from each mouse, n = 3 mice per group). Normalized to the WT-vehicle group. Data were presented as the mean ± S.E.M. One-way ANOVA followed by Dunnett’s post hoc analysis. K Primary hippocampal neurons (DIV22) were transfected with GFP plasmid DNA, treated with 100 nM trametinib and/or 5 μM Aβ42 oligomer for 48 h, and dendritic spine density were measured. L Quantification of number of dendritic spines. Scale bar = 20 μm. Data were presented as the mean ± S.E.M. Two-way ANOVA followed by Dunnett’s post hoc analysis (F(3, 55) = 20.12, p < 0.001; n = 17). *p < 0.05; **p < 0.01; ***p < 0.001.
Fig. 2
Fig. 2. Trametinib decreases amyloid β deposition in 5XFAD mice.
A Representative images of cortex layer V immunostained with the Aβ antibody (clone 4G8) (n = 3 sagittal sections from each mouse, n = 3 mice per group). Scale bars, 50 μm. B Quantification of plaque area. Data were presented as the mean ± S.E.M. One-way ANOVA followed by Dunnett’s post hoc analysis (F(2, 6) = 178.1, p < 0.001). C, D The levels of insoluble Aβ42 (F(2, 6) = 34.07, p = 0.0005) (C) and Aβ40 (F(2, 6) = 66.11, p < 0.001) (D) in cortex of 5XFAD mice were measured by ELISA. Data were presented as the mean ± S.E.M. One-way ANOVA followed by Dunnett’s post hoc analysis. E Representative western blot analysis of 5XFAD mice brain cortex lysates for indicated proteins. α-tubulin was used as loading control. F Bars correspond to densitometric analysis of level of APP. Data were presented as the mean ± S.E.M. One-way ANOVA followed by Dunnett’s post hoc analysis (F(2, 6) = 3.095, p = 0.1193; n = 3). G Bars correspond to densitometric analysis of level of CTF (F(2, 6) = 3.673, p = 0.0909; n = 3). Data were presented as the mean ± S.E.M. One-way ANOVA followed by Dunnett’s post hoc analysis. *p < 0.05; **p < 0.01; ***p < 0.001 versus 5XFAD-Veh group.
Fig. 3
Fig. 3. Trametinib increases autophagic lysosomal activity in 5XFAD mice.
A Analysis of the brain lysates from normal mice administered with trametinib for 2 weeks. Heatmap of RNA-Seq for 29 selected genes from autophagic lysosomal genes. The heatmap of RNA-Seq shows log10 FPKM (fragments per kilobase per million reads mapped) values for 29 selected genes (rows) and 6 samples (vehicle or trametinib administered, n = 3 in each group). Color corresponds to per-gene z-score that is calculated from log10 FPKM and represented using Morpheus heatmap program. B Representative western blot analysis of 5XFAD mice brain cortex lysates for indicated proteins. C Bars correspond to densitometric analysis of LC3II/α-tubulin. Data were presented as the mean ± S.E.M. One-way ANOVA followed by Dunnett’s post hoc analysis (F(2, 6) = 33.8, p = 0.0005; n = 3). D Bars correspond to densitometric analysis of p62. Data were presented as the mean ± S.E.M. One-way ANOVA followed by Dunnett’s post hoc analysis (F(2, 6) = 5.603, p = 0.0424; n = 3). E Bars correspond to densitometric analysis of cathepsin B. Data were presented as the mean ± S.E.M. One-way ANOVA followed by Dunnett’s post hoc analysis (F(2, 6) =  8.872, p = 0.0161; n = 3). F Immunofluorescence images of LC3, and LAMP1 in cortex layer V. Arrows indicate co-stained regions (n = 3 sagittal sections from each mouse, n = 3 mice per group). Scale bars, 10 μm. G Quantification of the co-stained ratio with LC3 and LAMP1. Data were presented as the mean ± S.E.M. Student’s t-test (p = 0.0381). H-K The 9-month-old 5XFAD mice were administered either vehicle or 0.1 mg/kg of trametinib for 6 weeks by oral gavage once a day. Immunofluorescence staining images of Aβ, LAMP1, and MAP2 in the cortex of 5XFAD mice (H). Scale bars, 50 μm. Quantification of LAMP1 intensity within cell body of MAP2 + neurons (I) (F(2, 38) = 4.320, p = 0.0204). Immunofluorescence staining images of Aβ, LAMP1, and SMI31 in the cortex of 5XFAD mice (J). Scale bars, 50  μm. Quantification of the area of dystrophic axon within plaque (K) (F(2, 24) = 46.67, p < 0.0001). Data were presented as the mean ± S.E.M. One-way ANOVA followed by Dunnett’s post hoc analysis. *p < 0.05; **p < 0.01; ***p < 0.001 versus 5XFAD-Veh group.
Fig. 4
Fig. 4. Trametinib increases autophagic flux in primary cortical neuron.
A Representative western blot analysis of pERKs, ERKs, LAMP1, LC3, p62, and cathepsin B from cell lysates of primary cortical neuron. GAPDH was used as loading control. B Bars correspond to densitometric analysis of level of LC3II/ GAPDH. Data were presented as the mean ± S.E.M. Two-way ANOVA followed by Dunnett’s post hoc analysis (F(3, 15) = 15.93, p < 0.0001; n = 5). C Bars correspond to densitometric analysis of level of cathepsin B. Data were presented as the mean ± S.E.M. Two-way ANOVA followed by Dunnett’s post hoc analysis (F(3, 15) = 17.92, p < 0.0001; n = 5). D Bars correspond to densitometric analysis of level of p62. Data were presented as the mean ± S.E.M. Two-way ANOVA followed by Dunnett’s post hoc analysis (F(3, 9) = 4.848, p = 0.0283; n = 4). E Quantification of the co-stained ratio with LC3 and LAMP1. Scale bars, 20 μm or 10 μm. F Quantification of the co-stained ratio with LC3 and LAMP1. Data were presented as the mean ± S.E.M. Two-way ANOVA followed by Dunnett’s post hoc analysis (F(3, 44) = 10.18, p < 0.0001; n = 16). G Images of lysotracker staining in primary cortical neuron. Scale bars, 10 μm or 5 μm. H Quantification of number of lysotracker puncta of cells. Data were presented as the mean ± S.E.M. Two-way ANOVA followed by Dunnett’s post hoc analysis (F(3, 48) = 17.1, p < 0.0001; n = 17). I Quantification of intensity of lysotracker of cells. Data were presented as the mean ± S.E.M. Two-way ANOVA followed by Dunnett’s post hoc analysis (F(3, 48) = 12.99, p < 0.0001; n = 17). J Enzymatic activity of cathepsin B in primary cortical neuron was evaluated in three independent experiments. CA-074, cathepsin B inhibitor, was used as a negative control. Data were presented as the mean ± S.E.M. Two-way ANOVA followed by Dunnett’s post hoc analysis (F(4, 17) = 55.28, p < 0.0001). *p < 0.05; **p < 0.01; ***p < 0.001.
Fig. 5
Fig. 5. Trametinib regulates the expression of TFEB-regulated autophagy-lysosome genes.
A Representative western blot analysis of Human brain lysates for indicated proteins. B Bars correspond to densitometric analysis of level of pERK/ERK. Data were presented as the mean ±  S.E.M. Student’s t-test (p = 0.0349; n = 4–5). C Bars correspond to densitometric analysis of level of pTFEB/TFEB. Data were presented as the mean ± S.E.M. Student’s t-test (p = 0.0036; n = 4–5). D Representative western blot analysis of 5XFAD mice brain cortex lysates for indicated proteins. E Bars correspond to densitometric analysis of pTFEB/TFEB. Data were presented as the mean ± S.E.M. One-way ANOVA followed by Dunnett’s post hoc analysis (F(2, 6)  = 10.57, p = 0.0108; n = 3). F Representative western blot analysis of pTFEB(S142) and TFEB from cell lysates of primary cortical neuron. GAPDH was used as loading control. G Bars correspond to densitometric analysis of level of pTFEB(S142). Data were presented as the mean ± S.E.M. Two-way ANOVA followed by Dunnett’s post hoc analysis (F(3, 12) = 15.49, p = 0.0002; n = 5). H Representative western blot analysis of TFEB in the cytosolic and nuclear fractions of primary cortical neuron. GAPDH and lamin B1 were used as cytosolic and nuclear fractions marker, respectively. I Bars correspond to densitometric analysis of level of TFEB in the cytosolic (F(3, 12) = 7.834, p = 0.0037; n = 5) and nuclear fractions (F(3, 12) = 13.12, p = 0.0004; n = 5). Data were presented as the mean ± S.E.M. Two-way ANOVA followed by Dunnett’s post hoc analysis. J qPCR of TFEB target genes in primary cortical neuron (F(3, 24) = 1.234, p = 0.3191, Ctsf; F(3, 15) = 2.644, p = 0.0871, Ctsb; F(3, 15) = 12.61, p = 0.0002, Atp6v1d; F(3, 15) = 6.137, p = 0.0062, Atp6v1h; F(3, 24) = 1.107, p = 0.365, Vps8; F(3, 24) = 10.33, p = 0.0001, Sqstm1; F(3, 24) = 10.90, p = 0.0001, Maplc3; F(3, 24) = 3.08, p = 0.0466, Wipi1; F(3, 22) = 9.804, p = 0.0003, Becn1; F(3, 24) = 3.536, p = 0.0291, Uvrag; n = 6–9). Data were presented as the mean ± S.E.M. Two-way ANOVA followed by Dunnett’s post hoc analysis. K Expression analysis of the TFEB target genes by qPCR in the cortex of 5XFAD (F(2, 6) = 4.678, p = 0.0596, Ctsf; F(2, 6) = 13.98, p = 0.0056, Ctsb; F(2, 6) = 0.6408, p = 0.5595, Atp6v1d; F(2, 6) = 0.6372, p = 0.5611, Atp6v1h; F(2, 6) = 13, p = 0.0066, Vps8; F(2, 6) = 6.976, p = 0.0272, Sqstm1; F(2, 6) = 1.042, p = 0.4089, Maplc3; F(2, 6) = 9.417, p = 0.0141, Wipi1; F(2, 6) = 3.874, p = 0.0831, Becn1; F(2, 6) = 6.938, p = 0.0275, Uvrag; n = 3). Data were presented as the mean ± S.E.M. One-way ANOVA followed by Dunnett’s post hoc analysis. *p < 0.05; **p < 0.01; ***p < 0.001.

Similar articles

Cited by

References

    1. Holtzman DM, Morris JC, Goate AM. Alzheimer’s disease: the challenge of the second century. Sci Transl Med. 2011;3:77sr1. - PMC - PubMed
    1. Perl DP. Neuropathology of Alzheimer’s disease. Mt Sinai J Med. 2010;77:32–42. - PMC - PubMed
    1. Jellinger KA. Basic mechanisms of neurodegeneration: a critical update. J Cell Mol Med. 2010;14:457–87.. - PMC - PubMed
    1. Sala Frigerio C, De Strooper B. Alzheimer’s Disease Mechanisms And Emerging Roads To Novel Therapeutics. Annu Rev Neurosci. 2016;39:57–79. - PubMed
    1. Kam TI, Gwon Y, Jung YK. Amyloid beta receptors responsible for neurotoxicity and cellular defects in Alzheimer’s disease. Cell Mol Life Sci. 2014;71:4803–13.. - PMC - PubMed

MeSH terms

Substances