. 2022 Aug;608(7922):360-367.
doi: 10.1038/s41586-022-05023-2. Epub 2022 Aug 10.

Spatially resolved clonal copy number alterations in benign and malignant tissue

Affiliations

Spatially resolved clonal copy number alterations in benign and malignant tissue

Andrew Erickson et al. Nature. 2022 Aug.

Abstract

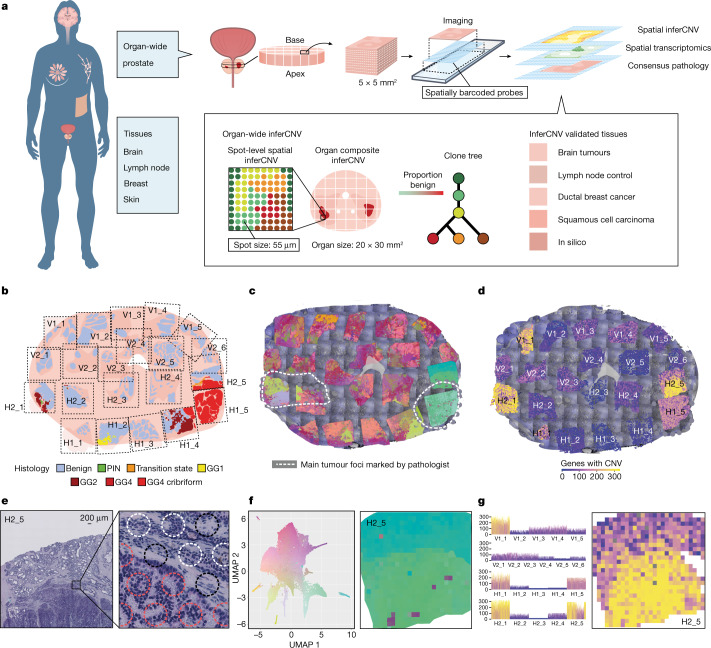
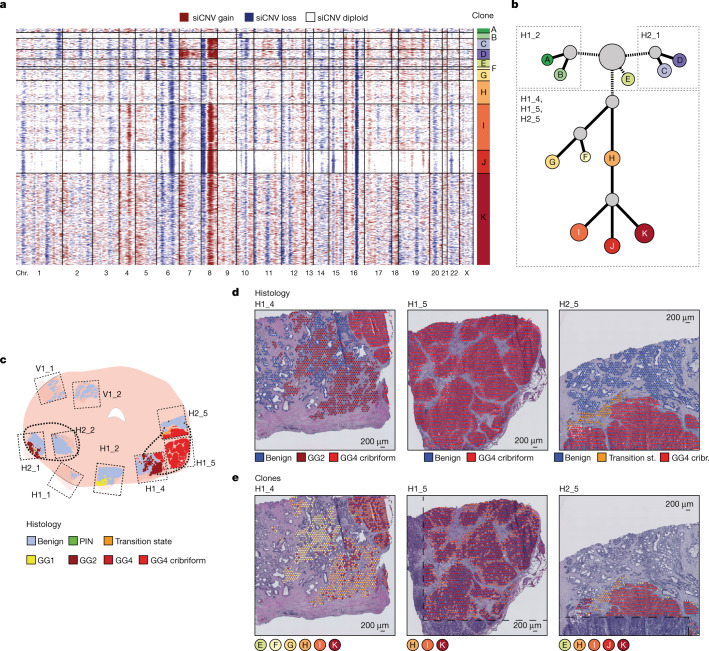
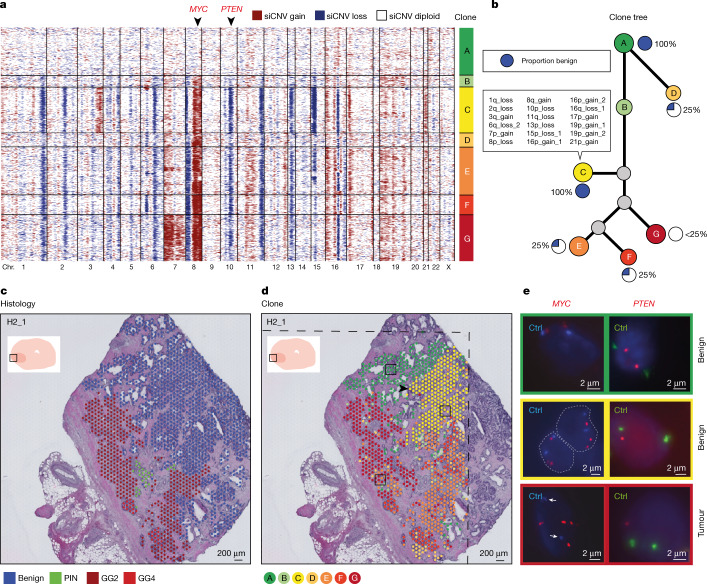
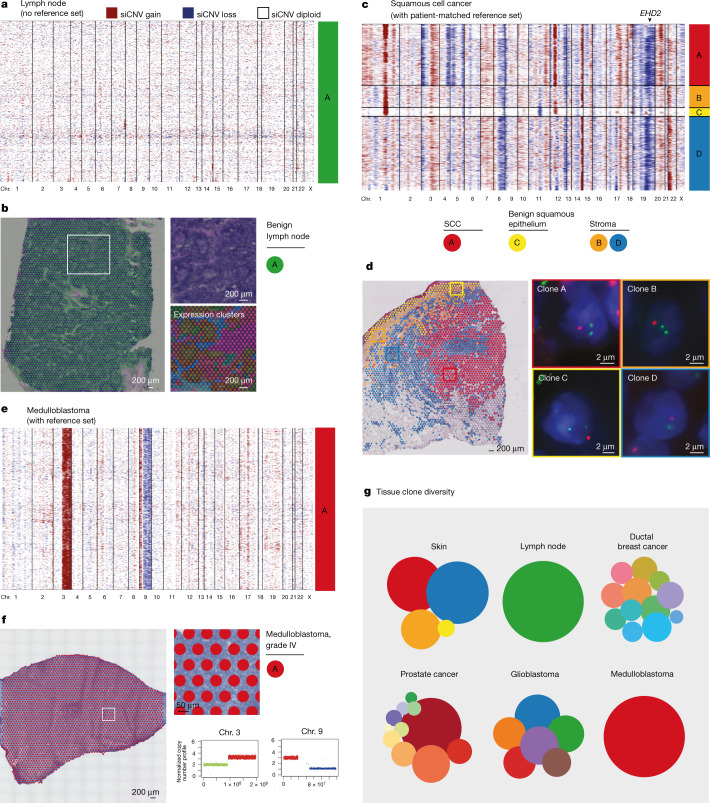
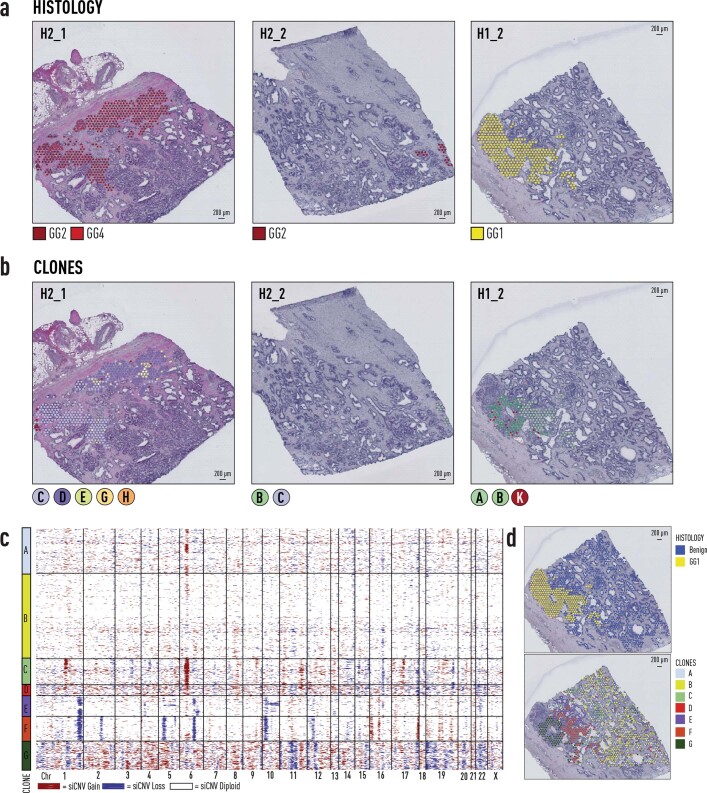
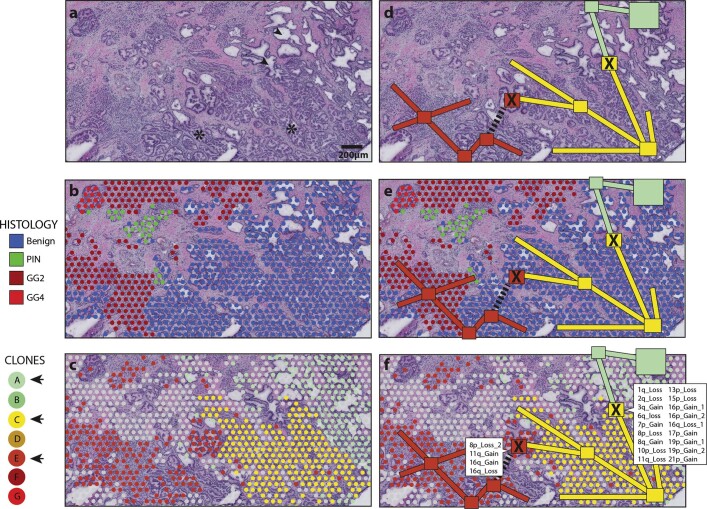
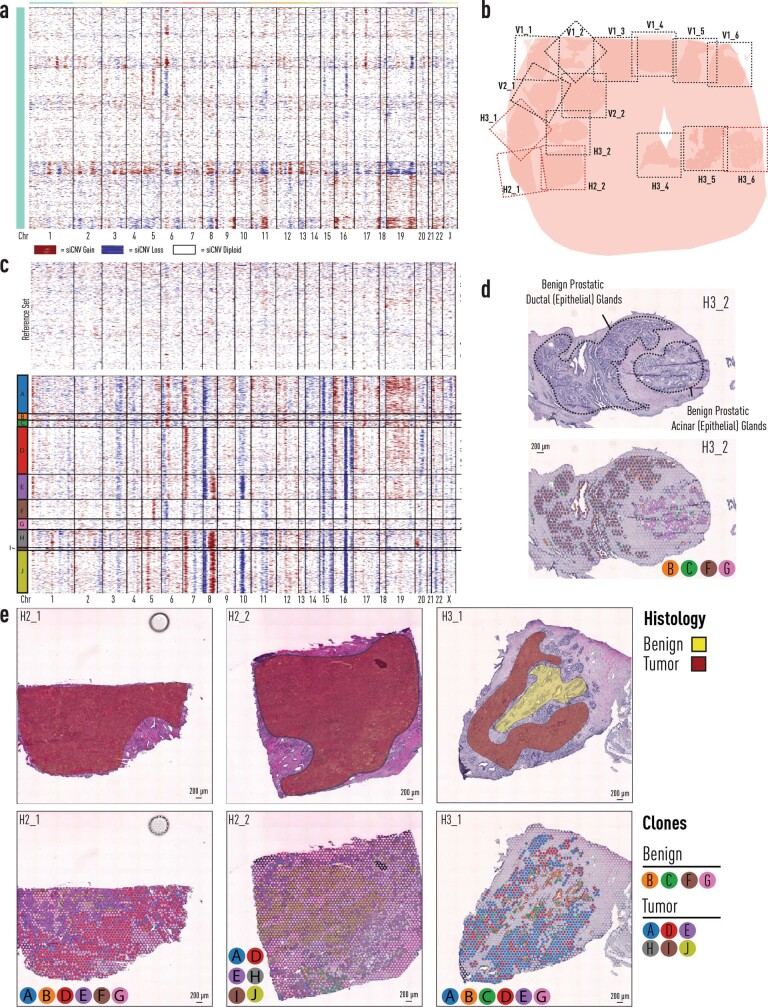
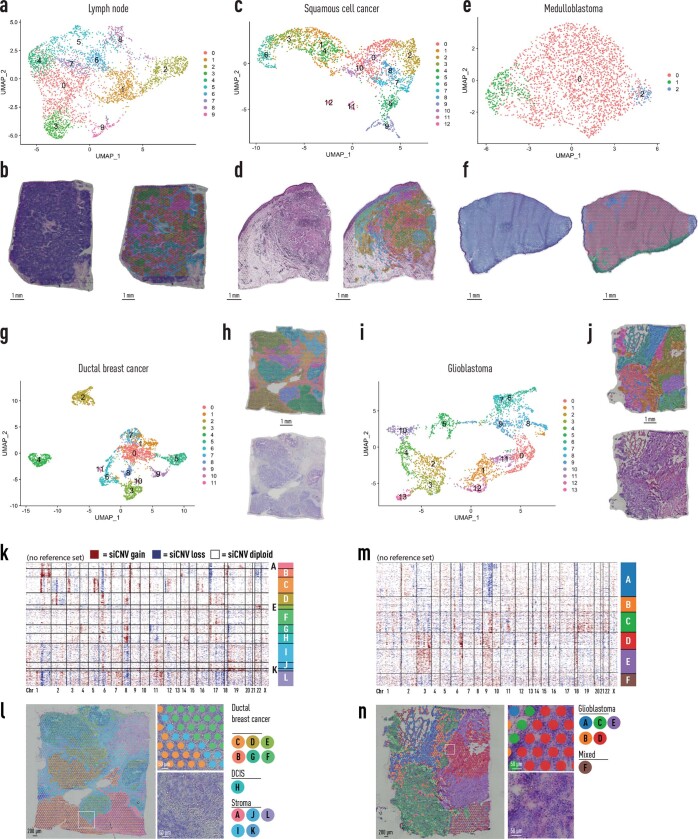
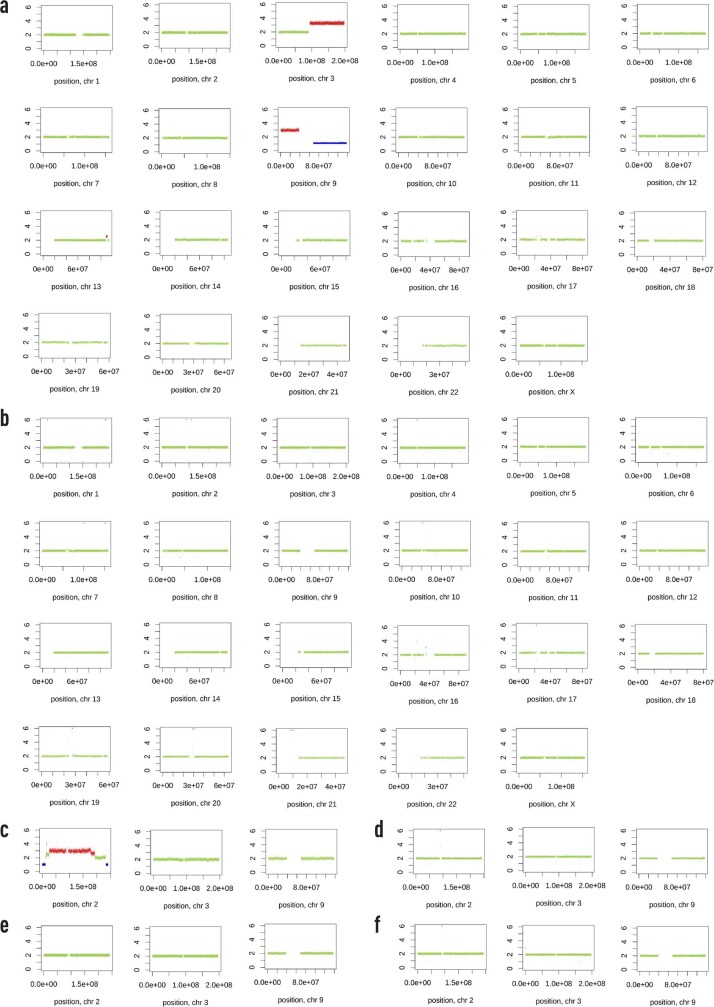
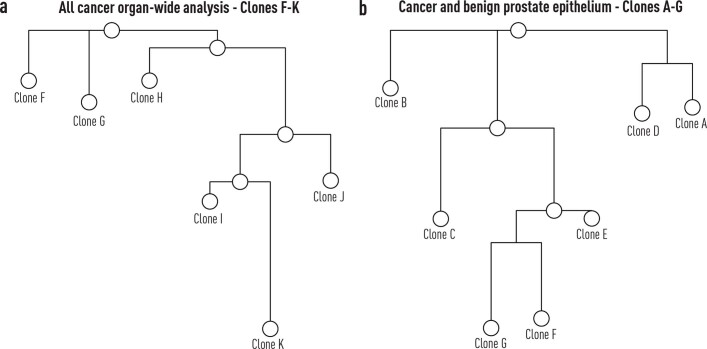
Defining the transition from benign to malignant tissue is fundamental to improving early diagnosis of cancer1. Here we use a systematic approach to study spatial genome integrity in situ and describe previously unidentified clonal relationships. We used spatially resolved transcriptomics2 to infer spatial copy number variations in >120,000 regions across multiple organs, in benign and malignant tissues. We demonstrate that genome-wide copy number variation reveals distinct clonal patterns within tumours and in nearby benign tissue using an organ-wide approach focused on the prostate. Our results suggest a model for how genomic instability arises in histologically benign tissue that may represent early events in cancer evolution. We highlight the power of capturing the molecular and spatial continuums in a tissue context and challenge the rationale for treatment paradigms, including focal therapy.


Conflict of interest statement

M.H., M.M., R.M., L.K., A.A., L.L., L.A.G., K.T. and J.L. are scientific consultants to 10x Genomics, Inc.

Figures

Fig. 1
Fig. 1. Organ-wide spatial determination of transcript and CNV status.
a, For organ-wide assessment, axial segments of the prostate were divided into 5 × 5 mm2 blocks for spatial transcriptomic analysis with spatially barcoded probes. The resulting spatial gene expression profile was accompanied by an inferred copy number profile supported by spot-by-spot consensus pathology calls. Copy number features were used to detect clonal groups and instruct phylogenetic tree construction. Tissue-specific analyses of multiple phenotypes were performed. b, Histology status for each organ-wide section. Black dashed lines represent the area covered by the spatial transcriptomics array surface. GG, International Society of Urological Pathology (ISUP) Gleason ‘grade group’; PIN, prostatic intra-epithelial neoplasia. c, Spatial distribution of gene expression (see f). d, Spatial distribution of summed copy number events (see g). e, Representative spot-level consensus pathology for section H2_5. Red circles indicate spots with ≥50% cancer cells, white circles indicate spots with ≥50% benign epithelium and black circles indicate spots with ≤50% of a single cell type. The diameter of the circles represents 55 μm. f, UMAP principal-component analysis of GEFs with a representative close-up for section H2_5. g, Total copy number events for each section with a representative close-up for section H2_5.
Fig. 2
Fig. 2. Specific somatic copy number alterations in all cancer organ-wide analysis.
a, Genome-wide derived analysis (siCNVs) for all Visium spots harbouring tumour from prostate patient 1. Clonal groupings of spots (with approximately 10–15 cells each) were determined by hierarchical clustering. Chr., chromosome. b, Phylogenetic clone tree of the tumour clones from a, with grey clones representing unobserved, inferred common ancestors. Clone circle area is proportional to the number of spots and branch length was determined by weighted quantity of CNVs (both on a logarithmic scale). siCNV changes for each clone are available in Supplementary Table 1. c, Representation of all tissue sections from prostate patient 1. Thicker black lines denote original boundaries annotated by initial clinical pathology. d, Consensus epithelial histological annotations for sections H1_4, H1_5 and H2_5, corresponding to the right tumour focus. e, Spatial visualization of tumour clones (from a). The dashed lines mark areas where no spatial transcriptomics data were obtained owing to these regions being outside of barcoded array surfaces.
Fig. 3
Fig. 3. Somatic events in both cancer and benign prostate epithelium.
a, Genome-wide derived CNV analysis (siCNVs) for each barcoded high-resolution spatial transcriptomic spot from section H2_1, which contained a mixture of tumour and benign epithelia (red, gain; blue, loss). Clonal groupings of spots (approximately 10–15 cells each) were determined by hierarchical clustering. On the basis of SNV analysis (Extended Data Fig. 7), clone A probably represents a polyclonal population of diploid cells. b, Phylogenetic clone tree of all clones from a. The proportion of benign epithelial cells in each clone was as indicated. Specific CNV locations unique to clone C are listed (summarized by the number of the chromosome where the event was located, p/q arm and gain/loss; the remainder of siCNV changes are given in Supplementary Table 2). c, Spatial visualization of the histopathological status of each spot. Each spot was assessed by two pathologists for consensus annotation, with only spots with >50% cellularity included. d, Spatial visualization of the clone status of each spot. Clonal groupings cross histological boundaries. The branching point of the prostatic duct (arrowhead) represents a possible site of somatic events arising in clone C (see also Extended Data Fig. 6). The dashed lines mark areas where no spatial transcriptomics data were obtained owing to the region being outside of barcoded array surfaces. e, FISH validation of two siCNVs: MYC, from chromosome 8q, and PTEN, from chromosome 10p (arrowheads in a). Control probes (Ctrl) targeted centromeres for chromosomes 8 and 10, respectively. All FISH panels depict single cells with one exception, where dashed grey lines highlight the nucleus borders and the presence of two cells. White arrows indicate the location of centromere controls.
Fig. 4
Fig. 4. Somatic copy number alterations in cancer and benign histologies.
a,b, Benign lymph node with distinct histological features and gene expression heterogeneity (b) harbouring no detected copy number alterations (a). Gene expression clusters were determined by UMAP analysis in b. c,d, Skin containing SCC (clone A, red) as well as benign squamous epithelium (clone C, yellow). A subset of somatic events visualized in cancer clone A are also detected in adjacent benign epithelial clone C. d, FISH validation of the siCNV encompassing EHD2 on chromosome 19q (arrowhead in c). e,f, Monoclonal childhood medulloblastoma. siCNVs on chromosomes 3 and 9 (e) were corroborated by copy number calls from WGS (f, lower right). g, Clone distribution for each tissue type. Circle area corresponds to the number of spots per clone. Results from ductal breast cancer and glioblastoma are available in Extended Data Fig. 11.
Extended Data Fig. 1
Extended Data Fig. 1. Comparison of phylograms created from whole genome sequencing CNVs and iCNV’s.
a, Comparison of single tumour cells with co-isolated DNA and RNA (Han et al., Genome Res 2018). Colours correspond to individual cell lines (yellow: SKBR3, green: HCC827, and light blue: MCF7). Entanglement of the phylograms was 0.11 (an entanglement value of 1 corresponds with full entanglement of two phylograms, whereas an entanglement value of 0 corresponds with no entanglement). b Phylogeny from patient A21, as published and reproduced from Gundem et al., Nature, 2015. Transcript data were available only for a subset of specimens. c, Phylogeny from patient 499, as published and reproduced from Hong et al., Nat. Comms, 2015. Transcript data available for a subset of specimens (used to reproduce phylogenetic tree by inferCNV).
Extended Data Fig. 2
Extended Data Fig. 2. Generating and running inferCNV on synthetic data.
a, Schematic overview of the generative process used to produce artificial spatial data. 1) First a set of seeding cells (red and blue circles) are placed in a defined tissue domain (square), every seeding cell hosts one unique copy number event. 2) The cells are allowed to “grow” within the tissue domain until the number of cells in the domain exceeds a predetermined number. 3) Mutations in the genome occur stochastically during growth and as a result, subpopulations (indicated by colour) of cells with similar genomic profiles arise. 4) Unoccupied space in the tissue domain is filled with benign cells (no copy number variations), spatial capture locations are placed in a grid over the grown tissue and transcripts are “captured” from the cells overlying each spot. 5) Synthetic spatial expression data is produced together with associated ground truth genomic data (both on spot and cell level). b, Results from applying siCNV (bottom) to a set of synthetic data together with ground truth information (top), only cells residing at spots being annotated as non-benign are shown. Blue indicates a deletion event while red indicates an amplification event. The ground truth shows the genomic profiles for all cells contributing to the spots assigned to a given clone. Comparing the inferred state with the ground truth on a clone 19 level, the average accuracy across genes was 0.90 (standard deviation 0.10) c, Spatial organization of the synthetic data analysed in (b), with thumbnail of the complete cell population in the artificial tissue, each pixel corresponding to a cell. The cells’ intensity levels are proportional to their total number of associated copy number events. Circles represent the spots used to “capture” transcripts. Spots are coloured by their inferred clone identity. Note how Clone 2, predicted to have zero copy number events, is found along the borders of both foci, where there’s a mixture of benign and non-benign cells. d, siCNV outputs from simulated synthetic data of spots simulating ST 1k array (low-resolution) with 100 μm spot diameter and centre-to-centre distance of 200 μm. e, Visium (high-resolution). High resolution spots were 0.55x size of low resolution and had 5x more spots per area. The synthetic ground truth data were identical for both.
Extended Data Fig. 3
Extended Data Fig. 3. GEF directed inferCNV analysis from prostate patient 1 (high resolution Visium analysis).
a, UMAP summary of GEFs from 1k spatial transcriptomics experiments of prostate samples from patient 1. b, UMAP summary of GEFs from high resolution Visium experiments of prostate samples from patient 1. Top marker genes for each GEF are available in Supplementary Table 3, 4. c, Benign GEFs from b (high resolution) were used as a reference set for analysis of d, Tumour GEFS from b (high resolution). e, Snapshot of inferCNV profiles for chr 7 and 8 from GEF10. GEF inferCNV heterogeneity is highlighted by 3 subclones: the first harbouring no changes to chr 7 and 8, the second having a deletion and amplification in chr 8, and the last having alterations in both chr 7 and chr 8. While further subclustering of GEF10 spots using gene expression factors improved GEF to clone concordance, GEF to clone heterogeneity remained. f, Tumor GEFs distribution by siCNV clones (Fig. 2). GEF = Gene Expression Factor, chr = Chromosome, siCNV = spatial inferCNV.
Extended Data Fig. 4
Extended Data Fig. 4. Identification of a histologically benign reference set from prostate patient 1.
a, Visual selection of benign epithelial spots harbouring the least amount of inferred copy number variations, as outlined by the black box bounding box. Arrows identify dendrogram nodes corresponding to barcoded spots within the box. b, InferCNV output of the dendrogram nodes with numerical identifiers for selection corresponding to Panel a. c, Finalized benign reference set from analysis of epithelial cells in prostate patient 1, section H2_1 (Fig. 3). d, Global spatial inferCNV profiles of the selected benign reference set from panel a, the remainder of the benign not included in the reference set, altered benign (Clone C, Fig. 3), and the other Visium spots with luminal epithelial annotations (PIN, GG1, GG2, GG4, GG4 Cribriform).
Extended Data Fig. 5
Extended Data Fig. 5. Histology and clones (from Fig. 2a) for prostate patient 1.
a, Consensus pathology annotations for tumour spots from sections H2_1, H2_2, and H1_2. b, Clonal groupings of spots (approx. 10-15 cells each) determined by hierarchical clustering. c, Distinct siCNV profile of GG1 tumour focus from organscale prostate patient 1. siCNV profiling of epithelial Visium spots from section H1_2. d, Spot level histology and siCNV clone calls. GG = ISUP Gleason ‘Grade Group’, siCNV = spatial inferCNV.
Extended Data Fig. 6
Extended Data Fig. 6. DNA FISH targeting MYC and PTEN loci.
Representative images from fresh frozen prostate tissue sections obtained from patient H2.1 labelled with Cytocell MYC/8cent and PTEN/10cen probes. Three consecutive sections were used for H&E staining and FISH. Control probes labelled chromosome 8 and 10 centromeres in (green & aqua) respectively, and MYC and PTEN shown in (red). Nuclei counterstained with DAPI (dark blue).
Extended Data Fig. 7
Extended Data Fig. 7. Single nucleotide variant analysis of spatial transcriptomic data from prostate patient 1, section H2_1.
a, Summary table of alt and reference read data from clones A-G (Fig. 3) of EEF1D. b, Cartoon diagram demonstrates how clone B-G, harbor copy number gain of the same allele as evidenced by the decreased variant allele fraction (VAF). c, Summary table of alt and reference read data from clones A-G (Fig. 3) of COX6C. d, Cartoon diagram demonstrates how clone B-G, harbor copy number gain of the same allele as evidenced by the increase VAF.
Extended Data Fig. 8
Extended Data Fig. 8. Differential gene expression analyses benign, altered benign and tumour clones.
a, Differentially expressed genes from benign clone A and altered clone C. Using a two-sided Wilcoxon Rank-Sum test. b, Top 10 pathways identified by geneset enrichment analyses (GSEA) from clone A vs clone C. c, Top ranked enrichment pathway from GSEA. d, Differentially expressed genes from benign clone A and tumour clones E, F and G. Using a two-sided Wilcoxon Rank-Sum test. e, Top 10 pathways identified by GSEA from clone A vs clones E, F and G. f, Top ranked enrichment pathway from GSEA. g, Venn-Diagram of genes from differential gene expression analyses identified only in benign clone A vs altered benign clone C analysis (left), benign clone A vs tumour clones E, F and G (right).
Extended Data Fig. 9
Extended Data Fig. 9. Branching morphogenesis and somatic mosaicism in prostate epithelium.
a, Close up histology of Section H2_1 demonstrating clear ductal (e.g. arrow heads) and acinar (e.g. stars) branching patterns. b, Overlayed spot-level histology. c, Overlayed clone groupings (from Fig. 3). d-f, Possible arrangement of clonal expansion during branching morphogenesis with key mutational events (marked with X, siCNV events from Fig. 3) passed on to downstream branches. Dotted line represents presumed branch/duct not visible in two-dimensional plane.
Extended Data Fig. 10
Extended Data Fig. 10. Organscale prostate patient 2.
a, Spatial inferCNV (siCNV) profiles of histologically benign prostatic epithelial cells from 11 sections from prostate patient 2. b, Reference overview of 15 sections available for analysis: sections H2_1, H2_2, H3_1, and H3_6 harbour tumour (marked with red dotted lines). Black dotted lines represent the area covered by spatial transcriptomics array surface. c, Analysis of tumour foci in sections H3_1, H2_1 and H2_2. Analysis includes section H3_2, a non-tumour bearing section which included spatially co-localized benign spots harbouring inferred CNV alterations from panel a. d, Spatial histology and clone distribution in section H3_2 (no-tumour). Benign ductal histology (Clone F) harbours distinct inferred CNVs (chr5 amplification, chr6 deletion), not harboured in neighbouring benign acinar glands (Clone G). e, Section histology (transparent red indicates tumour, and transparent yellow denotes benign) and clones from tumour-bearing sections H3_1, H2_1, and H2_2. CNV = Copy-Number Variant, chr = chromosome.
Extended Data Fig. 11
Extended Data Fig. 11. Spatial transcriptomics and siCNV analysis of multiple sample types.
a, c, e, g, i, Transcript UMAPs of all spots labelled by cluster from human lymph node (a), human squamous cell carcinoma (c), malignant childhood brain tumour diagnosed as medulloblastoma (e) human invasive ductal breast carcinoma (g), malignant childhood brain tumour diagnosed as medulloblastoma SHH grade IV (i). b, d, f, h, j, H&E stain and unbiased cluster spots visualized spatially on tissue from human lymph node (b), human squamous cell carcinoma (d), childhood medulloblastoma (f), human invasive ductal breast carcinoma (h), human glioblastoma multiforme (j). k-n, somatic copy number alterations in breast tissue containing ductal breast cancer and DCIS (k, l) and brain tissue containing glioblastoma (m, n). While some of the samples did not have an annotated benign reference set, interestingly, unsupervised siCNV could still segment different histological clones. However, the lack of a reference set did reduce the ability to identify specific inferred CNVs.
Extended Data Fig. 12
Extended Data Fig. 12. DNA FISH targeting EHD2 locus.
Representative images from fresh frozen squamous cell carcinoma tissue sections labelled with Cytocell 19q13/19p13probe. Consecutive sections were used for H&E, DAPI staining and FISH. Control probe labelled the 19p13.2 region of chromosome 19 in green, and EHD2 is shown in red. Nuclei counterstained with DAPI (dark blue). Yellow dashed rectangles mark the clonal group B position 1 and 2. Red dashed rectangles mark the clonal group A positions 1, 2, and 3. Blue dashed rectangles mark the clonal group D positions 1, and 2. Green rectangle marks the clonal group C position 1. Predicted deletions of EHD2 gene are shown in clones A, B, C, and D. Note that the clonal groups C, and D show deletions of EHD2 gene as well as diploid cells.
Extended Data Fig. 13
Extended Data Fig. 13. Whole-genome sequencing-based copy number profiles for paediatric brain tumour patients.
a, Somatic WGS CNV profile of patient 1 diagnosed with medulloblastoma (grade IV, desmoplastic/nodular, SHH-activated) with b, match normal blood. c, Somatic WGS CNV profile of Chr 2, 3 and 9 of patient 2 diagnosed with medulloblastoma (grade IV, classic morphology, SHH-activated) with d, match normal blood. Notably inferCNV analysis on Visium data did not show any genomic variability in chr 2 but since Visium and WGS data were generated from different locations of each tumour, we speculate that the observed WGS CNV patterns in patient 2 could be due to the inherent spatial heterogeneity of DNA copy number alterations observed by others when sampling multiple sites of medulloblastoma tumours. e, Somatic WGS CNV profile of Chr 2, 3 and 9 of patient 3 diagnosed with CNS embryonal tumour (grade IV, multi-layered rosettes, NOS) with d, match normal blood. No CNV was detected by WGS in the chromosomes not displayed. WGS = Whole-genome sequencing. Chr = Chromosome. SHH = Sonic hedgehog. CNS = Central nervous system. NOS = Not otherwise specified.
Extended Data Fig. 14
Extended Data Fig. 14. Maximum parsimony reconstructions of prostate cancer clone trees.
a, Maximum parsimony tree for clones F-K from spatially proximate tumour bearing sections from sections H1_4, H1_5, and H2_5 from prostate cancer patient 1 (Fig. 2). b, Maximum parsimony tree for prostate cancer and benign epithelial clones A-G from sections H2_1 from prostate cancer patient 1 (Fig. 3). Input data to construct both trees were derived from gene-level siCNV hidden markov model data.

Comment in

References

    1. Grossmann S, et al. Development, maturation, and maintenance of human prostate inferred from somatic mutations. Cell Stem Cell. 2021;28:1262–1274. doi: 10.1016/j.stem.2021.02.005. - DOI - PMC - PubMed
    1. Ståhl PL, et al. Visualization and analysis of gene expression in tissue sections by spatial transcriptomics. Science. 2016;353:78–82. doi: 10.1126/science.aaf2403. - DOI - PubMed
    1. Milholland B, et al. Differences between germline and somatic mutation rates in humans and mice. Nat. Commun. 2017;8:15183. doi: 10.1038/ncomms15183. - DOI - PMC - PubMed
    1. Chen JZ, Gokden N, Greene GF, Mukunyadzi P, Kadlubar FF. Extensive somatic mitochondrial mutations in primary prostate cancer using laser capture microdissection. Cancer Res. 2002;62:6470–6474. - PubMed
    1. Alvarado C, et al. Somatic mosaicism and cancer: a micro-genetic examination into the role of the androgen receptor gene in prostate cancer. Cancer Res. 2005;65:8514–8518. doi: 10.1158/0008-5472.CAN-05-0399. - DOI - PubMed