. 2022 Aug;29(8):831-840.
doi: 10.1038/s41594-022-00814-7. Epub 2022 Aug 10.

A conformational switch controlling the toxicity of the prion protein

Affiliations

A conformational switch controlling the toxicity of the prion protein

Karl Frontzek et al. Nat Struct Mol Biol. 2022 Aug.

Abstract

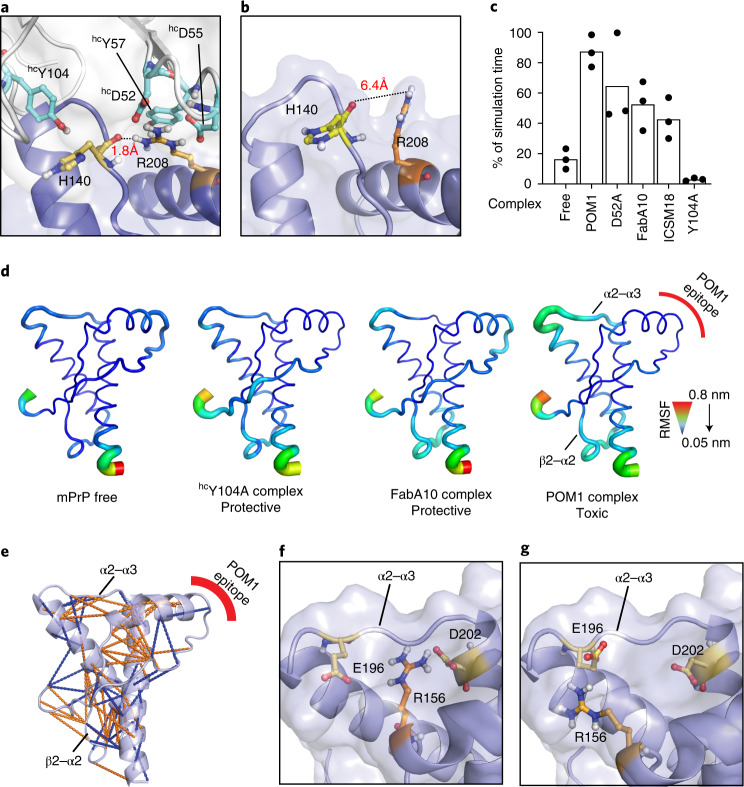
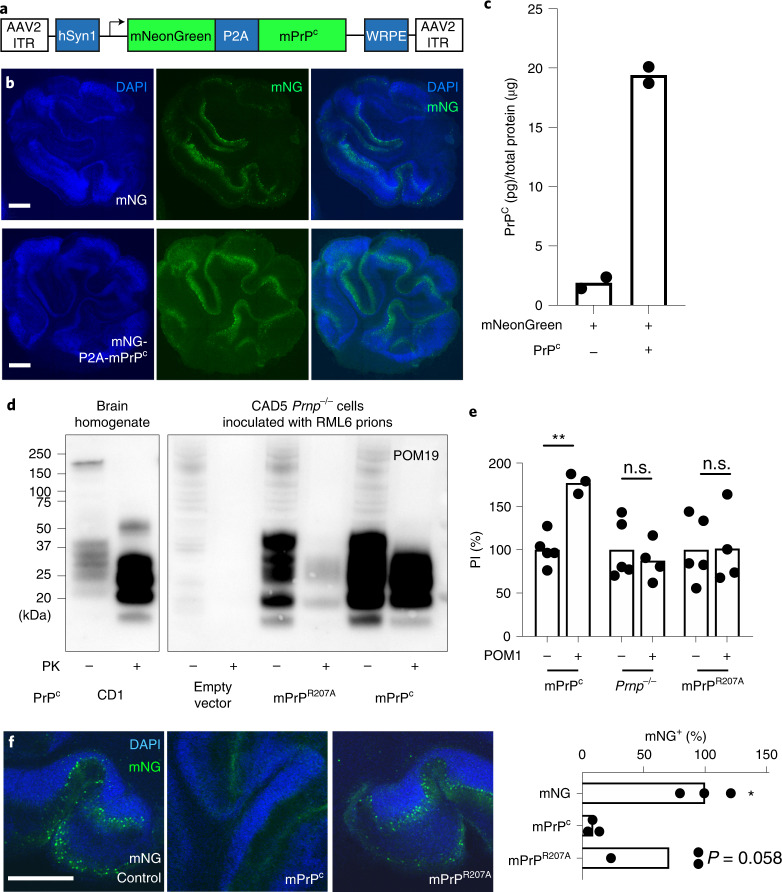
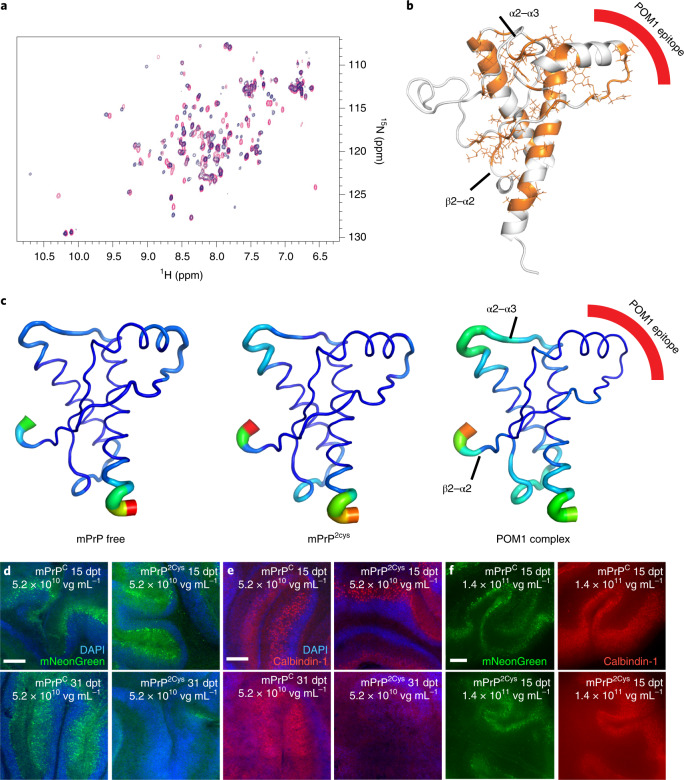
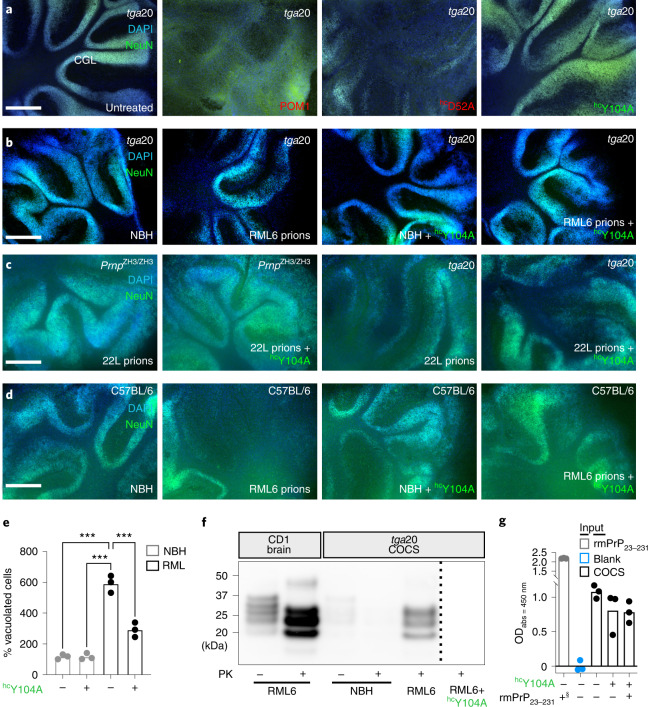
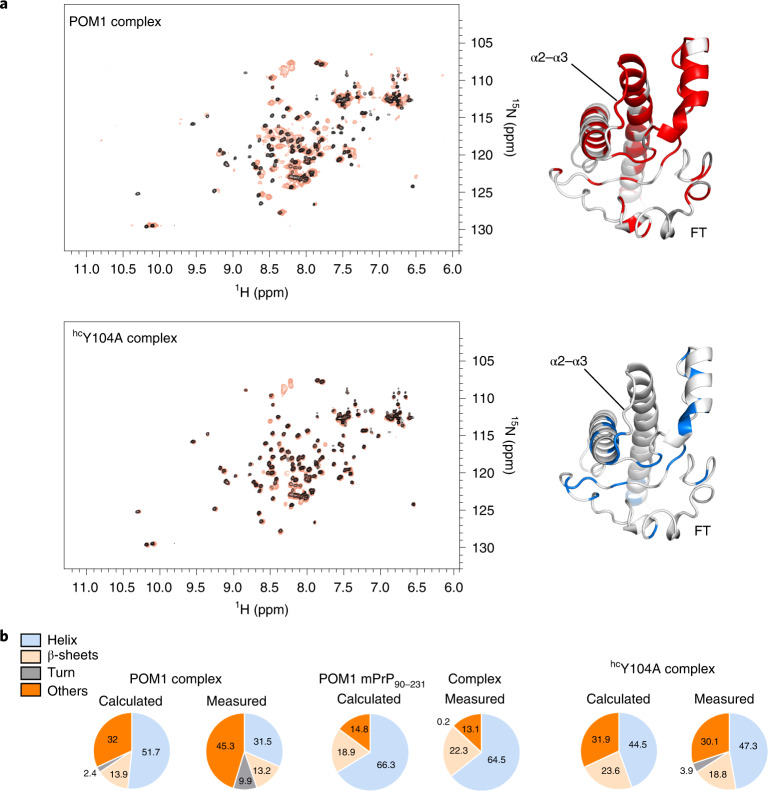
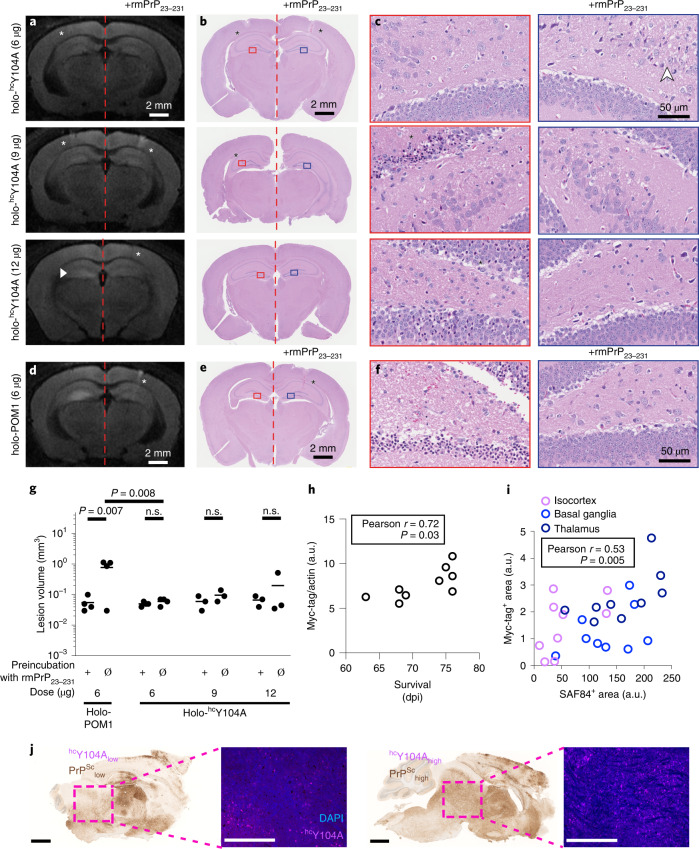
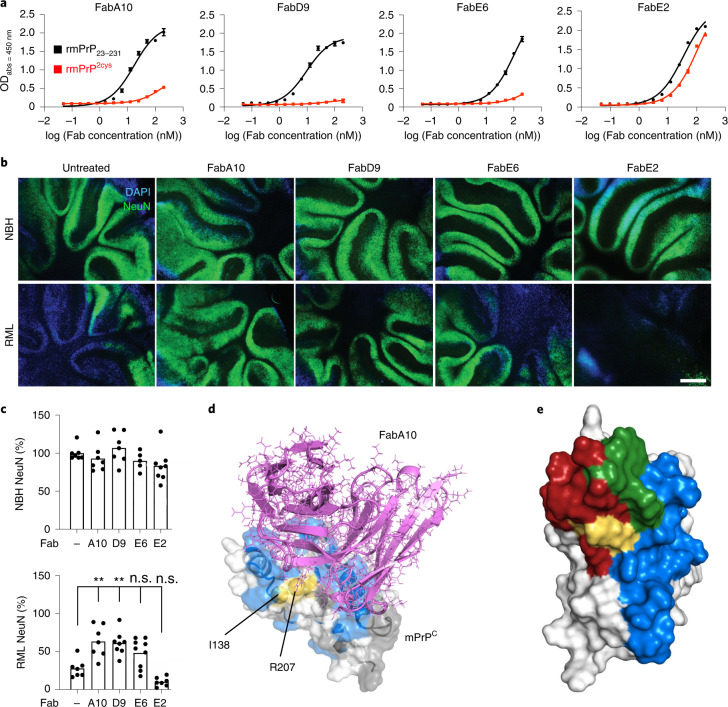
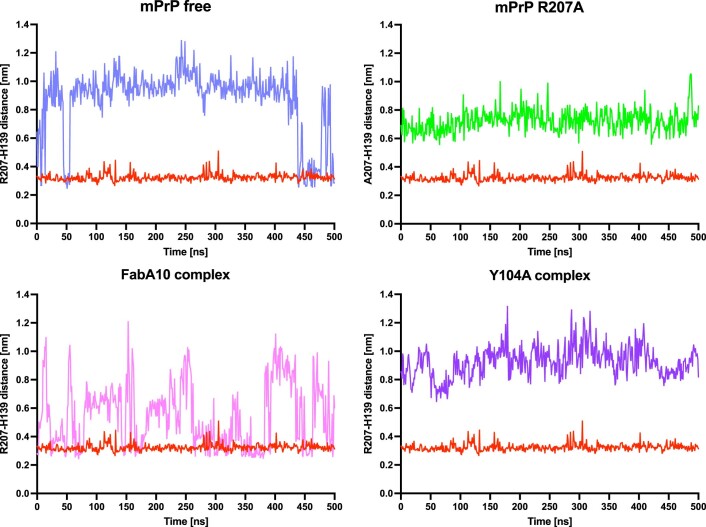
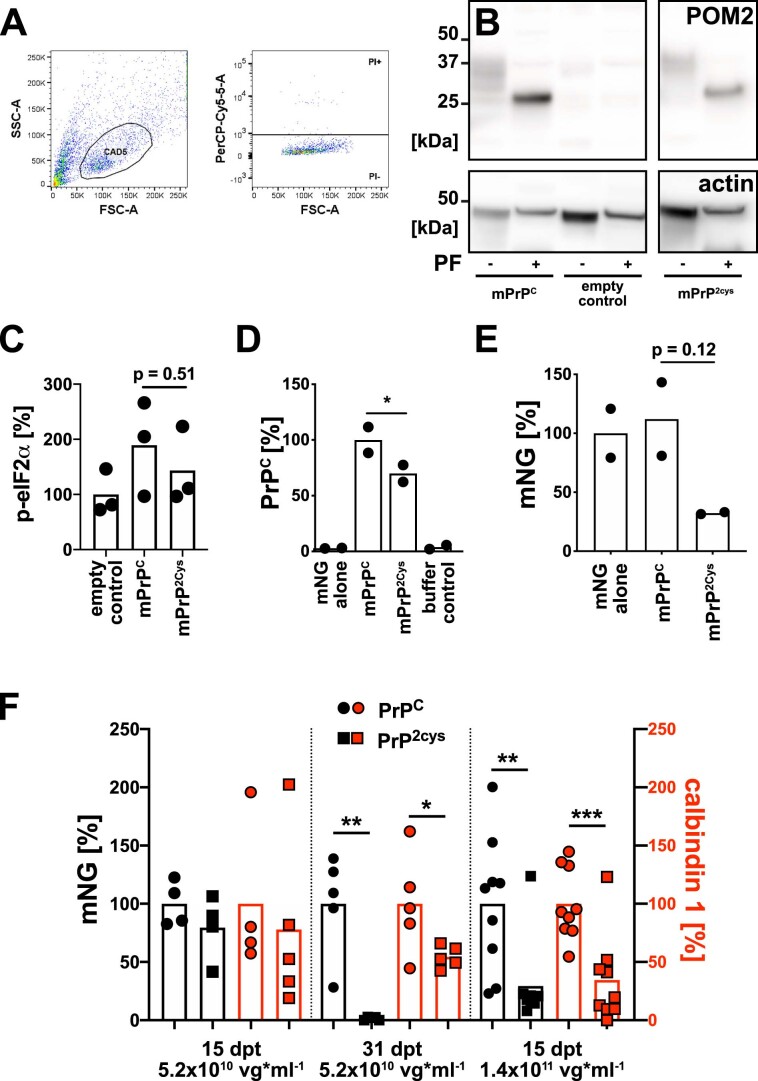
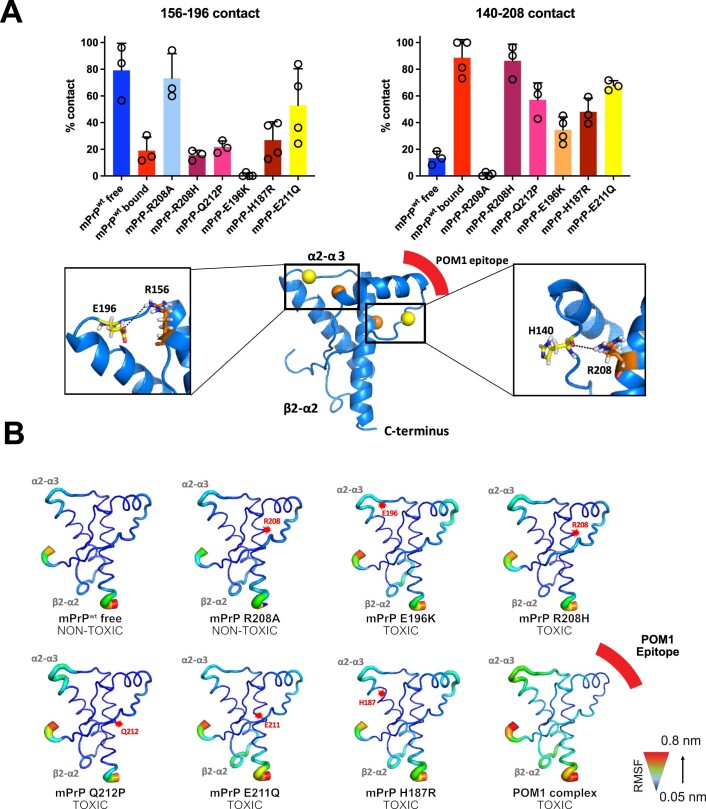
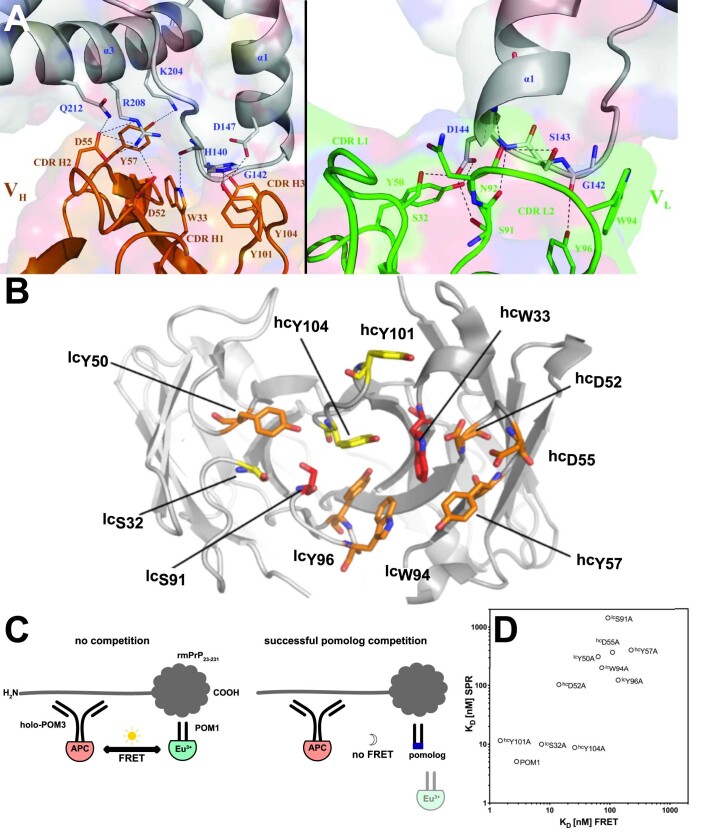
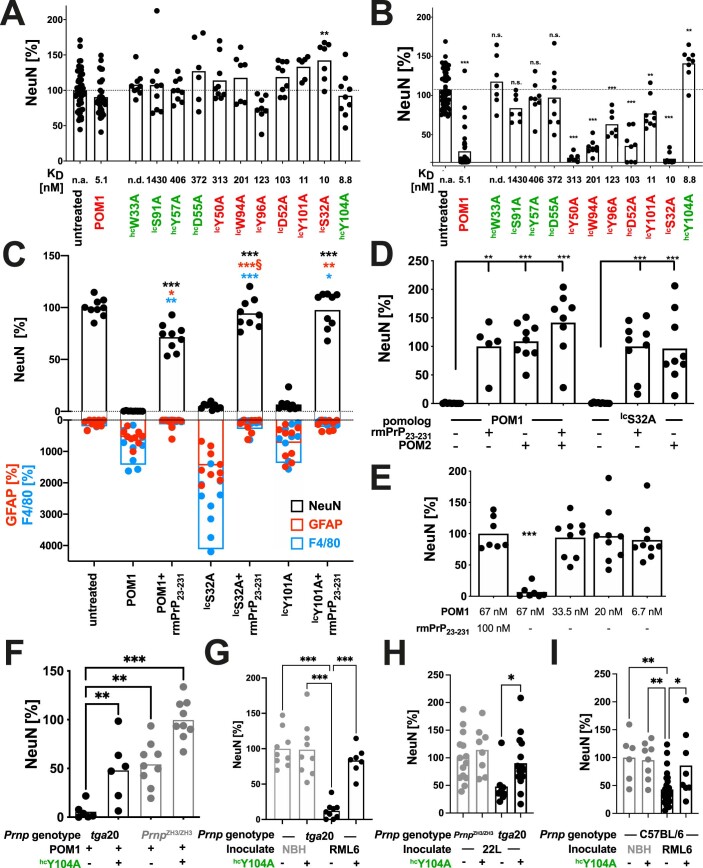
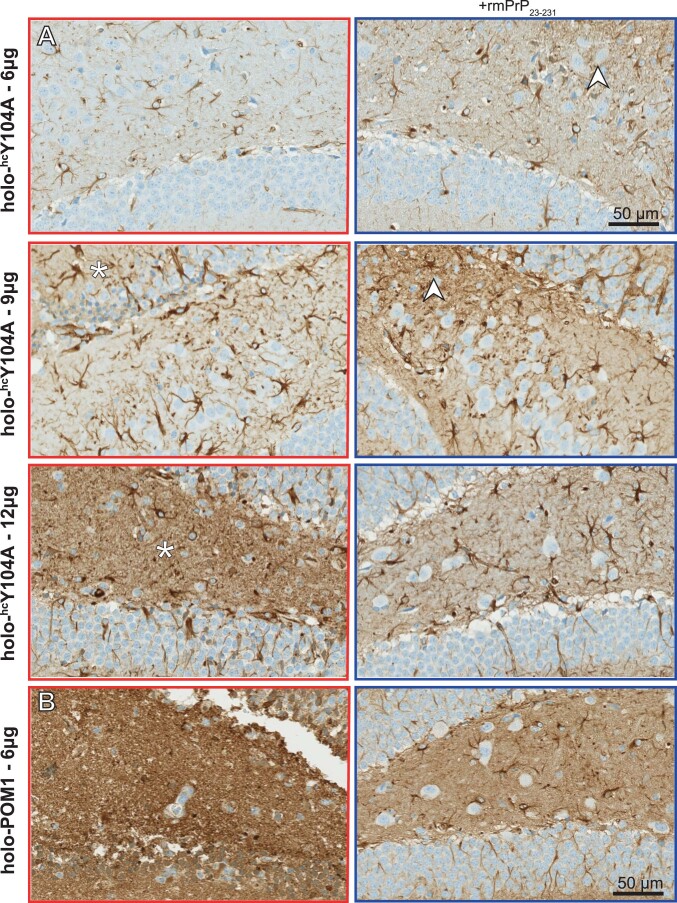
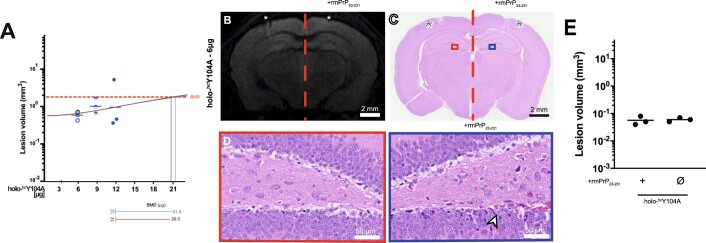
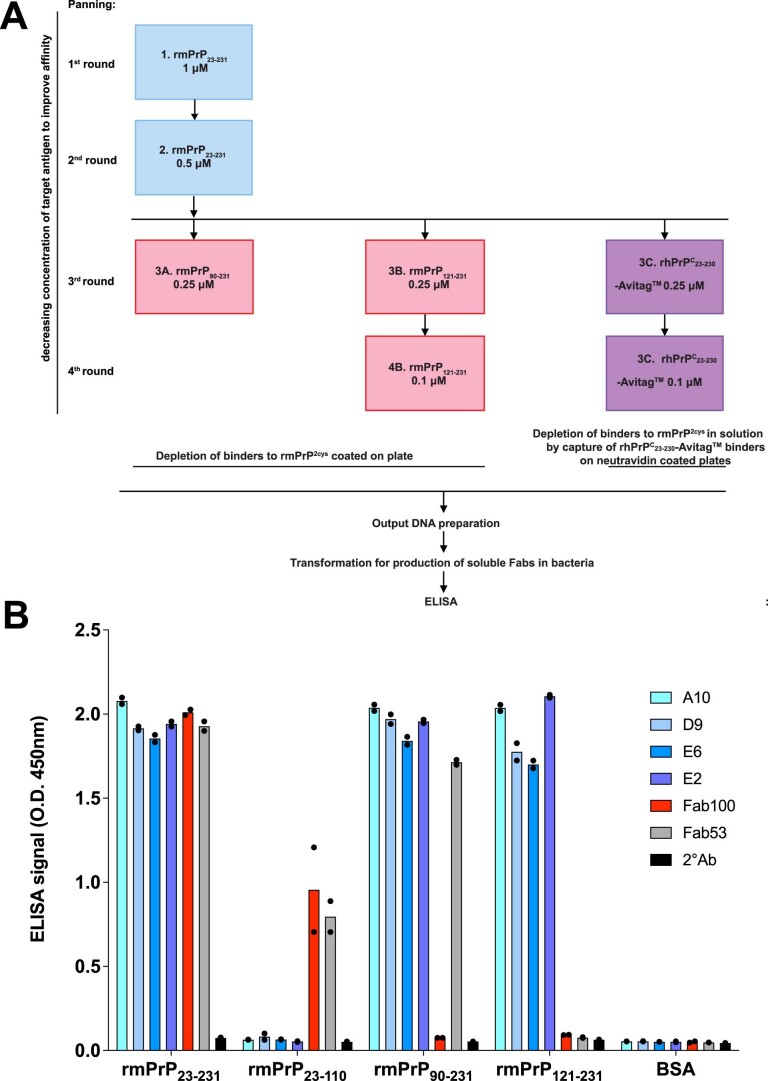
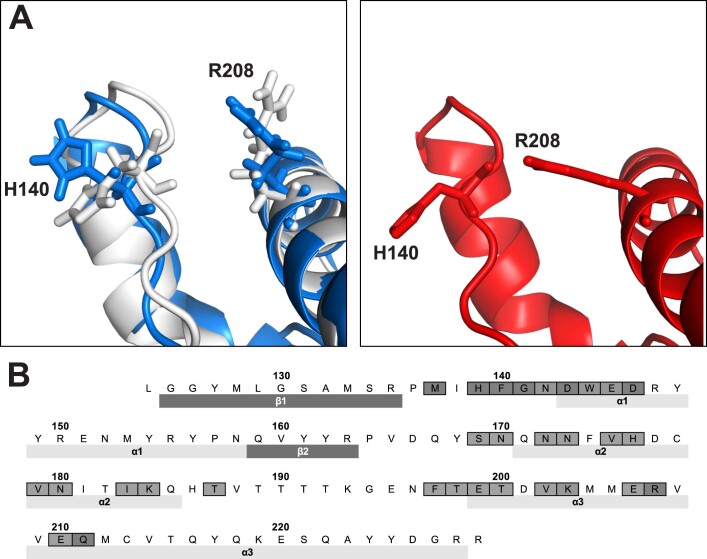
Prion infections cause conformational changes of the cellular prion protein (PrPC) and lead to progressive neurological impairment. Here we show that toxic, prion-mimetic ligands induce an intramolecular R208-H140 hydrogen bond ('H-latch'), altering the flexibility of the α2-α3 and β2-α2 loops of PrPC. Expression of a PrP2Cys mutant mimicking the H-latch was constitutively toxic, whereas a PrPR207A mutant unable to form the H-latch conferred resistance to prion infection. High-affinity ligands that prevented H-latch induction repressed prion-related neurodegeneration in organotypic cerebellar cultures. We then selected phage-displayed ligands binding wild-type PrPC, but not PrP2Cys. These binders depopulated H-latched conformers and conferred protection against prion toxicity. Finally, brain-specific expression of an antibody rationally designed to prevent H-latch formation prolonged the life of prion-infected mice despite unhampered prion propagation, confirming that the H-latch is an important reporter of prion neurotoxicity.


Conflict of interest statement

The authors declare no competing interests. The funders had no role in study design, data collection and analysis, decision to publish or preparation of the manuscript.

Figures

Fig. 1
Fig. 1. POM1 induces an intramolecular hydrogen bond between R208A and H140 of human PrPC.
a,b, Binding of PrPC to the neurotoxic antibody POM1 favors the formation of a R208-H140 hydrogen bond in the GD of PrPC (a) that is absent from free PrPC (b). c, MD simulations indicate that toxic antibodies are more likely to induce the R208-H140 bond. Ordinate: percentage of simulation time in which the H-bond is present. See also Supplementary Figure 1. d, GD flexibility according to MD simulations. Narrow blue ribbons: rigidity; large green/red ribbons: increased flexibility. PrP bound to protective pomologs resembles free PrP. PrP bound to POM1 induces increased flexibility in the α2–α3 and β2–α2 loops. e, Binding of the toxic antibody POM1 to PrP induces local structural changes within the GD, here shown as a cartoon, both within and outside the epitope region. Side-chain contacts (less than 5 Å) that are present only in PrP free (blue, PDB 1xyx) or PrP bound (orange, PDB 4H88) are indicated by lines. f, POM1 binding breaks the R156-E196 interaction, increasing α2–α3 flexibility, and induces the formation of a R156-D202 salt bridge. g, R156 interacts with E196 in free PrP, which helps to rigidify the α2–α3 loop. Source data
Fig. 2
Fig. 2. Ablation of H-latch formation by a R207A mutation in murine PrPC rescues PrP-induced toxicity.
a, Scheme of AAV used for bi-cistronic expression of monomeric NeonGreen and PrPC, separated by a P2A site (monomeric neon green (mNG)-P2A-PrPC). hSyn1, human Synapsin 1 promoter. WRPE, woodchuck hepatitis virus regulatory posttranscriptional element. ITR, inverted terminal repeats. b, Robust expression of mNG-P2A-PrPC on fluorescent micrographs from transduced PrnpZH3/ZH3 COCS. Scale bars: 500 µm. c, Holo-POM19–holo-POM2-biotin PrPC sandwich ELISA of samples depicted in b. One data point corresponds to a pool of 6–9 biological replicates of organotypic cultured slices. d, Proteinase K digestion of brain homogenates and cell lysates from chronically RML6-inoculated CAD5 cells (fourth passage is shown) detected with POM19. RML6 prions (lanes 1 and 2) and inoculated CAD5-mPrPC cells (lanes 7 and 8) show a typical ‘diagnostic shift’ of proteinase K (PK)-digested PrPSc, whereas only trace amounts of PrPSc are detectable in CAD5-mPrPR207A cells (lanes 5 and 6). Lack of detectable PrPSc in CAD5 Prnp–/– (lanes 3 and 4) cells indicates no residual inoculum. Lanes are from non-adjacent samples blotted on the same membrane. e, Addition of POM1 causes toxicity to CAD5 cells (left) but not to Prnp–/– or mPrPR207A CAD5 cells (center and right). The percentage of propidium iodide (PI)-positive cells, determined by fluorescence-activated cell sorting (FACS), is shown on the y axis. Values are given as percentages of CAD5 mPrPC PI-positive cells without POM1. One data point corresponds to a biologically independent cell lysate, for example a different cell passage. n.s., not significant, adjusted P > 0.05, **adjusted P = 0.0083, ordinary, one-way analysis of variance (ANOVA) with Šídák’s multiple comparisons test. The FACS gating strategy is summarized in Extended Data Figure 3a. f, PrnpZH3/ZH3 COCS transduced with wild-type mPrPC are susceptible to POM1 toxicity, whereas COCS transduced with control vector (‘mNG control’) or mPrPR207A are not. Values are given as percentage of empty control. One data point corresponds to a biologically independent organotypic cultured slice. *adjusted P = 0.012, ordinary, one-way ANOVA with Šídák’s multiple comparisons test. Scale bar: 500 µm. Source data
Fig. 3
Fig. 3. The R207C-I138C double-cysteine PrPC mutant acts as an H-latch mimic.
a,b, 15N-heteronuclear single quantum coherence spectra of rmPrP free (red) and mPrP2cys (blue). Residues with different chemical shifts in the two spectra are colored orange on the GD structure in b, which resemble the H-latch conformation in the POM1–PrP complex. c, MD simulations show that mPrP2cys resembles the PrP–POM1 complex, with increased flexibility in the α2–α3 and β2–α2 loops and decreased flexibility in the 2Cys region, corresponding to the POM1 epitope. df, PrnpZH3/ZH3 COCS transduced with a bi-cistronic AAV expressing mNG and mPrPC (left) or mPrP2Cys (right). See Extended Data Figure 3f for quantification. Scale bars: 250 µm. d, mNG was visible in all COCS at 15 days post transduction (dpt, top row) but disappeared in mPrP2Cys at 31 dpt (bottom row). e, Calbindin-1+ Purkinje cells were preserved at 15 dpt but became largely undetectable at 31 dpt, possibly as a result of mPrP2Cys toxicity. f, Dose escalation of twice as many viral vectors as in d and e led to earlier onset of mPrP2cys-mediated neurodegeneration. Significant neurodegeneration was observable at 15 dpt; see quantification in Extended Data Figure 3f.
Fig. 4
Fig. 4. Preventing H-latch formation by pomologs rescues prion-induced neurodegeneration.
a, The densely cellular NeuN+DAPI+ cerebellar granule cell layer (CGL) of tga20 COCS was preserved by treatment with POM1 mutant hcY104A (green) but destroyed by POM1 and hcD52A (red). b, CGL degeneration occurs in prion-infected tga20 COCS, but not in COCS exposed to non-infectious brain homogenate (NBH). Treatment of RML6 prion-infected tga20 COCS with hcY104A prevented neuronal loss. c, Rescue of prion-induced toxicity by hcY104A in COCS inoculated with 22L prions. d, Treatment of prion-infected wild-type COCS, expressing wild-type levels of PrPC, with hcY104A prevented CGL degeneration. ad, Quantification of fluorescent micrographs is depicted in Extended Data Figure 6b,g–i. Scale bar: 500 µm. e, Treatment with hcY104A (180 nM; 5 days) reduced vacuolation in chronically prion-infected Gt1 cells. Each dot represents an independent experiment with cells from different passages (1,000 cells/experiment, ordinary one-way ANOVA with Dunnett’s multiple comparisons test, ****adjusted P < 0.0001). f, Treatment of prion-infected tga20 COCS with hcY104A led to a reduction in PrPSc levels. One lane corresponds to a pool of 6–9 COCS digested with PK; PrPSc was detected using holo-POM1. The dashed bar indicates gel splicing of lanes running in non-adjacent wells on the same gel. g, Treatment of tga20 COCS with hcY104A for 7 days did not reduce PrPC levels, as determined by PrPC sandwich ELISA. §870 pM of rmPrP23230 were used as a positive control (first lane). Pomologs were pre-incubated with 600 nM of rmPrP23–230 as negative controls (last lane). Ordinate: absorbance, given as optical density at λ = 450 nm. Source data
Fig. 5
Fig. 5. Antibody binding causes allosteric conformational changes in the GD and FT.
a, Comparison between the [15N,1H]-TROSY spectra of free rmPrP90–231 versus that bound to the hcY104A pomolog. Chemical-shift differences, reflecting subtle alterations of the local chemical structure, were visible not only in the epitope but also at distant sites in the GD and FT. Residues affected by antibody binding are in color on PrPC (GD and part of the FT are shown on a MD model of PrP). Differences between toxic and protective antibodies are evident in the α2–α3 loop (the Y104A complex is identical to free PrPC) and in the FT region closer to the GD. b, Content of secondary structure estimated from CD spectra of the rmPrP–pomologs complexes. ‘Calculated’ indicates the secondary structure content if the rmPrP and pomolog did not change upon binding. POM1 displayed increased content of irregular structure (measured versus calculated) when in complex with full rmPrP23–231, but identical content when in complex with a construct lacking the FT (rmPrP90–231). This indicates that the FT changes conformation upon POM1 binding. Conversely, no differences were detected with the protective pomolog hcY104A.
Fig. 6
Fig. 6. The holo-IgG antibody hcY104A is innocuous after intracerebral injection.
a, Representative magnetic resonance diffusion-weighted images (DWI) 24 hours after stereotactic injection of holo-hcY104A (left). Contralateral injections of holo-hcY104A + rmPrP23231 (right). A small area of hyperintensity was found in one mouse after injection of 12 µg holo-hcY104A (white arrowhead). White asterisks: needle tract. b, Hematoxylin and eosin (HE)-stained sections from mice shown in a. Asterisks: needle tract. Rectangles denote regions magnified in c. c, HE sections (CA4). Left, holo-hcY104A injections (6, 9 and 12 µg). Right, holo-hcY104A + rmPrP23–230. Asterisk (9 µg): neurons with hypereosinophilic cytoplasm and nuclear condensation in the vicinity of the needle tract. Asterisk (12 µg): These neurons were diffusely distributed among numerous healthy neurons. White arrowhead: vacuoles indicative of edema along the needle tract. d, DWI images of 6 µg holo-POM1 ± rmPrP23–231, revealing a hyperintense signal at 24 hours. e, HE-stained section from a mouse shown in d. Asterisks: needle tract. Rectangles: areas in f. f, HE sections (CA4). Holo-POM1 injections revealed damaged neurons with condensed chromatin and hypereosinophilc cytoplasm. g, Volumetric quantification of lesions on DWI imaging 24 hours after injection revealed no significant lesion induction by holo-hcY104A. One datapoint corresponds to an animal. P values are adjusted for multiple comparisons. n.s.: not significant, P > 0.05, ordinary one-way ANOVA with Šídák’s multiple comparisons test. h, Antibody expression levels, as determined by Myc-Tag western blot, showed a positive correlation with survival. One datapoint corresponds to one animal. Pearson correlation coefficient r = 0.72, 95% confidence interval 0.099–0.94, P = 0.03. a.u., arbitrary units. i, Significant correlation of PrPSc and antibody expression levels (representative images depicted in j, aggregated correlation across all brain regions). Different colors represent 3 brain regions from 9 independent animals. Pearson correlation coefficient r = 0.53, 95% confidence interval 0.18–0.76, P = 0.0048. j, Representative images from quantification of l. l, Sagittal brain sections stained with SAF84, highlighting PrPSc, and basal ganglia immunofluorescent micrographs marking hcY104A-Myc-tag. Scale bar SAF84: 1 mm. Scale bar hcY104A-Myc-tag: 500 µm. Source data
Fig. 7
Fig. 7. Phage-displayed antibody fragments differentially binding wild-type PrPC, but not PrP2Cys, confer neuroprotection.
a, Preferential binding of the selected Fabs to rmPrP23–231 over rmPrP2Cys. With the exception of FabE2, the Fabs show higher apparent affinity for rmPrP23–231 than rmPrP2Cys. One datapoint corresponds to the mean ± s.e.m. of two technical replicates. The experiment was repeated twice. b, FabA10 and FabD9 conferred neuroprotection in prion-infected tga20 COCS. c, Quantification of NeuN fluorescence intensity from b, expressed as percentage of untreated (–) NBH. Scale bar: 500 µm. One datapoint corresponds to an independent, organotypic cultured slice. Two-way ANOVA with Dunnett’s multiple comparison test, P values are adjusted for multiple testing: RML untreated (–) versus RML A10: P = 0.006, RML untreated (–) versus RML D9: P = 0.009, **P < 0.01, n.s.: not significant, P > 0.05. d, Structure of PrPC (white) in complex with FabA10 (violet) obtained by NMR-validated docking and MD. mPrP90–231 residues whose NMR signal is affected by FabA10 binding are colored blue; residues with no NMR information are gray; residues mutated to Cys are yellow. e, There is partial overlap (green) between the epitopes of POM1 (red) and FabA10 (blue). The 2Cys are in yellow. PrPC is depicted in different orientations in d and e. Source data
Extended Data Fig. 1
Extended Data Fig. 1. Distances between the R207 and H139 residues in MD simulations of PrP-antibody complexes.
The simulation of the PrP-POM1 complex (red) in reproduced in all charts to facilitate comparisons. When PrP is bound to POM1, the H-bond between R207 and H139 (termed H-latch) is always present, with distance between the centroid of their sidechains around 0.3 nm. Greater distances indicate loss of hydrogen interactions and consequently absence of the H-latch. The complex of PrP with the hcY104A pomolog never shows formation of the H-latch, whereas FabA10 shows intermediate values. Simulations were run three times, but only representative traces are shown; aggregated analyses are shown in Fig. 1c. Source data
Extended Data Fig. 2
Extended Data Fig. 2. Robust expression and conformation of the PrPR207A point mutant.
(a) Representative images of expression levels of Synapsin 1 (Syn1, upper) and Calbindin 1 (Calb1, lower) show predominant (Syn1) or almost exclusive (Calb1) expression in Purkinje cells (pc) in the cerebellar cortex. Image credit: Allen Institute. Scale bar = 100 µm. (b) Fluorescent micrographs of PrnpZH3/ZH3 COCS transduced with the AAV outlined in panel (A) show mNeonGreen expression predominantly in calbindin 1-expressing Purkinje cells. Scale bar = 50 µm. cgl = cerebellar internal granular layer, pc = Purkinje cell layer, ml = molecular layer. These findings were repeated in three independent experiments. (c) Left panel: Stably transfected CAD5-mPrPC and CAD5-mPrPR207A cells show similar PrPC expression levels. epresentative PrPC levels of one cell culture passage are shown. Right panel: POM19 immunoreactivity is divided by actin immunoreactivity, values are given as percentages of PrPC. One datapoint corresponds to one passage of CAD5 cells. (d) Surface plasmon resonance (SPR) traces showing binding of POM1 to recombinant mPrPR207A (rmPrPR207A, ka=3.8E+05 1/Ms, kd=1.8E−04 1/s, KD=4.7E−10 M; for comparison binding to recombinant wild-type murine PrP showed ka=3.6E+05 1/Ms; kd=9.1E−05 1/s; KD=2.5E−10 M). (e) Immunohistochemistry of CAD5 Prnp-/- cells stably transfected with pcDNA3.1 vector expressing wild-type murine PrPC (mPrPC), mPrPR207A and mPrP2cys. Monoclonal anti-PrPC antibodies targeting distinct conformational epitopes on the globular domain of PrPC were incubated to assess conformational changes in mPrPR207A (POM1: α1-α3, POM5: β2-α2, POM8: α1-α2, POM19: β1-α3). Except for diminished staining of POM1 in mPrPR207A, we observed robust detection of mPrPR207A by POM5, POM8 and POM19 and mPrP2cys by POM8 and POM19. Parts of this experiment, for example POM1 and POM19, were repeated twice. Scale bar = 20 µm. Source data
Extended Data Fig. 3
Extended Data Fig. 3. Expression of the H-latch mimic R207C-I138C in organotypic cultured slices leads to dose-dependent neurotoxicity.
(a) Flow cytometry gating strategy of PI positive CAD5 cells. (b) PNGase-F digestion of cell lysates induced a shift in both murine wild-type PrPC and mPrP2cys, indicating that both moieties had undergone N-linked glycosylation to a similar extent. Non-adjacent lanes were merged from the same gel. (c) CAD5 Prnp-/- cells expressing mPrP2cys did not show an upregulation of the unfolded protein response, suggesting that mPrP2cys did not undergo pathological degradation. Values are given as percentage of empty control vector (p-eIF2α / eIF2α / actin). One datapoint per group corresponds to a different cell culture passage. Two-sided, unpaired t-test. (d) A POM2/POM3 sandwich ELISA of COCS transduced with empty control, mPrPC, mPrP2cys and buffer control shows robust mPrP2cys expression in transduced COCS, albeit significantly less than wild-type mPrPC. Slices were harvested at 28 days post-transduction. One datapoint corresponds to an independent, biological replicate of 6–9 pooled slices. Ordinary, one-way Anova with Šídák’s multiple comparisons test, *: adjusted p-value = 0.039 (e) Reduced levels of mNG in Prnp-/- (ZH3) COCS expressing mPrP2cys. mNG immunoreactivity values are divided by actin immunoreactivity and expressed as percentages of empty control. Slices were harvested at 28 days post-transduction. One datapoint corresponds to an independent, biological replicate of 6–9 pooled slices. Ordinary, one-way Anova with Šídák’s multiple comparisons test. Raw, uncropped blots can be found in the Source Data supplement. (f) Quantification of mNG and Calb1 fluorescence intensity from experiments shown in Fig. 3d-f. One datapoint corresponds to a biological replicate, e.g. one organotypic cultured slice. Unpaired, two-tailed t-test without adjustment for multiple testing. P-values are as follows: 31 dpt, 5.2x10¹⁰ vg*ml−1, mNG: 0.001; 31 dpt, 5.2x10¹⁰ vg*ml−1, Calb1: 0.0496; 15 dpt, 1.4x10¹¹ vg*ml−1, mNG: 0.0065; 15 dpt, 1.4x10¹¹ vg*ml−1, Calb1: 0.001. ***: p ≤ 0.001, **: p < 0.01, * p < 0.05. Source data
Extended Data Fig. 4
Extended Data Fig. 4. Molecular dynamics simulations show overlapping structural changes of POM1-PrPC complex and pathogenic PRNP mutations.
Extended Data Figure 4. (a) MD simulations of POM1 binding and pathogenic PRNP mutations causing genetic prion disease show the R156-E196 interaction is abolished and induction of the H140-R208 H-latch is established. Each datapoint represents one independent simulation, values are given as mean ± standard deviation. (b) In agreement with this view, POM1 and human, hereditary PrP mutations responsible for fatal prion diseases favor altered flexibility in the α2-α3 and β2-α2 loop. Source data
Extended Data Fig. 5
Extended Data Fig. 5. Scanning alanine mutagenesis of the POM1 paratope.
Extended Data Figure 5. (a) Intermolecular contacts between human PrPC120–230 and POM1 Fab variable heavy chain (magenta, left panel), and POM1 Fab variable light chain (green, right panel) as determined by Baral et al., 2012. Reproduced with permission of the International Union of Crystallography from doi:10.1107/S0907444912037328. (b) Schematic representation of a single-chain fragment of wild-type POM. The mutated residues are indicated as stick on the cartoon structure of POM1, color coded as in Supplementary Table 1b. The CDR loops are shown from the perspective of the antigen. (c) Scheme of competition FRET assay to assess the KD of various pomologs. In the absence of competing antibody, FRET occurs due to proximity of allophycocyanin (APC)-labeled holo-POM3 and europium (Eu3+)-labeled POM1 (left panel). Because of liquid-phase competition, addition of unlabeled pomologs leads to a decrease in FRET signal (right panel). The calculation of binding constants from FRET is detailed in the methods section. (d) The binding constants measured by SPR and by FRET were in good agreement, Spearman r = 0.77, p=0.0074, 95% CI 0.30–0.94) with the exception of hcW33A, whose binding on SPR was too weak to be precisely measured. Source data
Extended Data Fig. 6
Extended Data Fig. 6. Pomolog hcY104A acts as dominant negative suppressor of prion toxicity.
Extended Data Figure 6. (a) Treatment of PrnpZH1/ZH1 COCS shows toxicity of POM1 and toxic pomologs to be dependent on PrPC, see also Supplementary Fig. 1a. **: p=0.003, ordinary one-way Anova with Dunnett’s multiple comparisons test. Innocuous pomologs are highlighted in green, POM1 and toxic pomologs are highlighted in red. (b) Morphometric quantification of Prnp-overexpressing tga20 COCS treated with pomologs, see also Fig. 4. Color coding according to panel (A). 100%=untreated COCS, comparison of untreated versus treated groups. N.s.: not significant, ***: p < 0.0001, ** hcY101A: p=0.0035, ** hcY104A: p=0.0019, ordinary one-way Anova with Dunnett’s multiple comparisons test. (c) Morphometric quantification of fluorescence intensity from images depicted in Supplementary Fig. 1b. §: 1 outlier was excluded (y=2046.3%, p < 0.05, extreme studentized deviate method). Values = % of untreated control. Pairwise comparison in the presence or absence of rmPrP23–231. ***: p < 0.0001, * GFAP-POM1: p=0.0148, ** GFAP-lcY101A: p=0.0009, ** F4/80-POM1: p=0.0005, * F4/80-lcY101A: p=0.0261, ordinary one-way Anova with Šídák’s multiple comparisons test. (d) Toxicity of high-affinity pomolog lcS32A ablated by POM2. 100%=POM1 + rmPrP23–231 (bars 1–4) or 100%=lcS32 + rmPrP23–231 (bars 5–7). ** p=0.0003, *** p < 0.0001, ordinary one-way Anova with Šídák’s multiple comparisons test. (e) Titration of minimal toxic dosage of POM1 in tga20 COCS. 100%=POM1 + rmPrP23–231. ***: p < 0.0001, ordinary one-way Anova with Dunnett’s multiple comparisons test. (f) hcY104A prevented POM1-induced toxicity. 100%=Prnp0/0 COCS treated with POM1 + hcY104A. ** p=0.0078, ***(left): p=0.0009, ***(right): p < 0.0001, ordinary one-way Anova with Dunnett’s multiple comparisons test. (g) Quantification of Fig. 4b. 100%=untreated+NBH. ***: p < 0.0001, ordinary one-way Anova with Dunnett’s multiple comparisons test. (h) Quantification of Fig. 4c. 100% = PrnpZH3/ZH3 + 22 L. *: p=0.032, ordinary one-way Anova with Šídák’s multiple comparisons test. (i) Quantification of Fig. 4d. 100%=untreated+NBH. *: p=0.0203, **(left): p=0.0036, **(right): p=0.005, ordinary one-way Anova with Dunnett’s multiple comparisons test. All graphs: one datapoint corresponds to one biological replicate. Source data
Extended Data Fig. 7
Extended Data Fig. 7. Dose-dependent gliosis of hcY104A is also conspicuous around needle tracts.
Extended Data Figure 7. (a) Photomicrographs of glial fibrillary acid protein (GFAP) immunohistochemistry on consecutive sections depicted in Fig. 6c. Left column: holo-hcY104A injections (6, 9 and 12 µg). Right column: holo-hcY104A + rmPrP23–231. GFAP immunoreaction was increased in areas of neuronal damage (white asterisks) and around needle tracts (white arrowheads). (b) Micrographs demonstrating an intensive GFAP immunoreaction in areas with extensive holo-POM1 (6 µg)- induced neurotoxicity. Left panel: POM1 injection (6 µg). Right panel: holo-hcY104A + rmPrP23–231. Sections are consecutive to those shown in Fig. 6f.
Extended Data Fig. 8
Extended Data Fig. 8. Assessing hcY104A dose-dependent toxicity.
Extended Data Figure 8. (a) A hypothetical benchmark dose analysis was performed using log10-transformed lesion volumes corresponding to different amounts of holo-hcY104A (data from Fig. 6g). BMR: Benchmark response (0.15 mm3, dashed red line). The benchmark dose (BMD) is defined as the dose at the BMR. The vertical lines indicate the BMD values corresponding to the different dose response values (blue: 21.5 µg, brown line: 20.5 µg). The upper limit of the safe dose is provided by the lower 95% confidence interval of the BMD (horizontal lines below the graph: blue: 12 µg, brown: 12 µg). One datapoint corresponds to one independent animal. (b) Representative DWI images taken 24 h after stereotactic injection of 6 µg holo-hcY104A into male tga20 mice (left half of the image, injected into CA3). Contralateral side: 6 µg holo-hcY104A pre-incubated with an equimolar amount of rmPrP23–230. White asterisks: needle tract. (c) Photomicrograph of HE-stained sections from mouse brain shown in panel B. Asterisks: needle tract. Rectangles correspond to regions magnified in panel C. (d) Higher magnification of the end-plate of the hippocampus. Left panel: holo-hcY104A. Right panel: holo-hcY104A preincubated with rmPrP23–230. Arrow: needle tract. (e) Quantification of lesion volumes after injection of holo-hcY104A in contrast to control injection into tga20 mice (N = 3). One datapoint corresponds to one independent animal. Source data
Extended Data Fig. 9
Extended Data Fig. 9. Generation and validation of a synthetic human Fab phage library.
Extended Data Figure 9. (a) A synthetic human Fab phage library was used for panning. For each panning round, the targeted antigens are reported with the respective concentration. Full-length recombinant murine PrP23–231 (rmPrP23–231; light blue boxes) was used as a target for the first and the second round of phage panning. At the third and fourth round, phages were depleted of the binders to rmPrP2cys and selected for binding to either rmPrP90–231 or rmPrP121–231 (recombinant murine PrP fragments lacking the N-terminal flexible tail; light red boxes) or to recombinant human PrP23–230-AviTagTM (rhPrP23–230-AviTagTM, purple boxes). In rmPrP90–231 or rmPrP121–231 panning, Fab-displayed Fab were depleted of binders to rmPrP2cys coated on plates. In rhPrP23–230-AviTagTM panning, depletion of binders to rmPrP2cys in solution was achieved by capturing Fabs binding to rhPrP23–230-AviTagTM on neutravidin coated wells. Polyclonal DNA preparation from the selected phages at the third round (rmPrP90–231) and fourth round (rmPrP121–231 and rhPrP23–230-AviTagTM) was used for transformation in bacteria and the screening of single clones by ELISA. (b) ELISA (OD at 450 nm) comparing the reactivity of phage-derived anti-PrP Fabs to full-length rmPrP23–231, FT fragment rmPrP23–110 and GD fragments rmPrP90–231 and rmPrP121–231. Anti-PrP Fab100 and Fab53 bind within the FT of PrP - the octapeptide repeat region (OR, amino acid 51–90) and the charged cluster 2 (CC2, amino acid 93–100), respectively. FabA10, FabD9, FabE6 and FabE2 bind within the GD. Error bars = standard error of the mean. One datapoint corresponds to a technical replicate in a multi-well plate. Source data
Extended Data Fig. 10
Extended Data Fig. 10. FabA10 ameliorates the H-latch but shares its paratope with POM1.
Extended Data Figure 10. (a) The R208-H140 interaction is present in POM1-bound PrP (right, red) but not in free PrP (left, white) or in its complex with FabA10 (left, blue). The final state of MD simulations starting from a POM1-bound conformation, with R208-H140 interaction present, is shown for FabA10. (b) Overlap (green) of FabA10 (blue) and POM1 (red) epitopes on murine PrPC-GD. Coloring according to Fig. 7d, e.

References

    1. Brandner S, et al. Normal host prion protein necessary for scrapie-induced neurotoxicity. Nature. 1996;379:339–343. doi: 10.1038/379339a0. - DOI - PubMed
    1. Lakkaraju, A. K. K. et al. Loss of PIKfyve drives the spongiform degeneration in prion diseases. EMBO Mol. Med.13, e14714 (2021). - PMC - PubMed
    1. McNally KL, Ward AE, Priola SA. Cells expressing anchorless prion protein are resistant to scrapie infection. J. Virol. 2009;83:4469–4475. doi: 10.1128/JVI.02412-08. - DOI - PMC - PubMed
    1. Wulf MA, Senatore A, Aguzzi A. The biological function of the cellular prion protein: an update. BMC Biol. 2017;15:34. doi: 10.1186/s12915-017-0375-5. - DOI - PMC - PubMed
    1. Bueler H, et al. Mice devoid of PrP are resistant to scrapie. Cell. 1993;73:1339–1347. doi: 10.1016/0092-8674(93)90360-3. - DOI - PubMed

Publication types