. 2022 Aug 10;79(9):478.
doi: 10.1007/s00018-022-04476-y.

Pharmacological attenuation of melanoma by tryptanthrin pertains to the suppression of MITF-M through MEK/ERK signaling axis

Affiliations

Pharmacological attenuation of melanoma by tryptanthrin pertains to the suppression of MITF-M through MEK/ERK signaling axis

Anwar Shabna et al. Cell Mol Life Sci. .

Abstract

Melanoma is the most aggressive among all types of skin cancers. The current strategies against melanoma utilize BRAFV600E, as a focal point for targeted therapy. However, therapy resistance developed in melanoma patients against the conventional anti-melanoma drugs hinders the ultimate benefits of targeted therapies. A major mechanism by which melanoma cells attain therapy resistance is via the activation of microphthalmia-associated transcription factor-M (MITF-M), the key transcription factor and oncogene aiding the survival of melanoma cells. We demonstrate that tryptanthrin (Tpn), an indole quinazoline alkaloid, which we isolated and characterized from Wrightia tinctoria, exhibits remarkable anti-tumor activity towards human melanoma through the down-regulation of MITF-M. Microarray analysis of Tpn-treated melanoma cells followed by a STRING protein association network analysis revealed that differential expression of genes in melanoma converges at MITF-M. Furthermore, in vitro and in vivo studies conducted using melanoma cells with differential MITF-M expression status, endogenously or ectopically, demonstrated that the anti-melanoma activity of Tpn is decisively contingent on its efficacy in down-regulating MITF-M expression. Tpn potentiates the degradation of MITF-M via the modulation of MEK1/2-ERK1/2-MITF-M signaling cascades. Murine models demonstrate the efficacy of Tpn in attenuating the migration and metastasis of melanoma cells, while remaining pharmacologically safe. In addition, Tpn suppresses the expression of mutated BRAFV600E and inhibits Casein Kinase 2α, a pro-survival enzyme that regulates ERK1/2 homeostasis in many tumor types, including melanoma. Together, we point to a promising anti-melanoma drug in Tpn, by virtue of its attributes to impede melanoma invasion and metastasis by attenuating MITF-M.

Keywords: BRAFV600E; CK2α; MITF-M; Melanoma metastasis; Tryptanthrin; VEGFR2; β-catenin.


Conflict of interest statement

The authors have no relevant financial or non-financial interests to disclose.

Figures
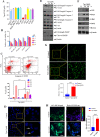
Fig. 1
Fig. 1
Tpn induces melanoma cell apoptosis A A panel of human cancer cell lines of different tissue origin was treated with different concentrations of Tpn. After 72 h, the cell viability was assessed by MTT assay. B Human melanoma cell lines, A375, SK- MEL-28, SK-MEL-2, and the murine melanoma cell line, B16F10 were compared with normal immortalized melanocytes, HEMa-LP for assessing the cell viability on treatment with increasing concentrations of Tpn. C Tpn, at its IC50 concentration, was evaluated for the induction of early and late stages of apoptosis using Annexin V-FITC-PI-FACS analysis in A375 cells. D DAPI staining to evaluate nuclear condensation induced by Tpn, post 6 h treatment, in A375 cells, 60 X magnifications is shown in the inset. E Immunoblot for caspase activation and PARP cleavage indicating the apoptotic mode of cell death induced by Tpn at 48 h incubation in A375 cells. F To evaluate the mechanism of apoptosis induced upon Tpn treatment immunoblot was performed to check the expression of tumor suppressor p53, pro-apoptotic proteins BAX and Bid and anti-apoptotic proteins Bcl-2 and Bcl-xL. β-actin was used as a loading control. G Cellular ROS levels analyzed upon Tpn treatment in A375 cells by H2DCF-DA assay. H A375 Mito roGFP ratiometric probe showing increased redox ratio after 48 h of Tpn treatment, which indicates increased mitochondrial ROS levels
Fig. 2
Fig. 2
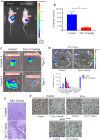
Tpn prevents melanoma tumor growth A Control (Vehicle) and liposomal Tpn (12 mg/kg) administered mice were subjected to live imaging under a small animal imager (Calipers) at the end of 4 weeks on administering the substrate luciferin (mean ± SEM, n = 4 per group,**** p < 0.001). B Luciferase activity of control and treatment are graphically represented (mean ± SEM, n = 4 per group, **** p < 0.001). C Ex vivo images of the excised tumors of the control and treatment group placed under animal imager (Calipers), post euthanasia (n = 4). D Ex vivo images of the organs of control and treatment group (n = 4) under animal imager. Graphical representation of the luciferase activity of the various excised organs of both control and treatment groups (mean ± SD, n = 3), carried out using a dual-luciferase reporter assay as per the manufacturer’s protocol. E Representative images of tissue sections of tumor xenografts from control and Tpn group, stained with hematoxylin and eosin (Scale bar100 µm). F Immunohistochemical analysis of the control and Tpn treatment groups of A375-Luc+ xenografts for the expression of proteins, VEGFR2, PCNA, and BRAF V600E
Fig. 3
Fig. 3
Suppression of melanoma migration and metastasis by Tpn A Scratch wound assay was performed to check the ability of Tpn to prevent the migratory property of A375 cells. Graphical representation of the wound area (Pixels) of n = 3 experiments. B Immunoblotting was carried out to check the cytoplasmic and nuclear levels of β-catenin. Vinculin was used as loading control for cytoplasmic fraction and Lamin B was used as nuclear control. C TOP-FOP-dual-luciferase assay to check the activation of β-catenin upon Tpn treatment. LiCl was used as a positive control. D Black melanotic nodules were observed in the lungs of control groups of the B16F10 tail vein metastasis model. Tpn treatment group showed less number of melanotic nodules. E Graphical representation showing statistically significant (p-value < 0.0001) reduction in the number of metastatic nodules upon Tpn treatment in B16F10 tail vein models. F Colorless foci were observed in the lungs of control groups of A375 tail vein metastasis model. Tpn treatment group showed less number of lung nodules. G Graphical representation showing statistically significant (p-value < 0.0097) reduction in the number of metastatic nodules upon Tpn treatment in A375-Luc+ tail vein models. H Ex vivo images of the organs of A375-Luc+ tail vein metastasis model, representative animals of control and Tpn treatment are shown (n = 3). ROI values indicate the signal emitted (photons). I Luciferase activity was performed using the Dual-luciferase assay kit, showing the relative luciferase signals of the organs of the control and treatment group of three technical replicates (mean ± SD). J Histopathological verification of the hepatic tissues was done by H and E staining. K Chromatogram showing the peak response of internal standard (2-Hydroxy acetophenone) and Tpn. L The serum retention of different concentrations of liposomal Tpn was analyzed by HPLC
Fig. 4
Fig. 4
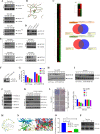
CK2α–MEK–ERK axis mediates the degradation of MITF-M upon Tpn treatment A Western blotting to check the protein level expression of BRAF V600E and BRAF WT in response to Tpn in various melanoma cells. B In silico binding studies of Tpn with wild-type BRAF (Green) and mutant BRAF V600E (Red). C Heat maps generated from microarray analysis to identify differentially regulated genes upon Tpn treatment at 24 h and 30 min. D Western blotting to check the protein level expression of MITF-M among various melanoma cell lines. E Western blotting was carried out to check the expression of the master regulator protein, MITF-M upon treatment with increasing concentrations of Tpn in different melanoma cell lines. F FLAG expression was checked to confirm the plasmid pCMV- Tag4A-MITF-M (WT) transfection using Western blotting. G Relative cell viabilities of A375-MITF-M and A375-Neo cells towards Tpn assessed by MTT assay. H Comparative evaluation of the levels of MITF-M in response to increasing concentrations of Tpn in A375-MITF-M and A375-Neo cells by Western blotting. I Comparative evaluation of the levels of β-catenin in response to increasing concentrations of Tpn in A375-MITF-M and A375-Neo cells by Western blotting. J Western blotting to evaluate the expression pattern of the major proteins of the MAPK pathway, P- MEK1/2, P- ERK1/2 on Tpn treatment at increasing concentrations, and the relative levels of MITF-M expression in SK-MEL-28 cells. The levels of total ERK and GAPDH serve as loading controls. K Western blot analysis reveals the activation status of MAPK proteins and MITF-M after treating with Tpn, in response to U0126 (10 µM). L Microscopic images of the cells under 20 X magnification, in the presence of increasing concentrations Tpn is shown in the left panel, and the cells pre-treated with U0126 prior to Tpn treatment are shown in the right panel. The relative cell viabilities are plotted. M In silico binding of Tpn with the crystal structure of MKP3. N In silico docking of Tpn with the crystal structure of Casein Kinase 2α. O In vitro kinase assay conducted using CK2α-substrate coated ELISA plates treated with enzyme-CK2α alone or CK2α pre-incubated with Tpn (3 µM) or the positive control, Heparin, a known inhibitor of CK2α. P Western blotting was carried out to check the expression of CK2α upon treatment with increasing concentrations of Tpn
Fig. 5
Fig. 5
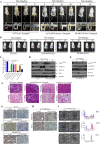
MITF-M is the key determinant in tryptanthrin-mediated anti-melanoma efficacy. A Representative images of NOD-SCID mice in the control and Tpn groups and the corresponding tumors of orthotopic xenografts established using A375-Luc+ cells, A375-MITF-M-Luc+ cells, and SK-MEL-28-Luc+ cells. B Representative images of the luciferase-expressing live animals of each group of control and treatment (n = 3 per group). C Graphical representation of the mean tumor volume of all the control and respective treatment groups (n = 3,****p < 0.001). D Immunoblotting was carried out to check the difference in expression of various proteins in the A375 and A375-MITF-M tumor tissue samples versus the respective Tpn treatment groups. E Immunoblotting was carried out to compare the difference in expression of major proteins upon treatment with 60 mg/kg Tpn against control in A375-MITF-M xenograft. F Histopathological confirmation of the tumor sections carried out by H and E staining. G Immunohistochemistry showing MITF-M expression in tumor tissue sections of each group of control and respective treatment. H Control and Tpn-treated tumor sections were immuno stained to check the difference in expression of MITF-M and its downstream target, Bcl-2 in the tissue sections of A375-MITF-M-Luc+ xenografts. I Tail vein metastasis model was carried out with different melanoma cells A375-Luc+, A375-MITF-M-Luc+ and SK-MEL-28-Luc+ and their respective Tpn treatment groups. Graphical representation of each group of control and respective Tpn treatment
Fig. 6
Fig. 6
Illustration of tryptanthrin-mediated melanoma suppression. Tryptanthrin blocks melanoma progression by suppressing BRAFV600E and CK2α independently. Tryptanthrin potentiates MITF-M degradation via MEK/ERK signaling axis

Similar articles

Cited by

References

    1. Liu Y, Sheikh MS. Melanoma: molecular pathogenesis and therapeutic management. Mol Cell Pharmacol. 2014;6:228. - PMC - PubMed
    1. Bai X, Fisher DE, Flaherty KT. Cell-state dynamics and therapeutic resistance in melanoma from the perspective of MITF and IFNγ pathways. Nat Rev Clin Oncol. 2019;16:549–562. doi: 10.1038/s41571-019-0204-6. - DOI - PMC - PubMed
    1. Shackelford R, Pollen M, Vora M, Jusion TT, Cotelingam J, Nair B. Malignant melanoma with concurrent BRAF E586K and NRAS Q81K mutations. Case Rep Oncol. 2014;7:297–300. doi: 10.1159/000362788. - DOI - PMC - PubMed
    1. Tsao H, Chin L, Garraway LA, Fisher DE. Melanoma: from mutations to medicine. Genes Dev. 2012;26:1131–1155. doi: 10.1101/gad.191999.112. - DOI - PMC - PubMed
    1. Wellbrock C, Arozarena I. The complexity of the ERK/MAP-kinase pathway and the treatment of melanoma skin cancer. Front Cell Dev Biol. 2016;4:33. doi: 10.3389/fcell.2016.00033. - DOI - PMC - PubMed

MeSH terms

Substances