. 2023 Feb;45(1):293-309.
doi: 10.1007/s11357-022-00632-1. Epub 2022 Aug 11.

Task-based functional connectivity of the Useful Field of View (UFOV) fMRI task

Affiliations

Task-based functional connectivity of the Useful Field of View (UFOV) fMRI task

Jessica N Kraft et al. Geroscience. 2023 Feb.

Abstract

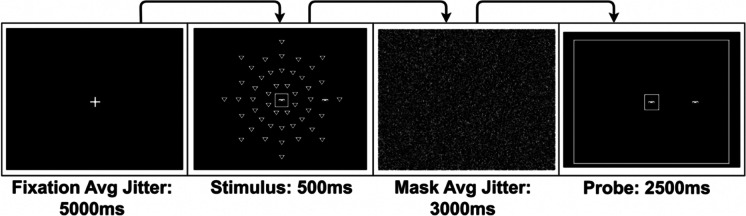
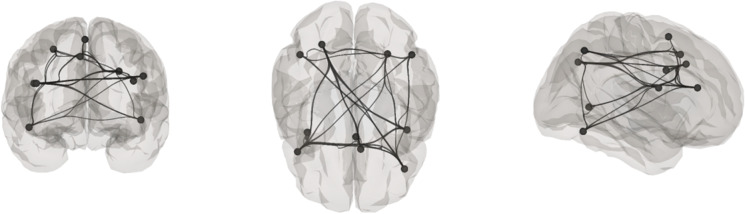
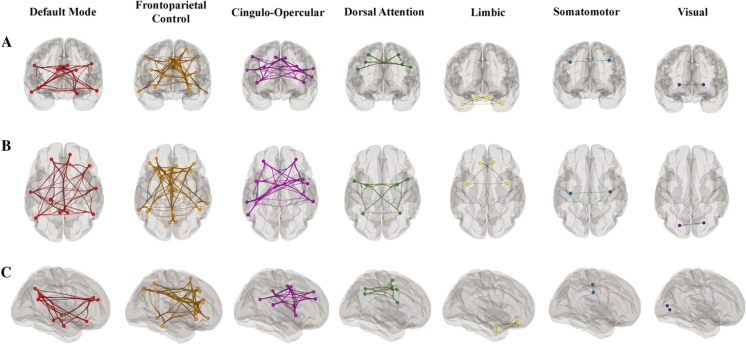
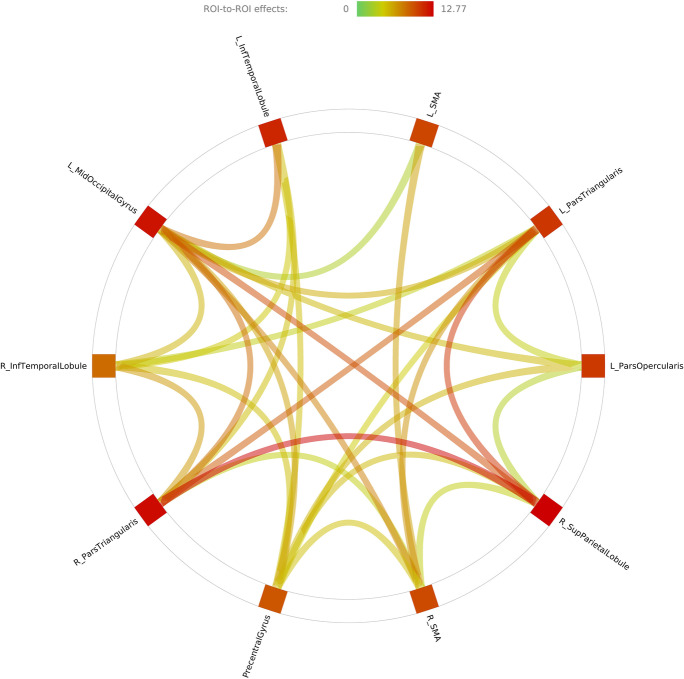
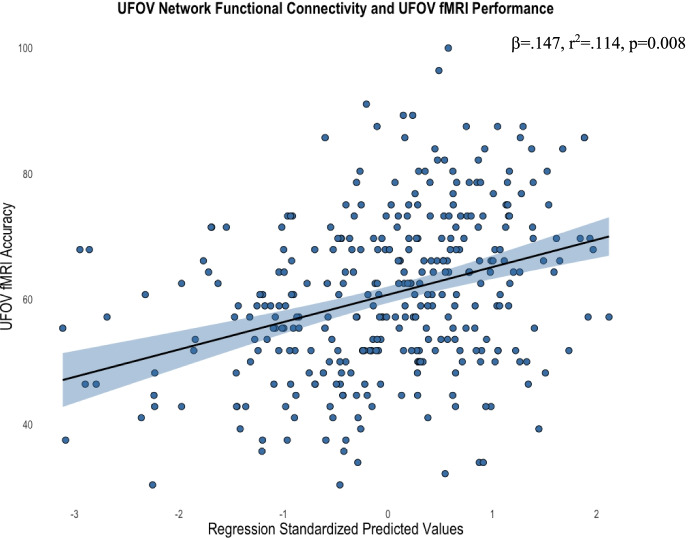
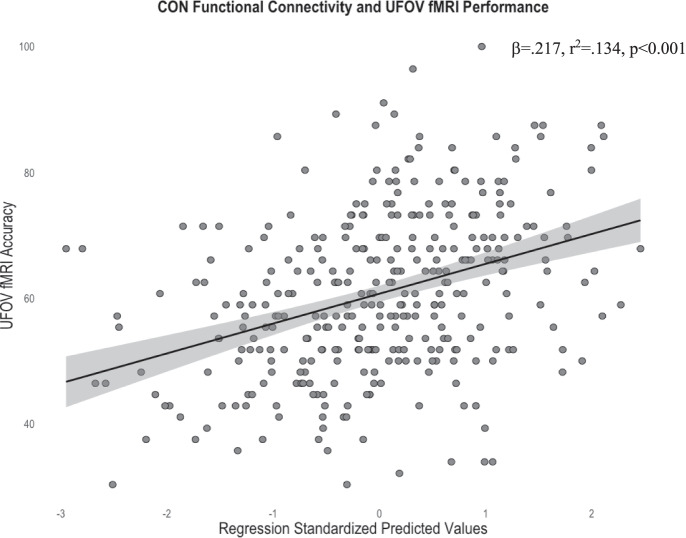
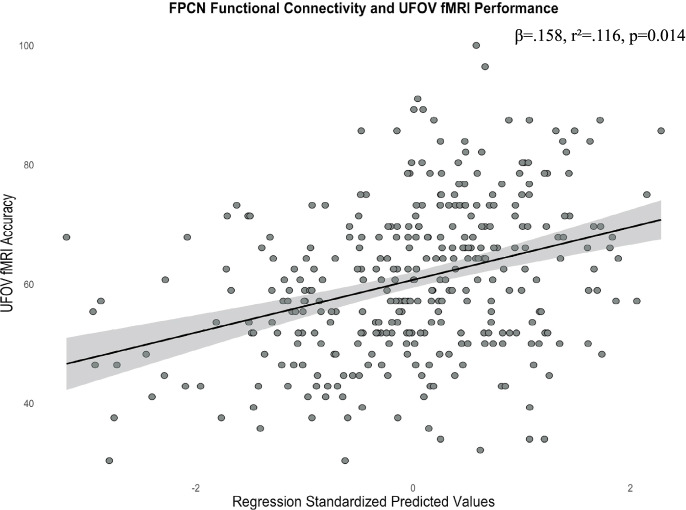
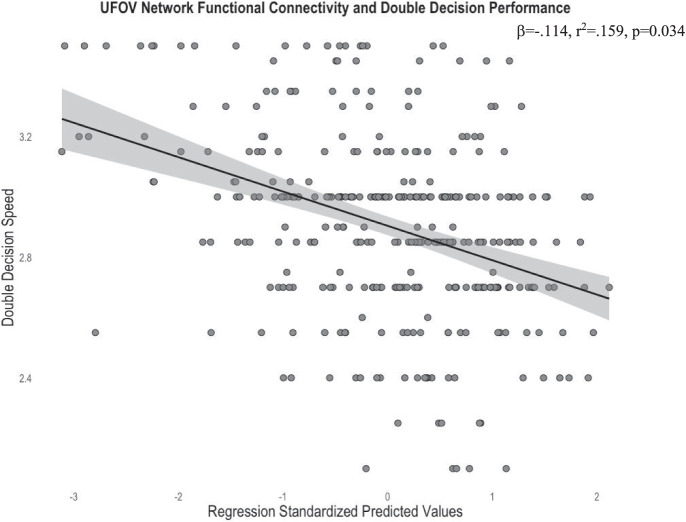
Declines in processing speed performance occur in aging and are a critical marker of functional independence in older adults. Numerous studies suggest that Useful Field of View (UFOV) training may ameliorate cognitive decline in older adults. Despite its efficacy, little is known about the neural correlates of this task. The current study is the first to investigate the coherence of functional connectivity during UFOV task completion. A total of 336 participants completed the UFOV task while undergoing task-based functional magnetic resonance imaging (fMRI). Ten spherical regions of interest (ROIs), selected a priori, were created based on regions with the greatest peak BOLD activation patterns in the UFOV fMRI task and regions that have been shown to significantly relate to UFOV fMRI task performance. We used a weighted ROI-to-ROI connectivity analysis to model task-specific functional connectivity strength between these a priori selected ROIs. We found that our UFOV fMRI network was functionally connected during task performance and was significantly associated to UFOV fMRI task performance. Within-network connectivity of the UFOV fMRI network showed comparable or better predictive power in accounting for UFOV accuracy compared to 7 resting state networks, delineated by Yeo and colleagues. Finally, we demonstrate that the within-network connectivity of UFOV fMRI task accounted for scores on a measure of "near transfer", the Double Decision task, better than the aforementioned resting state networks. Our data elucidate functional connectivity patterns of the UFOV fMRI task. This may assist in future targeted interventions that aim to improve synchronicity within the UFOV fMRI network.

Keywords: Cognitive aging; Functional connectivity; UFOV; Useful field of view.


Conflict of interest statement

The authors declare no competing interests.

Figures

Fig. 1
Fig. 1
Useful field of view task [32]
Fig. 2
Fig. 2
Example of the POSIT Double Decision paradigm. Reproduced/adapted from POSIT Brain HQ, used with permission
Fig. 3
Fig. 3
UFOV network displayed on anterior, superior, and lateral right hemisphere views, displayed on grey matter mask
Fig. 4
Fig. 4
Resting-state networks displayed on grey matter mask with A. anterior B. superior and C. right lateral hemisphere views. Each network is color-coded; however, the colors do not depict correlation strength [28]
Fig. 5
Fig. 5
Connectome ring of ROI-to-ROI task-based functional connectivity using the 10 a priori spherical ROIs. The color of the connections and color bar refer to connectivity t-values. Specific p values of ROI-to-ROI connections can be found in Supplemental Table 1
Fig. 6
Fig. 6
Scatterplot depicting the significant relationship between average within-network connectivity of the UFOV network and accuracy on the UFOV fMRI task, controlling for age, sex, years of education, and scanner type (standardized predicted values). Standardized predicted values are calculated by subtracting the mean predicted value of within-network connectivity of the UFOV network (given the mean age, sex, education, and scanner type) from the individual’s predicted value of within-network connectivity of the UFOV network (given an individual’s age, sex, education, and scanner type). This difference is divided by the standard deviation of the predicted values to allow for comparisons between individuals controlling for demographics. Standardized predicted values have a mean of 0 and a standard deviation of 1. Shaded region represents the 95% confidence interval of the regression line
Fig. 7
Fig. 7
Scatterplot depicting the significant relationship between average within-network connectivity of the CON and accuracy on the UFOV fMRI task, controlling for age, sex, years of education, and scanner type (standardized predicted values). Standardized predicted values are calculated by subtracting the mean predicted value of within-network connectivity of the CON (given the mean age, sex, education, and scanner type) from the individual’s predicted value of within-network connectivity of the CON (given an individual’s age, sex, education, and scanner type). This difference is divided by the standard deviation of the predicted values to allow for comparisons between individuals controlling for demographics. Standardized predicted values have a mean of 0 and a standard deviation of 1. Shaded region represents the 95% confidence interval of the regression line
Fig. 8
Fig. 8
Scatterplot depicting the significant relationship between average within-network connectivity of the FPCN and accuracy on the UFOV fMRI task, controlling for age, sex, years of education, and scanner type (standardized predicted values). Standardized predicted values are calculated by subtracting the mean predicted value of within-network connectivity of the FPCN (given the mean age, sex, education and scanner type) from the individual’s predicted value of within-network connectivity of the FPCN (given an individual’s age, sex, education, and scanner type). This difference is divided by the standard deviation of the predicted values to allow for comparisons between individuals controlling for demographics. Standardized predicted values have a mean of 0 and a standard deviation of 1. Shaded region represents the 95% confidence interval of the regression line
Fig. 9
Fig. 9
Scatterplot depicting the significant relationship between average within-network connectivity of the UFOV network and faster Double Decision presentation, controlling for age, sex, years of education, and scanner type. Standardized predicted values are calculated by subtracting the mean predicted value of within-network connectivity of the UFOV network (given the mean age, sex, education, and scanner type) from the individual’s predicted value of within-network connectivity of the UFOV network (given an individual’s age, sex, education, and scanner type). This difference is divided by the standard deviation of the predicted values to allow for comparisons between individuals controlling for demographics. Standardized predicted values have a mean of 0 and a standard deviation of 1. Shaded region represents the 95% confidence interval of the regression line

Similar articles

Cited by

References

    1. Park DC, Lautenschlager G, Hedden T, Davidson NS, Smith AD, Smith PK. Models of visuospatial and verbal memory across the adult life span. Psychol Aging. 2002;17(2):299–320. - PubMed
    1. Salthouse TA. The processing-speed theory of adult age differences in cognition. Psychol Rev. 1996;103(3):403–428. - PubMed
    1. Anderson M, Nettelbeck T, Barlow J. Reaction time measures of speed of processing: speed of response selection increases with age but speed of stimulus categorization does not. Br J Dev Psychol. 1997;15(2):145–157.
    1. Edwards JD, Ruva CL, Brien JLO, Haley CB, Lister JJ. An examination of mediators of the transfer of cognitive speed of processing training to everyday functional performance. Psychol Aging. 2014;28(2):314–321. - PMC - PubMed
    1. Wolinsky FD, Mahncke HW, Kosinski M, Unverzagt FW, Smith DM, Jones RN, et al. The ACTIVE cognitive training trial and predicted medical expenditures. BMC Health Serv Res. 2009;9:1–9. - PMC - PubMed

Publication types