. 2022 Aug 11;14(1):86.
doi: 10.1186/s13073-022-01090-2.

Clonal evolution in primary breast cancers under sequential epirubicin and docetaxel monotherapy

Affiliations

Clonal evolution in primary breast cancers under sequential epirubicin and docetaxel monotherapy

Andreas Venizelos et al. Genome Med. .

Abstract

Background: Subclonal evolution during primary breast cancer treatment is largely unexplored. We aimed to assess the dynamic changes in subclonal composition of treatment-naïve breast cancers during neoadjuvant chemotherapy.

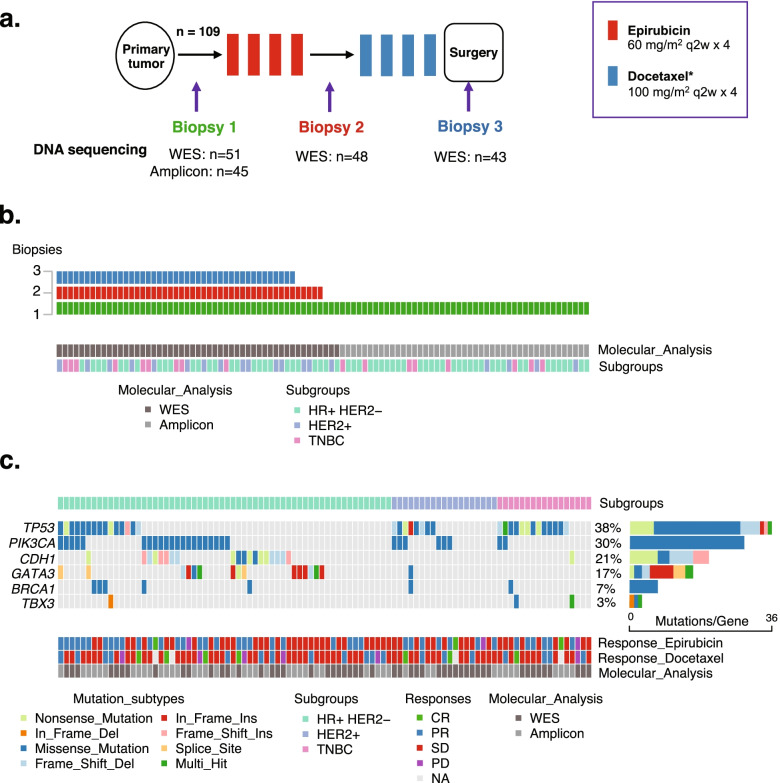
Methods: We performed whole exome sequencing of tumor biopsies collected before, at therapy switch, and after treatment with sequential epirubicin and docetaxel monotherapy in 51 out of 109 patients with primary breast cancer, who were included in a prospectively registered, neoadjuvant single-arm phase II trial.

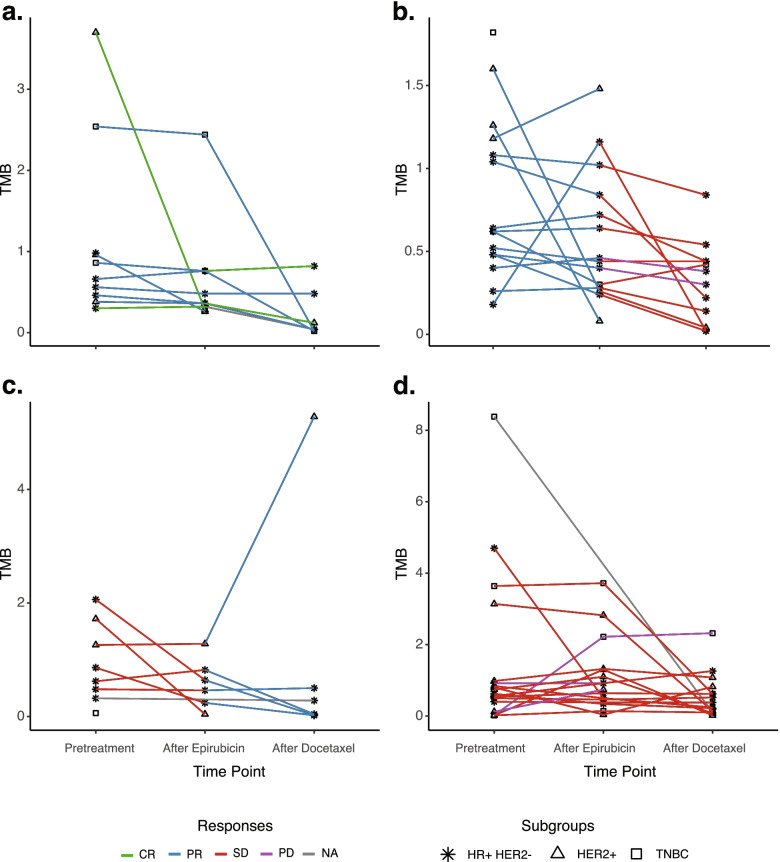
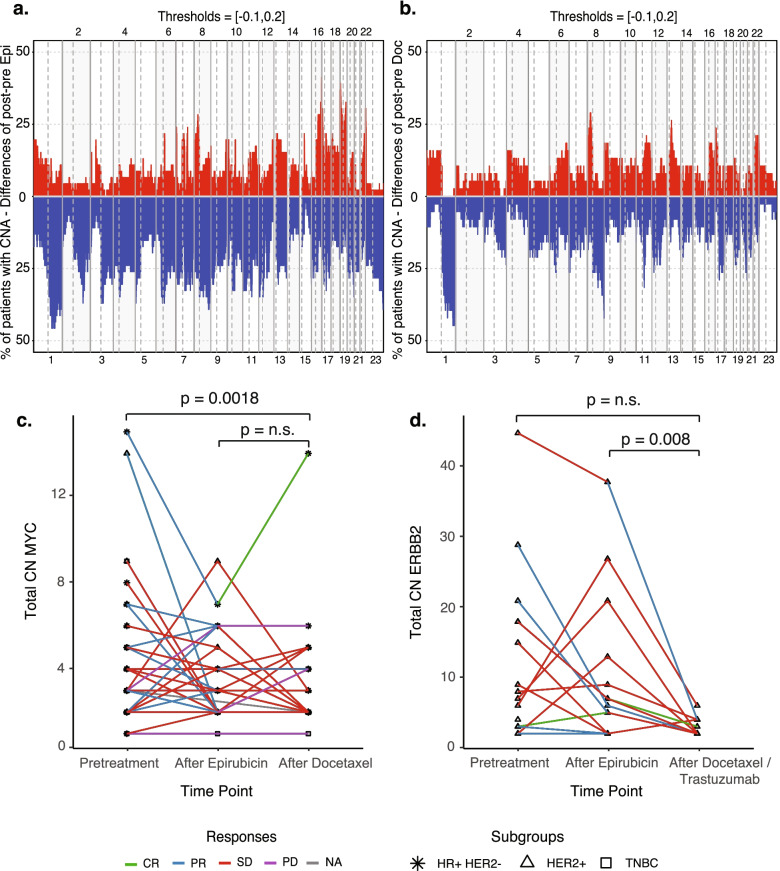
Results: There was a profound and differential redistribution of subclones during epirubicin and docetaxel treatment, regardless of therapy response. While truncal mutations and main subclones persisted, smaller subclones frequently appeared or disappeared. Reassessment of raw data, beyond formal mutation calling, indicated that the majority of subclones seemingly appearing during treatment were in fact present in pretreatment breast cancers, below conventional detection limits. Likewise, subclones which seemingly disappeared were still present, below detection limits, in most cases where tumor tissue remained. Tumor mutational burden (TMB) dropped during neoadjuvant therapy, and copy number analysis demonstrated specific genomic regions to be systematically lost or gained for each of the two chemotherapeutics.

Conclusions: Sequential epirubicin and docetaxel monotherapy caused profound redistribution of smaller subclones in primary breast cancer, while early truncal mutations and major subclones generally persisted through treatment.

Trial registration: ClinicalTrials.gov, NCT00496795 , registered on July 4, 2007.

Keywords: Breast cancer; Chemoresistance; Clonal evolution; Neoadjuvant chemotherapy.


Conflict of interest statement

JG received honoraria for consulting, advisory role, speaker’s bureau, and/or research funding from AstraZeneca, BMS, Daiichi Sankyo, Eli Lilly, MSD, Novartis, Pfizer, Pierre Fabre, and Roche, all outside the submitted work. PEL received honoraria for consulting, advisory role, speaker’s bureau, and/or research funding from AbbVie, Akademikonferens, AstraZeneca, Farmaceuticos Rovi, Illumina, Laboratorios, Novartis, Pfizer, Pierre-Fabre, and Roche, all outside the submitted work. SK received honoraria for consulting, advisory role, speaker’s bureau, and/or research funding from AstraZeneca, Illumina, Pfizer, and Pierre Fabre, all outside the submitted work. HPE received honoraria for consulting, advisory role, speaker’s bureau, and/or research funding from Amgen, Aptitude Health, AstraZeneca, BMS, Daiichi Sankyo, Eli Lilly, Hai Interaktiv, MSD, Novartis, Pfizer, Pierre Fabre, and Roche, all outside the submitted work. The remaining authors declare that they have no competing interests.

Figures

Fig. 1
Fig. 1
a Dose-Dense trial design. All patients (n = 109) received sequential epirubicin and docetaxel monotherapy*. Biopsies were collected before treatment, after epirubicin, and after docetaxel. Whole exome sequencing (WES) was performed for 51 patients in pretreatment tumor biopsies and matched blood samples. Among these 51 patients, repeated tumor biopsies after epirubicin (n = 48) and after docetaxel (n = 43) were subjected to WES (all 43 patients with biopsies after docetaxel were among the 48 with biopsies after epirubicin). Out of the remaining 58 patients in the trial, pretreatment tumor biopsies from 45 underwent amplicon-based targeted sequencing of a six-gene panel. b Diagram depicting the number of tumor biopsies used for DNA sequencing pretreatment (green), after epirubicin (red), and after docetaxel (blue). Out of 96 pretreatment biopsies, WES was performed on 51 (dark gray) and amplicon-based sequencing on the remaining 45 samples (light gray), whereas subsequent analyses after epirubicin (n = 48) and docetaxel treatment (n = 43) were performed by WES only. The distribution of breast cancer subgroups (hormone receptor positive, HER2 normal (HR+HER2−), HER2 positive (HER2+), and triple-negative breast cancers (TNBC)) are indicated by light green, purple, and pink bars, respectively, in the lower panel. c Mutation status pretreatment. Oncoplot showing mutations of six genes in pretreatment samples from all patients in the study with available tumor DNA (n = 96). The mutation list is sorted by the subgroups; HR+/HER2−, HER2+, and TNBC. Mutations are colored according to mutation type. Percentages and bars on the right indicate the prevalence of mutations in each of the genes, among the 96 tumor samples analyzed. Each column represents one tumor/patient. Colors in the lower panel show the individual clinical responses to sequential epirubicin and docetaxel* neoadjuvant chemotherapy, and the molecular analysis used for each tumor sample (whole exome sequencing (WES) or amplicon-based sequencing). Responses listed: CR (complete response), PR (partial response), SD (stable disease), according to RECIST, and PD (progressive disease), according to UICC criteria. *HER2-positive breast cancers received concomitant docetaxel and trastuzumab
Fig. 2
Fig. 2
Changes in tumor mutational burden during treatment. Parallel coordinate plots showing changes in tumor mutational burden (TMB) for individual breast cancers undergoing sequential epirubicin and docetaxel*. TMB was assessed by whole exome sequencing (WES) in pretreatment samples, post-epirubicin, and post-docetaxel. Y-axes indicate the TMB. Results are split by response groups: a objective response (CR, complete response, or PR, partial response) to both drugs. b Objective response to epirubicin; no response to docetaxel (SD, stable disease, or PD, progressive disease). c No response to epirubicin; objective response to docetaxel. d No response to either epirubicin or docetaxel. Green lines: CR, blue lines: PR, red lines: SD, purple lines: PD, gray line: non-evaluable response (NE). Single point, without line: only one biopsy available for analysis. Asterisk: hormone receptor positive, HER2 normal (HR+HER2−) tumors; triangle: HER2+ tumors; squares: triple-negative breast cancers (TNBC). A significant drop in TMB was observed under epirubicin treatment, among objective responders (p = 0.043; left sides of panels a and b). A significant drop in TMB was also observed under docetaxel treatment and non-responders (p = 0.006; right sides of panels b and d). *HER2-positive breast cancers received concomitant docetaxel and trastuzumab
Fig. 3
Fig. 3
Dynamics of copy number alterations during treatment. a, b Changes in copy number alterations (CNA) during sequential epirubicin and docetaxel treatment* a pre- to post-epirubicin and b pre- to post-docetaxel. Bars indicate the differences in fraction of patients with CNA (i.e., the difference: fraction of patients with CNAs in post-treatment samples minus the corresponding number in pretreatment samples). The Y-axis indicates the difference in copy number losses (blue) and gains (red). Chromosome numbers are indicated on the X-axis. Chromosomes and chromosome arms are separated by vertical lines and shaded background. For specific CNAs called as driver events in biopsies pretreatment, after epirubicin, and/or after docetaxel in individual patients, see Additional file 3: Fig. S10. c Parallel coordinate plots showing total copy number changes for MYC across the three time points (pretreatment, post-epirubicin, and post-docetaxel*), n = 51 tumors analyzed by whole exome sequencing (WES). The Y-axis indicates copy numbers, and the X-axis indicates the time points. Lines are colored based on the response to each of the two treatments. Asterisk: hormone receptor positive, HER2 normal (HR+HER2−) tumors; triangle: HER2+ tumors; squares: triple-negative breast cancers (TNBC). MYC copy numbers were significantly lowered during docetaxel treatment. d Parallel coordinate plots showing total copy number changes for ERRB2 across the three time points (pretreatment, post-epirubicin, and post-docetaxel/trastuzumab), n = 15 tumors/patients analyzed by WES. The Y-axis indicates copy numbers and the X-axis the time points. Lines are colored based on the response to each of the two treatments. Asterisk: HR+HER2− tumors, triangle: HER2+ tumors, squares: TNBC. ERBB2 copy numbers are significantly lower after docetaxel and trastuzumab treatment as compared to post-epirubicin tumors. *HER2-positive breast cancers received concomitant docetaxel and trastuzumab
Fig. 4
Fig. 4
Clonal evolution during treatment. Graphical representation of clonal evolution during sequential epirubicin and docetaxel*, for selected patients: a DDP013, b DDP076, c DDP014, and d DDP103. The top panel within each subfigure (ad) show allelic prevalence of mutation clusters, after clustering using the PyClone algorithm (see Additional file 1), based on variant allele frequencies (VAFs) for all mutations in the samples extracted for each patient. “Clusters” with one mutation have been merged to nearest cluster based on z-score (range of −1, +1) probability. Subsequent clusters with <3 mutations have been removed from the panel, for clarity. The middle panel within each subfigure is a visualization of a likely pattern of tumor evolution using the “timescape algorithm” (see Additional file 1). These models are based on the clusters in the top panels. Diagrams do not distinguish between new subclones appearing, harboring all truncal mutations and those appearing that have lost some truncal mutations. Each color represents an estimated subclone from the mutation clusters. The horizontal axis denotes three different time points during tumor evolution: pretreatment, post-epirubicin, and post-docetaxel. The bottom panel within each subfigure (coxcomb plots) represents somatic aberrations (mutations and copy number alterations; CNAs) for each time point (pretreatment, post-epirubicin, and post-docetaxel). Gray wedges represent merged “passenger mutations” while colored wedges represent driver somatic mutations and driver CNAs. Relative variant allele frequencies (rVAFs) as well as logR are presented by lateral extension of an outlined wedge. *HER2-positive breast cancers received concomitant docetaxel and trastuzumab
Fig. 5
Fig. 5
Changes in allele fractions of key drivers during treatment. a Parallel coordinate plots showing the relative variant allele frequency (rVAF; corrected for tumor cell fraction) for mutations in key breast cancer genes, across sequential epirubicin and docetaxel* for individual patients harboring mutations in these genes. Lines are colored based on the response to each of the two treatments. Asterisk: hormone receptor positive, HER2 normal (HR+HER2−) tumors; triangle: HER2+ tumors; squares: triple-negative breast cancers (TNBC). b Plots for alterations in signaling pathways/biological processes. The Y-axis indicates rVAF for mutations affecting genes involved in the illustrated pathways, while the X-axis indicates the three time points (pretreatment, post-epirubicin, and post-docetaxel). Lines are colored based on the response of each of the two treatments. Asterisk: HR+HER2− tumors, triangle: HER2+ tumors, squares: TNBC. *HER2-positive breast cancers received concomitant docetaxel and trastuzumab

Similar articles

Cited by

References

    1. Bertucci F, Ng CKY, Patsouris A, Droin N, Piscuoglio S, Carbuccia N, et al. Genomic characterization of metastatic breast cancers. Nature. 2019;569(7757):560–564. doi: 10.1038/s41586-019-1056-z. - DOI - PubMed
    1. The-Cancer-Genome-Atlas-Network Comprehensive molecular portraits of human breast tumours. Nature. 2012;490(7418):61–70. doi: 10.1038/nature11412. - DOI - PMC - PubMed
    1. Yates LR, Gerstung M, Knappskog S, Desmedt C, Gundem G, Van Loo P, et al. Subclonal diversification of primary breast cancer revealed by multiregion sequencing. Nat Med. 2015;21(7):751–759. doi: 10.1038/nm.3886. - DOI - PMC - PubMed
    1. Nik-Zainal S, Davies H, Staaf J, Ramakrishna M, Glodzik D, Zou X, et al. Landscape of somatic mutations in 560 breast cancer whole-genome sequences. Nature. 2016;534(7605):47–54. doi: 10.1038/nature17676. - DOI - PMC - PubMed
    1. PCAWG I-T Pan-cancer analysis of whole genomes. Nature. 2020;578(7793):82–93. doi: 10.1038/s41586-020-1969-6. - DOI - PMC - PubMed

Publication types

Associated data