. 2022 Aug 10;19(1):62.
doi: 10.1186/s12987-022-00360-w.

Posthemorrhagic hydrocephalus associates with elevated inflammation and CSF hypersecretion via activation of choroidal transporters

Affiliations

Posthemorrhagic hydrocephalus associates with elevated inflammation and CSF hypersecretion via activation of choroidal transporters

Sara Diana Lolansen et al. Fluids Barriers CNS. .

Abstract

Introduction: Posthemorrhagic hydrocephalus (PHH) often develops following hemorrhagic events such as intraventricular hemorrhage (IVH) and subarachnoid hemorrhage (SAH). Treatment is limited to surgical diversion of the cerebrospinal fluid (CSF) since no efficient pharmacological therapies are available. This limitation follows from our incomplete knowledge of the molecular mechanisms underlying the ventriculomegaly characteristic of PHH. Here, we aimed to elucidate the molecular coupling between a hemorrhagic event and the subsequent PHH development, and reveal the inflammatory profile of the PHH pathogenesis.

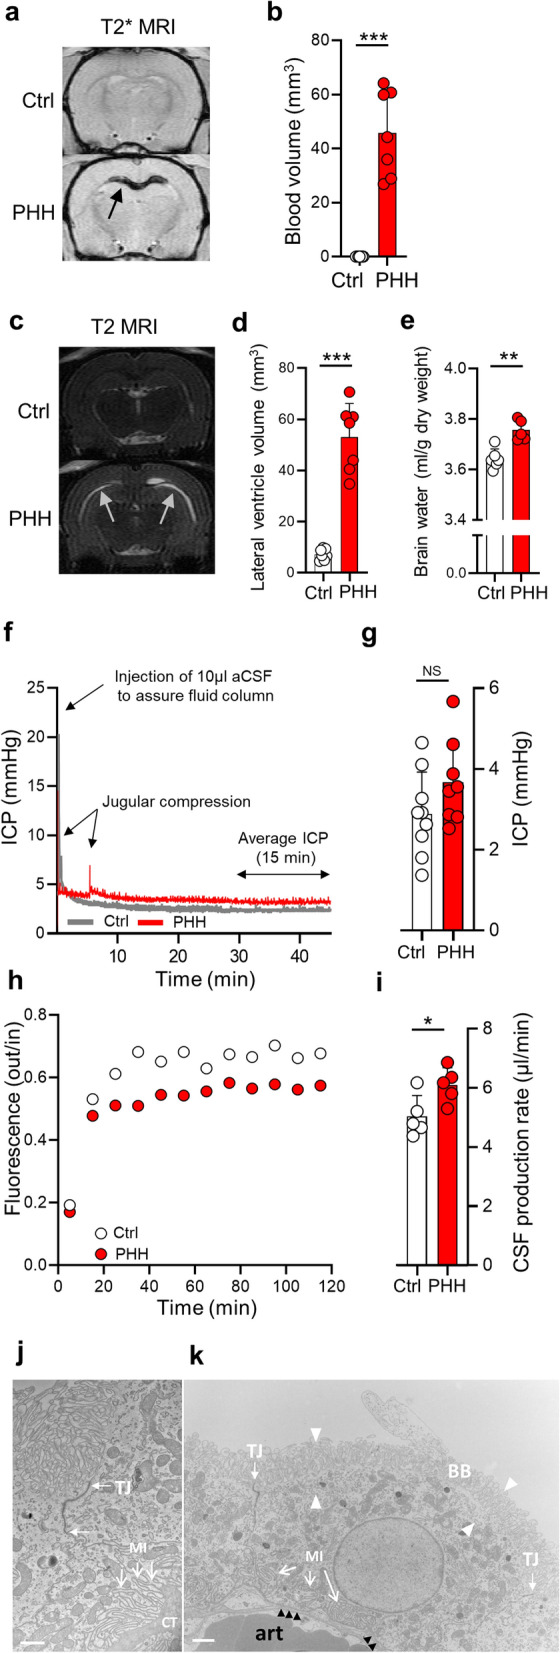
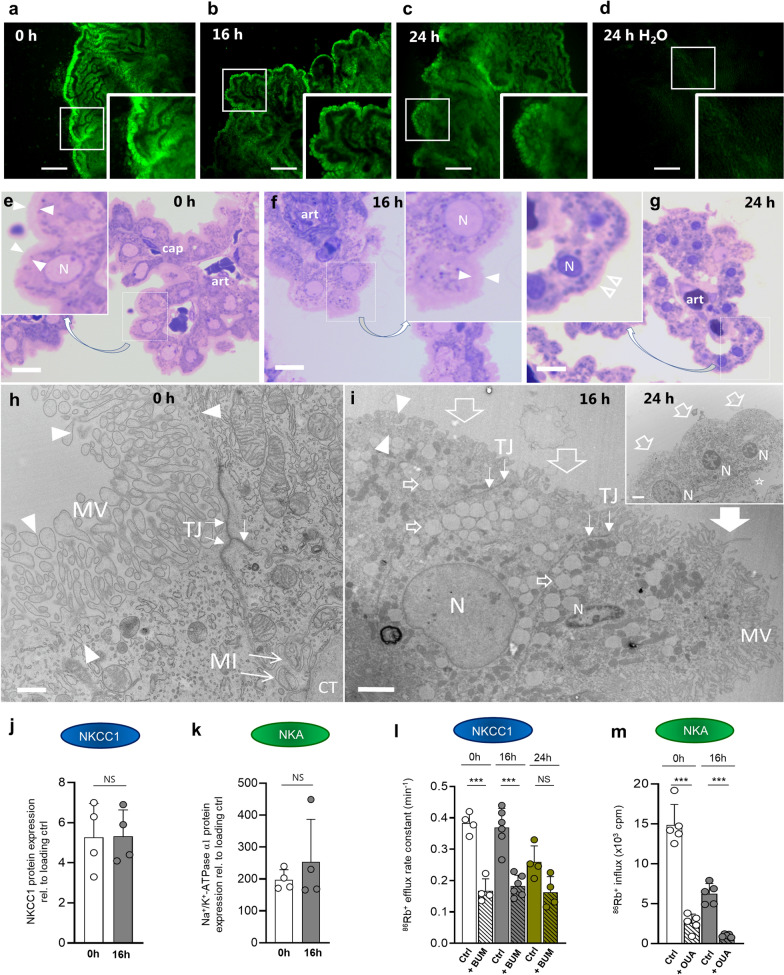
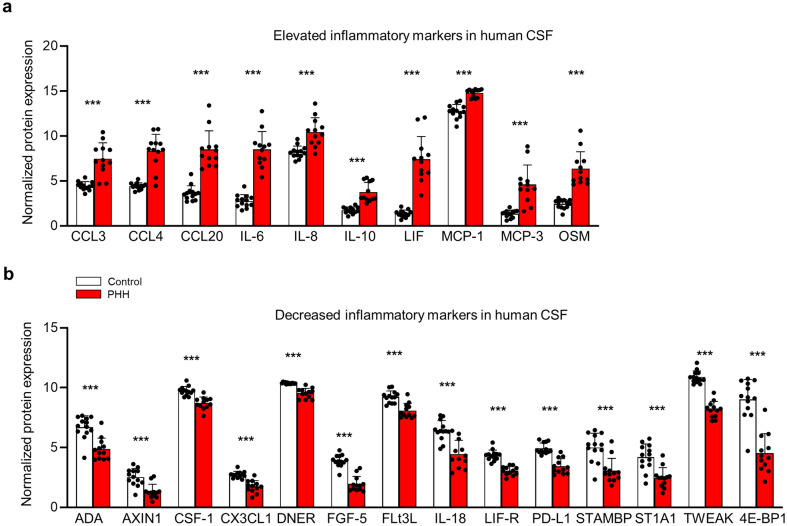
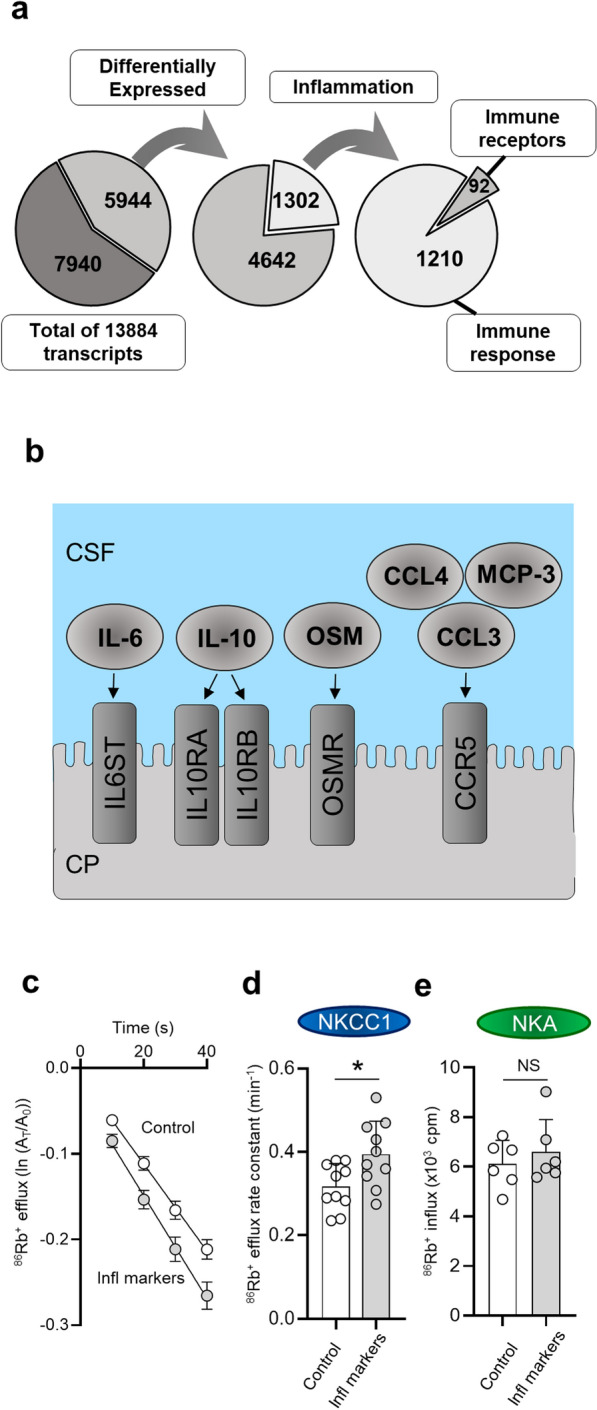
Methods: CSF obtained from patients with SAH was analyzed for inflammatory markers using the proximity extension assay (PEA) technique. We employed an in vivo rat model of IVH to determine ventricular size, brain water content, intracranial pressure, and CSF secretion rate, as well as for transcriptomic analysis. Ex vivo radio-isotope assays of choroid plexus transport were employed to determine the direct effect of choroidal exposure to blood and inflammatory markers, both with acutely isolated choroid plexus and after prolonged exposure obtained with viable choroid plexus kept in tissue culture conditions.

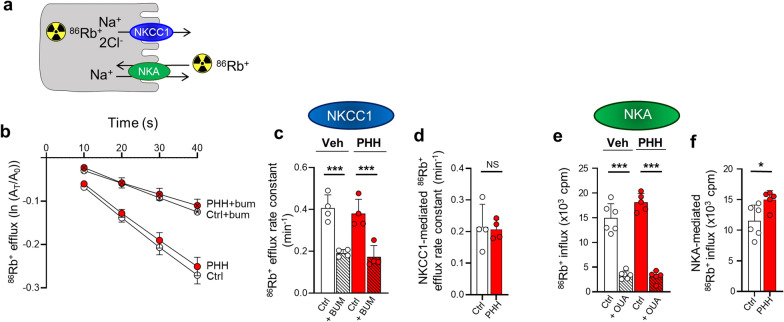
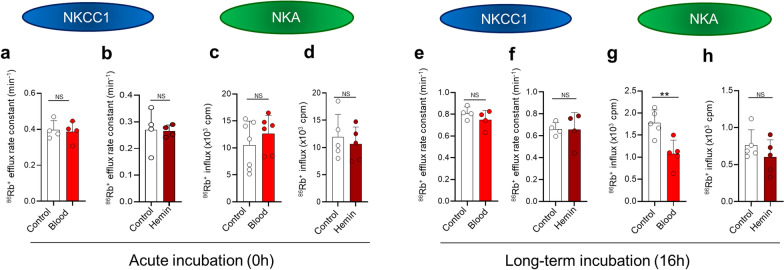
Results: The rat model of IVH demonstrated PHH and associated CSF hypersecretion. The Na+/K+-ATPase activity was enhanced in choroid plexus isolated from IVH rats, but not directly stimulated by blood components. Inflammatory markers that were elevated in SAH patient CSF acted on immune receptors upregulated in IVH rat choroid plexus and caused Na+/K+/2Cl- cotransporter 1 (NKCC1) hyperactivity in ex vivo experimental conditions.

Conclusions: CSF hypersecretion may contribute to PHH development, likely due to hyperactivity of choroid plexus transporters. The hemorrhage-induced inflammation detected in CSF and in the choroid plexus tissue may represent the underlying pathology. Therapeutic targeting of such pathways may be employed in future treatment strategies towards PHH patients.

Keywords: Biomarkers; Cerebrospinal fluid; Choroid plexus; Immune response; Intraventricular hemorrhage; Posthemorrhagic hydrocephalus; Subarachnoid hemorrhage.


Conflict of interest statement

The authors declare that they have not competing interests.

Figures

Fig. 1
Fig. 1
PHH is associated with excessive brain water accumulation and CSF hypersecretion. a Representative T2* weighted MRI rat brain sections 24 h after injection of 200 µl sterile saline (ctrl) or autologous blood (PHH) into the right lateral ventricle. The dark region (black arrow) indicates presence of blood. b Blood volume quantification from MRI sections 24 h after injection of saline (ctrl, n = 7) or autologous blood (PHH, n = 7). c Representative T2 weighted MRI rat brain sections 24 h after injection of saline (ctrl) or autologous blood (PHH) into the right lateral ventricle. The bright regions (white arrows) indicate presence of CSF within the lateral ventricles. d Lateral ventricle volume quantification from MRI sections 24 h after injection of saline (ctrl, n = 7) or autologous blood (PHH, n = 7). e Brain water content quantified from control rats (n = 6) and PHH rats (n = 5) 24 h post IVH using the wet and dry brain weight. f Representative ICP traces for one control rat and one PHH rat 24 h post IVH. g Average ICP in control (n = 9) and PHH rats (n = 8) quantified from a stable 15 min time period. h Representative time course traces of the fluorescence ratio of dextran (outflow/inflow) during ventriculo-cisternal perfusion of one control rat and one PHH rat 24 h post IVH. i Average CSF production rate in control (n = 5) and PHH rats (n = 5) quantified from the fluorescence ratio of dextran after obtaining a stable baseline (at 60 min). Electron microscopy of choroid plexus isolated from rats subjected to control saline treatment (j) or IVH (k) for 24 h. Saline-treated choroid plexus shows the typical well-developed brush border, tight junctions (TJ), and extensive basolateral membrane infoldings (MI) towards the underlying basal membrane and connective tissue (CT). Choroid plexus obtained from IVH rats (k) displayed intact differentiated traits, also in the organelle-sparse cortical zone (in between arrowheads). Black arrows point to a thin rim of connective tissue separating the epithelium from an underlying arteriole (art). Scale bars, 1 mm. Error bars represent standard deviation and statistical significance was tested with an unpaired two-tailed t-test. *P < 0.05, **P < 0.01, ***P < 0.001, NS not significant
Fig. 2
Fig. 2
PHH associates with Na+/K+-ATPase hyperactivity. a Schematic illustration of the principle behind the 86Rb+ isotope flux assays. 86Rb+ is a congener for K+ and can be used to quantify the transport activity. b Loss of 86Rb+ from the choroid plexus as a function of time in control rats (n = 4) and PHH rats (n = 4) in presence or absence of 20 µM bumetanide. The y-axis is the natural logarithm of the choroidal 86Rb+ amount left at time T (AT) divided by the initial amount at time 0 (A0). c Efflux rates for 86Rb+ in control rats (n = 4) and PHH rats (n = 4) in presence of absence of 20 µM bumetanide. d NKCC1-mediated efflux rates (bumetanide-sensitive fractions) for 86Rb+ in control rats (n = 4) and PHH rats (n = 4). e 86Rb+ influx (measured in counts per min; cpm) in control rats (n = 6) and PHH rats (n = 5) in presence or absence of 2 mM ouabain. f NKA-mediated 86Rb+ influx (ouabain-sensitive fractions) in control rats (n = 6) and PHH rats (n = 5). Error bars represent standard deviation and statistical significance was tested with an unpaired two-tailed t-test or a one-way ANOVA followed by Sidak’s multiple comparisons test (c and e). *P < 0.05, ***P < 0.001, NS not significant
Fig. 3
Fig. 3
Blood and its breakdown products do not hyperactivate NKCC1 or the Na+/K+-ATPase in ex vivo choroid plexus. a Loss of 86Rb+ from the choroid plexus shown as efflux rate constants for 86Rb+ in control (n = 4) and after acute exposure to blood (20% of surrounding fluid, n = 4). b Efflux rate constants for 86Rb+ in control and after acute exposure to 50 µM hemin (n = 4 of each). c 86Rb+ influx in control and after acute exposure to blood (20% of surrounding fluid), n = 6–7. d 86Rb+ influx in control and after acute exposure to 50 µM hemin (n = 5 of each). e Efflux rate constants for 86Rb+ in control and after long-term exposure (16 h) to blood (20% of surrounding fluid), n = 4 of each. f Efflux rate constants for 86Rb+ in control and after long-term exposure (16 h) to 50 µM hemin (n = 4 of each). g 86Rb+ influx in control and after long-term exposure (16 h) to blood (20% of surrounding fluid), n = 5 of each. h 86Rb+ influx in control and after long-term exposure (16 h) to 50 µM hemin (n = 5 of each). Error bars represent standard deviation and statistical significance was tested with an unpaired two-tailed t-test. **P < 0.01, NS not significant
Fig. 4
Fig. 4
Isolated choroid plexus is viable and retains it transport activity upon culturing. Isolated rat choroid plexus demonstrated calcein fluorescence, indicative of viable cells, upon tissue culturing for 0, 16 and 24 h (ac), whereas fluorescence was absent in control choroid plexus kept in H2O for 24 h (d). Inserts are magnification of the white boxes. Scale bars 500 μm. Choroid plexus tissue fixed directly after isolation (e) or following 16 h (f) or 24 h (g) of tissue culture and stained with toluidine blue. The boxed areas have been enlarged (insets) to reveal nuclear detail and presence of an organelle-free apical zone that includes the brush border (bounded by arrowheads). Note that after 24 h of culture, the brush border is greatly diminished (open arrowheads), and epithelial cells display small, pyknotic nuclei. Art, arteriole; cap, capillary; N, nucleus. Scale bars 5 mm. Electron micrographs of the choroid plexus acutely isolated (h) or after 16 h of tissue culture (i). At both time points tight junctions (TJ; small, white arrows) and basolateral membrane invaginations (MI; pointed arrows) are well developed, and the extracellular basal membrane remains juxtaposed to underlying loose connective tissue (CT). In tissue cultured for 16 h (i), there is a diminution or disappearance of microvilli in many cell profiles (large, open arrows), whereas other cells retain microvilli (large, closed arrow). Most nuclei are euchromatic, but chromatin condensation has commenced in a minority of cells (nucleus on the right), and in the cytoplasm there are large, empty vacuoles (small, open arrows), but organelles remain intact. Inset in i shows the epithelium after 24 h of culture. Although tight junctions are intact, there are no microvilli left, nuclei are pyknotic, cytolysis has commenced, basal membrane invaginations have disappeared, and the contact with underlying extracellular matrix has been lost (asterisk). Scale bars 500 nm; 2 μm; 2 μm. Quantification of Western blots of acutely isolated rat choroid plexus (0 h) and following tissue culturing (16 h) with anti-NKCC1 antibody (j) or the α1 subunit of the Na+/K+-ATPase (k). Data illustrated as normalized to GAPDH. l 86Rb+ efflux rates obtained in choroid plexus acutely isolated (0 h, n = 4) or after tissue culturing (16 h, n = 6; 24 h, n = 4) with or without the NKCC1 inhibitor bumetanide (BUM, 20 µM). m 86Rb+ influx obtained in choroid plexus acutely isolated (0 h, n = 5) or after 16 h tissue culturing with or without the Na+/K+-ATPase inhibitor ouabain (OUA, 2 mM). Error bars represent standard deviation and statistical significance was tested with an unpaired two-tailed t-test or a one-way ANOVA followed by Sidak’s multiple comparisons test (l and m). ***P < 0.001, NS not significant.
Fig. 5
Fig. 5
Elevated inflammation in CSF from PHH patients. a 10 inflammatory markers were elevated in CSF from PHH patients (n = 12) compared to healthy control subjects (n = 13). b 14 inflammatory markers were decreased in PHH patients compared to healthy control subjects. Data are presented as normalized protein expression (NPX) values (mean ± SD) and analyzed with an unpaired two-tailed t-test or a Mann-Whitney test with Bonferroni correction applied to accommodate multiple comparisons. ***P < 0.001
Fig. 6
Fig. 6
Upregulation of the choroidal immune machinery in PHH rats and NKCC1 hyperactivity. a RNAseq of choroid plexus from PHH and control rats revealed transcription of 13,884 genes. Of the transcripts detected at ≥ 0.5 TPM, 5944 were considered differentially transcribed. A total of 1302 transcripts were linked to inflammation, 92 encoded immune receptors, while the remaining 1210 encoded other inflammatory agents involved in mediating immune responses. b Schematic illustration of those inflammatory markers found elevated in the CSF from PHH patients that also displayed upregulated transcription of their corresponding receptors (or co-receptors) in the rat choroid plexus after IVH. c Choroidal 86Rb+ efflux after 16 h incubation in absence (control, n = 5) or presence (n = 5) of a mix of inflammatory markers (CCL3, OSM, IL-10 and IL-6, all at 500 ng/ml), with the efflux rate constants plotted in d, e Choroidal 86Rb+ influx after 16 h incubation in absence (control, n = 5) or presence (n = 5) of a mix of inflammatory markers (CCL3, OSM, IL-10 and IL-6, all at 500 ng/ml). Error bars represent standard deviation and statistical significance was tested with an unpaired two-tailed t-test. *P < 0.05, NS not significant

Similar articles

Cited by

References

    1. Chen Q, Feng Z, Tan Q, Guo J, Tang J, Tan L, Feng H, Chen Z. Post-hemorrhagic hydrocephalus: recent advances and new therapeutic insights. J Neurol Sci. 2017;375:220–30. doi: 10.1016/j.jns.2017.01.072. - DOI - PubMed
    1. Strahle J, Garton HJL, Maher CO, Muraszko KM, Keep RF, Xi G. Mechanisms of hydrocephalus after neonatal and adult intraventricular hemorrhage. Transl Stroke Res. 2012;3:25–38. doi: 10.1007/s12975-012-0182-9. - DOI - PMC - PubMed
    1. Robinson S. Neonatal posthemorrhagic hydrocephalus from prematurity: pathophysiology and current treatment concepts. J Neurosurg Pediatr. 2012;9:242–58. doi: 10.3171/2011.12.PEDS11136. - DOI - PMC - PubMed
    1. Kuo MF. Surgical management of intraventricular hemorrhage and posthemorrhagic hydrocephalus in premature infants. Biomed J. 2020;43:268–76. doi: 10.1016/j.bj.2020.03.006. - DOI - PMC - PubMed
    1. Mazzola C, Choudhri A, Auguste K, Limbrick D, Rogido M, Mitchell L, Flannery A. Pediatric hydrocephalus: systematic literature review and evidence-based guidelines. Part 2: management of posthemorrhagic hydrocephalus in premature infants. J Neurosurg Pediatr. 2014;14(Suppl 1):8–23. doi: 10.3171/2014.7.PEDS14322. - DOI - PubMed