Web-Based Data to Quantify Meteorological and Geographical Effects on Heat Stroke: Case Study in China
- PMID: 35949256
- PMCID: PMC9356531
- DOI: 10.1029/2022GH000587
Web-Based Data to Quantify Meteorological and Geographical Effects on Heat Stroke: Case Study in China
Abstract
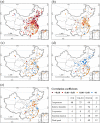
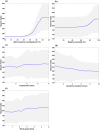
Heat stroke is a serious heat-related health outcome that can eventually lead to death. Due to the poor accessibility of heat stroke data, the large-scale relationship between heat stroke and meteorological factors is still unclear. This work aims to clarify the potential relationship between meteorological variables and heat stroke, and quantify the meteorological threshold that affected the severity of heat stroke. We collected daily heat stroke search index (HSSI) and meteorological data for the period 2013-2020 in 333 Chinese cities to analyze the relationship between meteorological variables and HSSI using correlation analysis and Random forest (RF) model. Temperature and relative humidity (RH) accounted for 62% and 9% of the changes of HSSI, respectively. In China, cases of heat stroke may start to occur when temperature exceeds 36°C and RH exceeds 58%. This threshold was 34.5°C and 79% in the north of China, and 36°C and 48% in the south of China. Compared to RH, the threshold of temperature showed a more evident difference affected by altitude and distance from the ocean, which was 35.5°C in inland cities and 36.5°C in coastal cities; 35.5°C in high-altitude cities and 36°C in low-altitude cities. Our findings provide a possible way to analyze the interaction effect of meteorological variables on heat-related illnesses, and emphasizes the effects of geographical environment. The meteorological threshold quantified in this research can also support policymaker to establish a better meteorological warning system for public health.
Keywords: China; heat strokes; internet search data; meteorological variables; random forest; spatial variations.
© 2022 The Authors. GeoHealth published by Wiley Periodicals LLC on behalf of American Geophysical Union.
Conflict of interest statement
The authors declare no conflicts of interest relevant to this study.
Figures


Similar articles
-
Machine learning-based analysis and prediction of meteorological factors and urban heatstroke diseases.Front Public Health. 2024 Jul 22;12:1420608. doi: 10.3389/fpubh.2024.1420608. eCollection 2024. Front Public Health. 2024. PMID: 39104885 Free PMC article.
-
Influence of Meteorological Factors on the COVID-19 Transmission with Season and Geographic Location.Int J Environ Res Public Health. 2021 Jan 9;18(2):484. doi: 10.3390/ijerph18020484. Int J Environ Res Public Health. 2021. PMID: 33435301 Free PMC article.
-
[Analysis on influencing factors of deaths from severe heat stroke in Shanghai, 2013-2017].Zhonghua Yu Fang Yi Xue Za Zhi. 2019 Jan 6;53(1):93-96. doi: 10.3760/cma.j.issn.0253-9624.2019.01.013. Zhonghua Yu Fang Yi Xue Za Zhi. 2019. PMID: 30605969 Chinese.
-
Forecast and early warning of hand, foot, and mouth disease based on meteorological factors: Evidence from a multicity study of 11 meteorological geographical divisions in mainland China.Environ Res. 2021 Jan;192:110301. doi: 10.1016/j.envres.2020.110301. Epub 2020 Oct 16. Environ Res. 2021. PMID: 33069698
-
Association of sudden sensorineural hearing loss with meteorological factors: a time series study in Hefei, China, and a literature review.Environ Sci Pollut Res Int. 2024 Jun;31(30):42970-42990. doi: 10.1007/s11356-024-33943-1. Epub 2024 Jun 17. Environ Sci Pollut Res Int. 2024. PMID: 38886269 Free PMC article. Review.
Cited by
-
Analysis of clinical characteristics and risk factors for patients with heat stroke in western China in 2022: a multicenter retrospective study.Front Med (Lausanne). 2025 Jan 22;12:1467771. doi: 10.3389/fmed.2025.1467771. eCollection 2025. Front Med (Lausanne). 2025. PMID: 39911862 Free PMC article.
-
Advances in the comprehensive mechanisms, diagnosis, and treatment of heatstroke-induced coagulopathy.Front Cell Dev Biol. 2025 Jul 15;13:1596039. doi: 10.3389/fcell.2025.1596039. eCollection 2025. Front Cell Dev Biol. 2025. PMID: 40735643 Free PMC article. Review.
-
Machine learning-based analysis and prediction of meteorological factors and urban heatstroke diseases.Front Public Health. 2024 Jul 22;12:1420608. doi: 10.3389/fpubh.2024.1420608. eCollection 2024. Front Public Health. 2024. PMID: 39104885 Free PMC article.
-
Comparison of Relationships Between the Number of Deaths Due to the 10 Leading Causes and Air Temperature in Hokkaido and Okinawa, Japan.Cureus. 2024 Aug 31;16(8):e68291. doi: 10.7759/cureus.68291. eCollection 2024 Aug. Cureus. 2024. PMID: 39350881 Free PMC article.
References
-
- Ali, A. M. , Darvishzadeh, R. , Skidmore, A. , Gara, T. W. , & Heurich, M. (2020). Machine learning methods’ performance in radiative transfer model inversion to retrieve plant traits from Sentinel‐2 data of a mixed mountain forest. International Journal of Digital Earth, 14(1), 1–15. 10.1080/17538947.2020.1794064 - DOI
-
- An, G. , Xing, M. , He, B. , Liao, C. , Huang, X. , Shang, J. , & Kang, H. (2020). Using machine learning for estimating rice chlorophyll content from in situ hyperspectral data. Remote Sensing, 12(18), 3104. 10.3390/RS12183104 - DOI
LinkOut - more resources
Full Text Sources
