. 2022 Apr 22;376(6591):science.abl9283.
doi: 10.1126/science.abl9283.

Substitution mutational signatures in whole-genome-sequenced cancers in the UK population

Collaborators, Affiliations

Substitution mutational signatures in whole-genome-sequenced cancers in the UK population

Andrea Degasperi et al. Science. .

Abstract

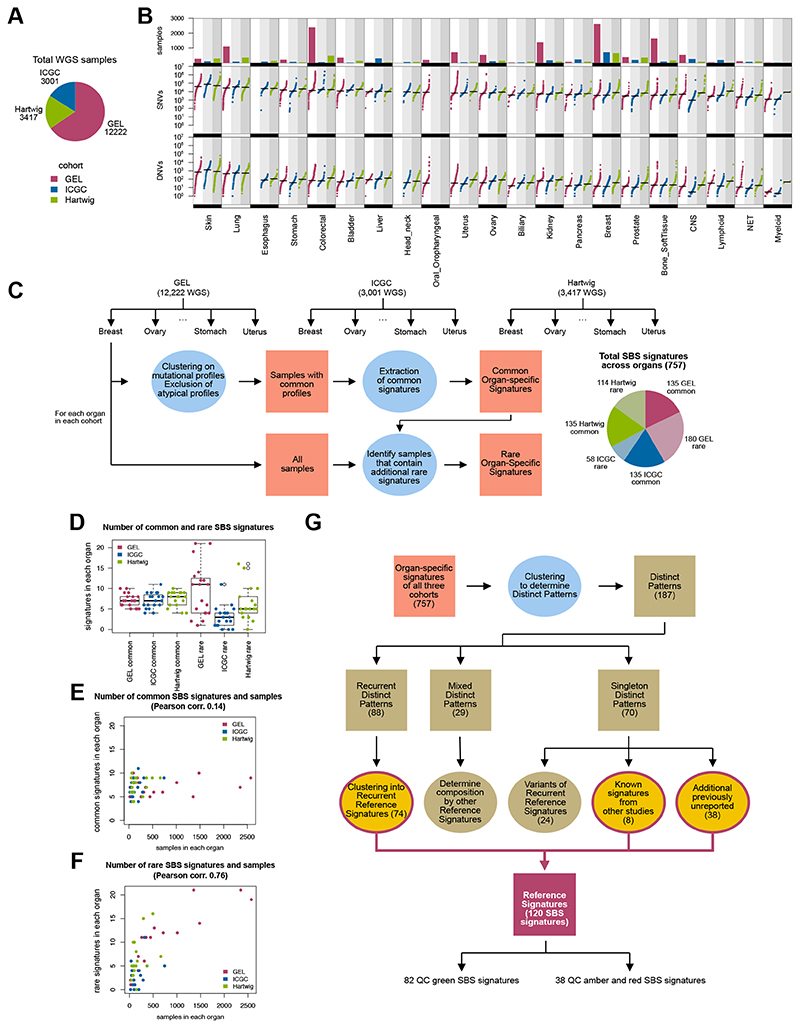
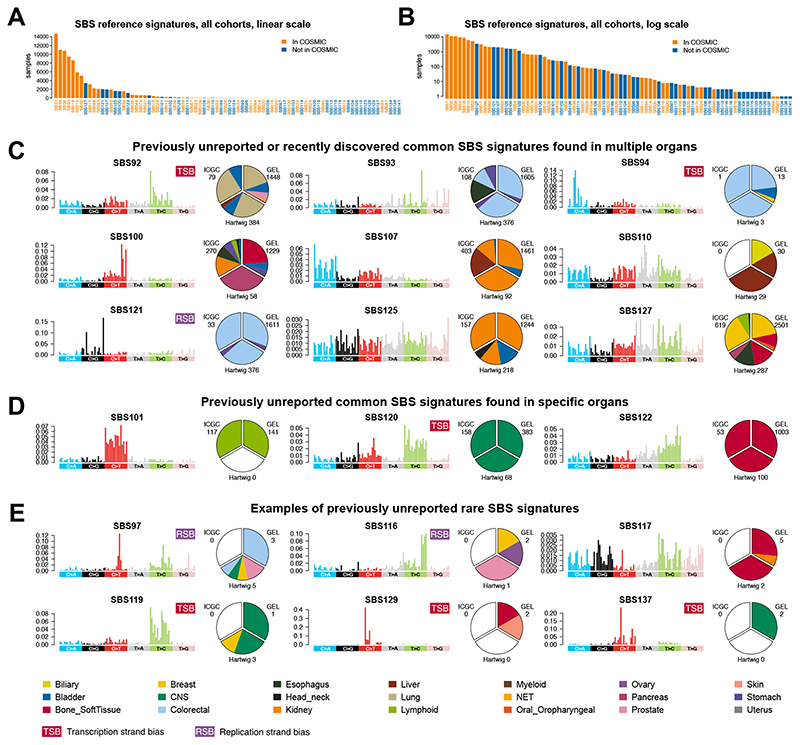
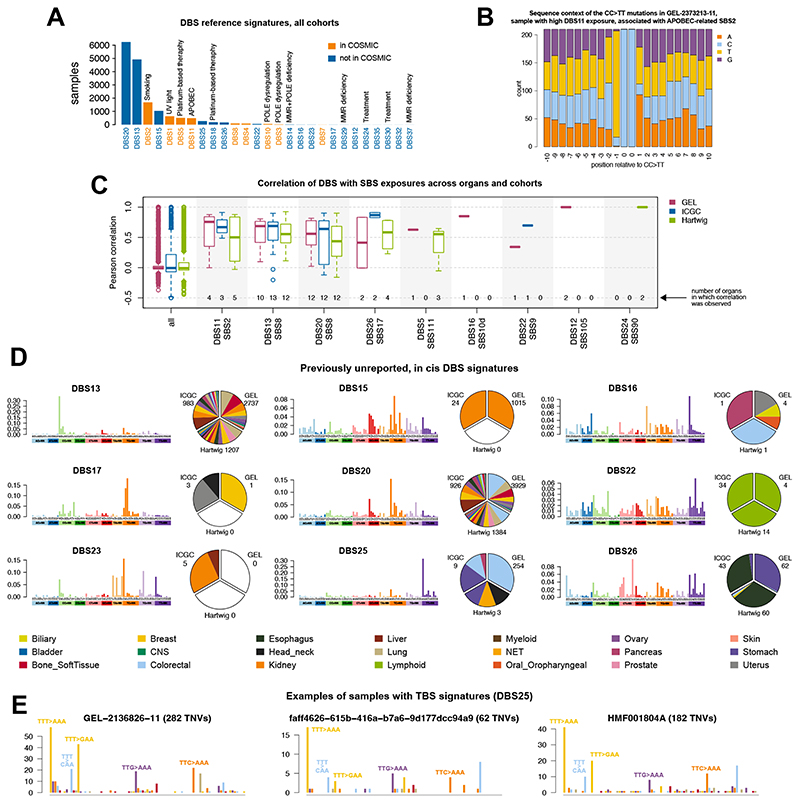
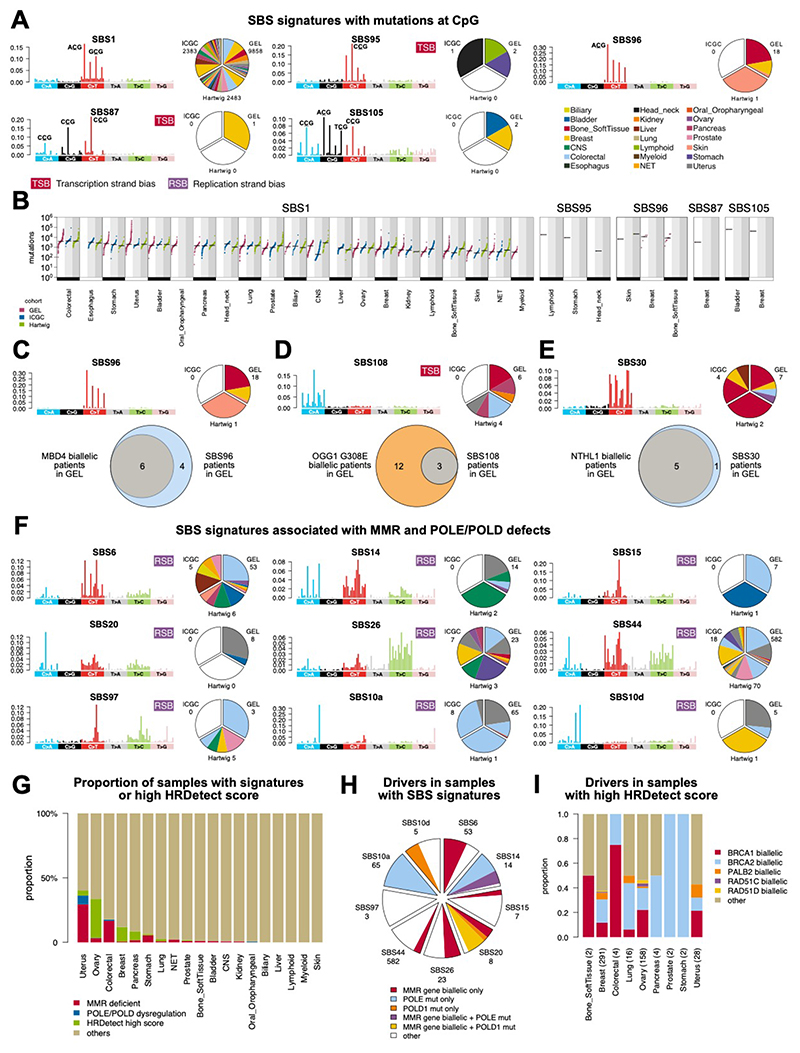
Whole-genome sequencing (WGS) permits comprehensive cancer genome analyses, revealing mutational signatures, imprints of DNA damage and repair processes that have arisen in each patient's cancer. We performed mutational signature analyses on 12,222 WGS tumor-normal matched pairs, from patients recruited via the UK National Health Service. We contrasted our results to two independent cancer WGS datasets, the International Cancer Genome Consortium (ICGC) and Hartwig Foundation, involving 18,640 WGS cancers in total. Our analyses add 40 single and 18 double substitution signatures to the current mutational signature tally. Critically, we show for each organ, that cancers have a limited number of 'common' signatures and a long tail of 'rare' signatures. We provide a practical solution for utilizing this concept of common versus rare signatures in future analyses.


Conflict of interest statement

Competing interests: AD, XZ, HRD and SNZ hold patents or have submitted applications on clinical algorithms of mutational signatures (MMRDetect (number pending), HRDetect: PCT/EP2017/060294, Clinical use of signatures: PCT/EP2017/060289, Rearrangement sigantures methods: PCT/EP2017/060279, Clinical predictor: PCT/EP2017/060298, Hotspots for chromosomal rearrangements: PCT/EP2017/060298) and during this project, served advisory roles for AstraZeneca, Artios Pharma and the Scottish Genomes Project.

Figures

Fig. 1
Fig. 1. WGS cancers across three independent cohorts: GEL, ICGC and Hartwig Medical Foundation.
(A) WGS cases included in analyses. (B) Number of samples and mutational burden of somatic single nucleotide variants (SNVs) and double nucleotide variants (DNVs) across 21 tumor-types that have been WGS’d by GEL, ICGC and Hartwig. Not all tumor-types are represented in all three cohorts (for example, esophagus, head andneck, oropharyngeal). CNS = central nervous system; NET = neuroendocrine tumors. (C) Schematic representation of the workflow of mutational signature analysis. Three cohorts (GEL, ICGC and Hartwig) were evaluated independently. For each organ in each cohort, mutational catalogs were clustered, where samples with atypical catalogs were excluded from the extraction process. Samples with similar catalogs were subjected to signature extraction to obtain a set of common organ-specific signatures. These common signatures were fitted into all samples, highlighting samples that had a high error profile that were subsequently used to identify rare signatures. Pie chart shows the total number of SBS signatures identified for each independent extraction of each organ in all three cohorts. (D) Number of common and rare SBS signatures in each cohort. (E) Common SBS signatures as a function of number of samples analyzed. (F) Rare SBS signatures as a function of number of samples analyzed. (G) Procedure to determine the Reference Signatures from all the cohort-organ signatures identified. Numbers refer to the SBS signatures analysis. For details, see Materials and Methods.
Fig. 2
Fig. 2. SBS signatures across 18,640 WGS cancers.
(A) Frequency of SBS signatures in the present study. Orange bars highlight 42 signatures reported in this study and present in COSMIC v3.2. Blue bars highlight 40 previously unreported signatures found in the present analysis. (B) Same information as A with log scale on y-axis. (C) Four previously unreported (SBS107, SBS100, SBS110 and SBS121) and five recently reported (SBS92, SBS93, SBS94,SBS125, and SBS127) common SBS signatures found in many organ systems. (D) Previously unreported common SBS signatures found in single organs only. (E) A few examples of previously unreported rare signatures. TSB, transcriptional strand bias; RSB, replication strand bias. SBS signatures can be browsed here: https://signal.mutationalsignatures.com/explore/study/6?mutationType=1.
Fig. 3
Fig. 3. DBS signatures across the cohort.
(A) Frequency of DBS signatures in the present study. (B) Flanking sequence context surrounding mutated dinucleotides of DBS11, which is correlated with APOBEC-related SBS2, to demonstrate a preference for TpCCpN context similar to the TpCpN sequence predilection of APOBECs. (C) Correlation of DBS with SBS exposures across cohorts. Numbers in each column report the number of organs implicated in the correlative analyses. A correlation is computed independently for each organ and the correlations are displayed as a boxplot. Boxplots denote median (horizontal line) and 25th to 75th percentiles (boxes). The lower and upper whiskers extend 1.5×IQR (IQR: inter-quartile range). (D) Examples of previously unreported DBS signatures. (E) Samples with TBS1. The total number of samples and total number of TNVs are too low to perform a formalmutational signature analysis. All DBS signatures identified in the present study can be browsed here: https://signal.mutationalsignatures.com/explore/study/6?mutationType=2.
Fig. 4
Fig. 4. Signatures associated with endogenous mutational processes.
(A) Five signatures characterized by substitutions at NCG nucleotides are contrasted to each other. SBS profiles are shown, along with prevalence of signatures across three cohorts (GEL, ICGC and Hartwig), transcriptional strand bias (TSB) and replication strand bias (RSB). (B) Mutationburdens associated with each signature in all tumor-types. SBS1 is common and seen in all cohorts in many tumor-types. SBS95, SBS96, SBS87, and SBS105 are rare and are associated with a higher mutation burden when compared to SBS1. Y-axis shows mutation count on log-scale. Summaries comparing signatures in etiological groupings can be found here: https://signal.mutationalsignatures.com/explore/study/6. (C) SBS96 signature and prevalence among samples in the three cohorts. The Venn diagram illustrates the number of patients in GEL with SBS96 and biallelic loss ofMBD4. (D) SBS108 signature and prevalence among samples in the three cohorts. The Venn diagram illustrates the number of patients in GEL with SBS108 and biallelic OGG1 G308E. (E) SBS30 signature and prevalence among samples in the three cohorts. The Venn diagram illustrates the number of patients in GEL with SBS30 and biallelic loss of NTHL1. Only samples with SBS30 were inspected for NTHL1 mutations.(F) SBSs associated with MMR and POLE/POLD gene defects. (G) Proportion of samples across GEL organs with MMR or POLE/POLD defects related signatures or with high HRDetect score. (H) Proportion of samples with MMR biallelic loss and/or POLE/POLD dysregulation in each group of samples presenting an SBS mutational signature in (F). (I) Proportion of HRDetect-high samples with biallelic loss in genes linked to homologous recombination repair, number of samples in parenthesis.
Fig. 5
Fig. 5. Signatures associated with environmental mutational processes.
(A) SBS signatures occurring at CCN and TCN, with similarities to UV-related SBS7a. (B) Correlations of the signatures in (A) with DBS signatures. (C) SBS signatures presenting T>A, with similarities to AAI-associated SBS22. (D) SBS signatures indicating prior platinum exposure. (E) Correlations of the signatures in (D) with DBS signatures. (F) SBS signatures presenting C>A with similarities to tobacco-associated SBS4. (G) Correlation of the signatures in (F) with DBS signatures. Numbers in each column report the number of organs implicated in the correlative analyses. A correlation is computed independently for each organ and the correlations are displayed as a boxplot. Boxplots denote median (horizontal line) and 25th to 75th percentiles (boxes). The lower and upper whiskers extend 1.5×IQR.
Fig. 6
Fig. 6. A summary of SBS signatures and DBS signatures in CNS tumors from GEL.
(A) Number of CNS tumors from cohorts of GEL, ICGC and Hartwig. (B) Most CNS tumors have common signatures only (light blue in pie chart) and a fraction have one rare signature (maroon). Numbers for pie chart wedges of less than 5% not shown. (C) Common SBS signatures in CNS GEL tumors. (D) Previously reported rare SBS signatures in CNS GEL tumors. (E) Prreviously unreported rare SBS signatures in CNS GEL tumors. (F) DBS signatures in CNS GEL tumors. (G) Distribution of mutational signatures in all CNS GEL tumors. For each sample, the total number of mutations is shown in log scale, while signature exposure proportions are colored linearly. Samples are clustered according to the exposure proportions using hierarchical clustering with average linkage. (H) Mutational frequencies ofcommon and rare signatures of CNS GEL cancers. Numbers at the bottom indicate the numbers of samples with each signature.
Fig. 7
Fig. 7. Illustration of common and rare mutational signatures in cancer samples and the workflow of FitMS.
Schematic depiction of common (gray and lighter colors) versus rare signatures in three example tumor-types (breast, central nervous system (CNS) and colorectal cancers). Each patient could have different amounts of some (or all) of the common signatures. Occasionally, a patient may carry a rare signature as well (bright colors). Some common signatures are ubiquitous and present in nearly all tumor-types while some common signatures may be restricted to some tumor-types. Rare signatures may be unique (for example, yellow dot) or could also occur in other tumor-types (for example, red dots). We propose a practical package, FitMS that utilizes the insights obtained through this work. Given a new sample, for example, a new brain cancer WGS mutation catalog, FitMS will fit common CNS signatures before attempting to discover additional rare signatures seen in CNS and other tumors.

Similar articles

Cited by

References

    1. Sung H, et al. Global Cancer Statistics 2020: GLOBOCAN Estimates of Incidence and Mortality Worldwide for 36 Cancers in 185 Countries. CA Cancer J Clin. 2021;71:209–249. - PubMed
    1. Stratton MR, Campbell PJ, Futreal PA. The cancer genome. Nature. 2009;458:719–724. - PMC - PubMed
    1. Bentley DR, et al. Accurate whole human genome sequencing using reversible terminator chemistry. Nature. 2008;456:53–59. - PMC - PubMed
    1. Helleday T, Eshtad S, Nik-Zainal S. Mechanisms underlying mutational signatures in human cancers. Nat Rev Genet. 2014;15:585–598. - PMC - PubMed
    1. Alexandrov LB, et al. Signatures of mutational processes in human cancer. Nature. 2013;500:415–421. - PMC - PubMed

Publication types